SITE-BOND LATTICE MODELLING OF DAMAGE PROCESS IN
NUCLEAR GRAPHITE UNDER BENDING
Craig N Morrison1, Mingzhong Zhang2, Dong Liu3 and Andrey P Jivkov1
1
Modelling and Simulation Centre, School of Mechanical, Aerospace and Civil Engineering, The University of Manchester, Manchester, UK
2
Advanced & Innovative Materials Group, Department of Civil, Environmental and Geomatic Engineering, University College London, London, UK
3
Interface Analysis Centre, School of Physics, University of Bristol, Bristol, UK
ABSTRACT
Graphite is used as neutron moderator and structural material in the core of the UK's fleet of Magnox and Advanced Gas-cooled Reactors (AGRs). The graphite cores are non-replaceable in these two designs and therefore potentially life-limiting. Graphite is a multi-phase, aggregated and porous material which could have a non-linear stress-strain response because of distributed damage accumulation within the material prior to rupture: quasi-brittle characteristics. Lattice models provide a way of capturing the resulting non-linear behaviour by incorporating microstructural features and damage mechanisms within the discrete system. Here, the 3D site-bond model (Jivkov and Yates 2012) is used to simulate a near-isotropic nuclear reactor core Gilsocarbon graphite under bending in a micro-cantilever test (Liu et al 2014). Experimentally measured pore-size distributions and volume densities are used for model construction. Previous work on graphite site-bond modelling (Morrison et al 2014b) is further developed to consider pore effect on the deformation and failure behaviour of the bonds. Damage evolution and accumulation with increasing load is simulated by the consecutive removal of bonds subject to failure criterion. The simulated mechanical properties and force-deflection relationship were validated by experimental results.
Keywords: Site-bond model; Nuclear graphite; Micro-cantilever bending; Local damage; Microstructure
INTRODUCTION
Graphite has been used in the nuclear industry as a fast neutron moderator since the first demonstration of a chain nuclear reaction in the 1940s. Moreover, its high strength at elevated temperatures within reactors has allowed it to be coupled as a structural component in some reactor designs (Mantell 1968). The three-phase microstructure of graphite varies depending on the raw materials and the manufacturing process used. Filler particles, deriving from petroleum or pitch coke, are dispersed within a binder material matrix, usually consisting of graphitised coal-tar pitch. Both of these solid phases host various populations of pores covering different length scales (Jenkins 1962). Graphite is believed to belong to the quasi-brittle class of materials (Hodgkins et al 2010), with structural integrity considered to be dependent on material failures at the length scales of its prominent microstructure features. The initiation of brittle micro-cracks, considered to be at pores, dissipates energy resulting in a reduction in the global stiffness prior to peak stress in a similar manner to plasticity; and this is followed by a post peak softening. Ultimate failure is considered to be the result of micro-crack growth and coalescence into a flaw of critical size.
dictated by phenomena at the micro-scale, such as the region ahead of a crack tip. In such cases additional local information is required.
Various modelling approaches have been proposed to account for local effects either statistically, using weakest link statistics (Nemeth and Bratton 2010), or within continuum-based framework such as cohesive zone models (de Borst 2002). However, these approaches are limited by the reliance on phenomenological calibration against macro-scale data. Lattice models are a branch of discrete models whereby nodes are connected by elements into a statistically parallel network. Such models have been developed for quasi-brittle materials including graphite (Schlangen et al 2010; Nemeth and Bratton 2010) and concrete (Schlangen and Garboczi 1997, Schlangen 2008) with incorporation of microstructural information into element properties allowing the production of macro-scale behaviour inclusive of micro-failure mechanisms. Many of these are 2D, as 3D configurations investigated could not reproduce desired Poisson’s ratio values. The model used in this work is a 3D site-bond model proposed by Jivkov and Yates (Jivkov and Yates 2012), which has been shown to be able to reproduce the range of Poisson’s ratio required for quasi-brittle materials.
The work described here focuses on Gilsocarbon graphite, named as such due to the Gilsonite coke from which it is manufactured, which is used as moderator and life-limiting core structural material in the 14 operating Advanced Gas Cooled Reactors (AGR) in the UK. Specifically the site-bond model will be used to simulate the load-displacement response achieved experimentally in a micro-cantilever experiment using statistical microstructure data for Gilsocarbon graphite. Results presented include experimentally validated force-displacement relations using a 2-phase model, with relatively good agreement considering the large spread of experimental results. The accumulation of damage and global failure is shown to have been captured.
EXPERIMENTAL PROCEDURE
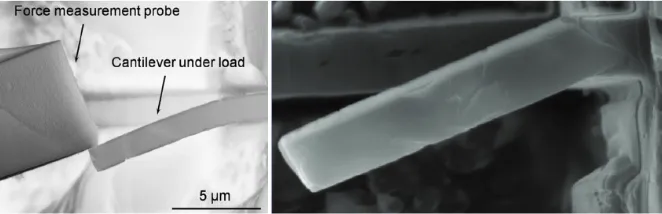
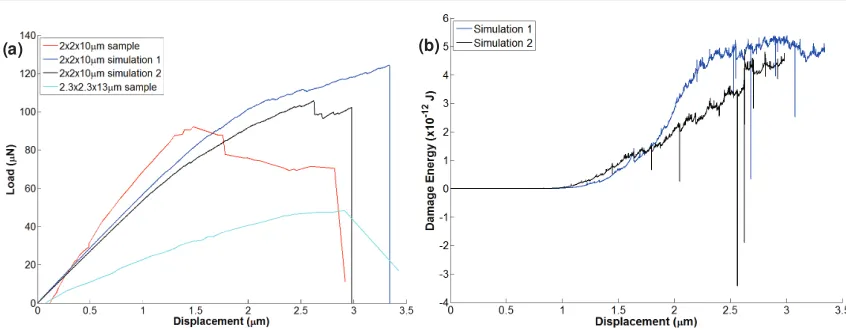
Mechanical testing over a range of length scales is important for materials, such as graphite, exhibiting a significant size-effect as a result of prominent heterogeneous microstructure. One particular novel technique for testing at the micro-scale uses micro-cantilever specimens milled into a bulk sample by focused ion beam. The technique is outlined in more detail by Liu et al (Liu et al 2014) with the results from that particular work forming the experimental validation used here. The new procedure adopted produced no taper at the root of the micro-cantilevers and the setup allows the observation of the cantilever beam throughout the loading process, Fig. 1a. Several graphite beams were milled and tested. The experimental sample used for modelling was chosen as 2×2×10 ʅm. The results for this particular specimen were not published by Liu et al (Liu et al 2014) but have been provided courtesy of the authors, Fig. 1b.
THEORY AND METHOD
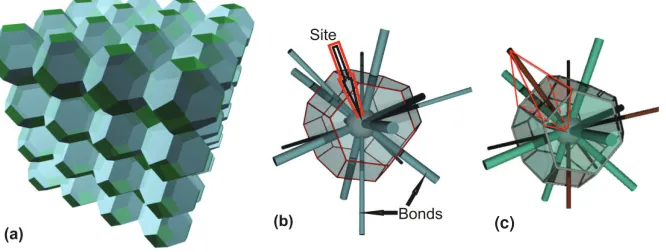
The site-bond model represents material volume through the use of a regular lattice of truncated octahedral cells, Figure 2a. This shape is considered the regularly tessellating shape most capable of representing a generic microstructure (Kumar et al 1992), and as such the lattice can be considered a topological homogenization of a microstructure. Sites are located at the centres of cells with each site connected to its 14 nearest neighbours by bonds. In this manner, the sites and bonds are considered the dual complex of the cell volumes and face areas respectively (Jivkov 2014a; Jivkov 2014b). Of the 14 bonds extending from a site, 6 bonds will pass through square faces in the principal directions and 8 bonds will pass through hexagonal bonds in the octahedral directions, yielding two geometrically distinct bond types, labelled B1 and B2 in Figure 2b. Principal bonds, B1, and octahedral bonds, B2, have lengths of L and ξ͵L/2 respectively, where L is the cell length. The proportion of the cell volume directly associated with each bond is termed the support volume, Figure 2c.
Figure 2. (a) The cellular structure of the site-bond model; (b) unit cell with bonds; (c) support volume, highlighted in red, for a bond through a principal face
The topology of the site-bond model represents the aggregate microstructure of quasi-brittle materials by allocating a filler particle/aggregate, the size of which is chosen from a distribution, to each site. As such the bonds between sites represent the brittle micro-failures which occur both within and between the particles. First models for concrete (Jivkov et al, 2012; Jivkov, 2014) used beam elements for bonds which introduced micro-polarity not amenable to analytic calibration. Later models for graphite (Morrison et al 2014a, Morrison et al 2014b) and cement-paste (Zhang et al 2014a) represented the bonds with spring bundles, where each spring resisted separate translational degree of freedom. Spring behaviour was calibrated by equating energy within a cell to that of a continuum (Zhang et al 2014b). This methodology enabled a good representation of isotropic elastic materials with Poisson’s ratio ranging from -1 to 0.5. However, it was not compatible with the geometric discretization theory (Yavari 2008), whereby balance of angular momentum dictated a single force between displaced positions of sites. As a result the model failed to capture deformations in non-linear displacement fields, such as bending. To overcome this, bonds are represented in this work by connector elements, which come as standard in the commercial finite element software ABAQUS (Simulia 2013), and the behaviour is calculated as geometrically non-linear. Connectors allow damage, failure and subsequent energy dissipation to be readily introduced. The 1D connector element which represents each bond has a single stiffness value representing the resistance to a length change. The stiffness values of the axial springs from the previous calibration methodology (Zhang et al 2014b) are given in Equations 1a and 1b. These are used as a first approximation in the present work; a calibration procedure more suitable for this model is a subject of ongoing work.
ܭ ൌ ா
ସሺଵାఔሻሺଵିଶఔሻǢ ܭൌ
ሺଵାଶఔሻா
ସሺଵାఔሻሺଵିଶఔሻ (1a,b)
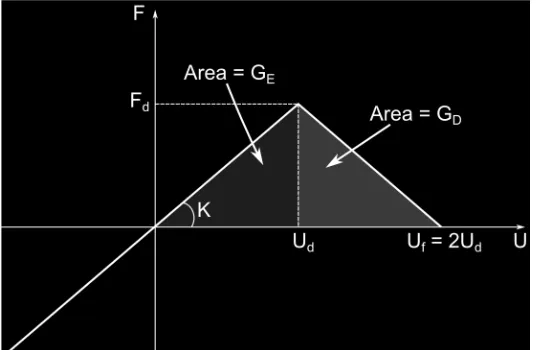
The full mechanical response of a bond is shown in Figure 3. The peak force, Fd and displacement at
which damage initiates, Ud are calculated from the bond stiffness and failure energy, Gc, which in turn is the sum of the elastic GE and damage GD energies. The value for Gc is taken as the product of the face
area through which the bond passes, A0, and the enthalpy for creation of two surfaces in graphite, Ȗ. The
value of Ȗ is taken as 9.7 J/m2 (Abrahamson 1973). Once the relative displacement of the bond reaches the displacement Uf it is deemed to have failed and is removed from the simulation. Initially Uf is set at 2Ud.
Figure 3. Bond failure criteria, relative force, F against relative displacement, U
Due to the models highly nonlinear behaviour, several controls were utilized and default settings relaxed in order to overcome the difficulties in obtaining a converged solution. Viscous regularization was implemented to damp the dissipation of energy released to the surrounding elements upon damage and subsequent failure of an element. A damping coefficient of 1×10⁻⁵ was used, a value considered to help the solution converge without introducing significant artificial energy into the system. Moreover the extrapolation method was suppresed to prevent excess iterations when finding the equilibrium position of nodes connected to failed elements and the quasi-newton method for quasi-static analyses was utilized.
MICROSTRUCTURE MAPPING
at the base of the cantilever fixed and a displacement applied to the nodes along the top edge of the opposite surface. Figure 4 shows the results of the study, whereby the number of cells along the beams cross-section are plotted against E, calculated according to simple beam bending theory. The limiting assumptions in this theory are most probably the reason that the value of E appears to be tending to a value slightly above the input value. A cross section of 12 cells was chosen as a compromise between accuracy and the considerable computational expense. Figure 4b shows the the lattice size with the applied boundary conditions.
Figure 4. Cell sensitivity study
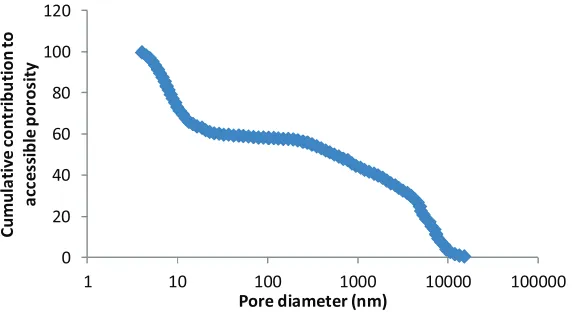
The pore distributions and volume fractions used to populate the model followed those obtained by Laudone et al (Laudone et al 2014) using pycnometry and mercury porosimetry. The pore size distribution from one of the samples presented by Laudone is shown in Figure 5. The distribution covered the porosity expected within the cantilever beam, ranging from 4 nm diameter to 15 ʅm, although realistically due to the decreasing number density with increasing pore diameter, the largest pores seen in the model typically did not exceed 0.9 ʅm in diameter.
Figure 5. The pore size distribution used to populate the model, recreated from (Laudone et al 2014) Ϭ
ϮϬ ϰϬ ϲϬ ϴϬ ϭϬϬ ϭϮϬ
ϭ ϭϬ ϭϬϬ ϭϬϬϬ ϭϬϬϬϬ ϭϬϬϬϬϬ
Ƶ
ŵ
Ƶ
ůĂ
ƚŝ
ǀ
Ğ
Đ
Ž
Ŷ
ƚƌ
ŝď
Ƶ
ƚŝ
Ž
Ŷ
ƚ
Ž
Ă
ĐĐ
Ğ
ƐƐ
ŝď
ůĞ
Ɖ
Ž
ƌŽ
Ɛŝ
ƚLJ
The distributions presented by Laudone accounted only for pore volume accessible to the mercury intrusion, with the closed pore volume calculated separately from the density of the samples. The pore volume fraction used as input to the model was the average minimum total porosity (i.e. both open and closed) across all the samples under the assumption that the closed porosity would follow the same size distribution as the open porosity. This value was 19.14%.
Pores were selected randomly from the distribution before being assigned to a randomly selected bond. This process was repeated until the desired pore volume fraction was achieved. This process was found to be time-consuming and largely unnecessary when considering the smaller pores which made up the majority of those selected. The mismatch between the cell size and the size of the smaller pores meant that many pores were assigned to each face when populating the model. This essentially smeared out the effect of the smaller pores with the minority of larger pores selected from the tail-end of the distribution dictating when the model reached the target porosity. In response to this an arbitrary cut-off point (significantly lower than the critical pore size for a cell face) was chosen, whereby the cumulative volume fraction of the pores beneath this point and thence the cumulative volume could be divided by the total number of bonds and assigned to every face as a single effective-pore. A volume bias was implemented so octahedral bonds received a greater share of this porosity than principal bonds in accordance with its greater associated support volume. This allowed a simple treatment of approximately 75% of the bonds and resulted in each bond being 15% failed (i.e. 15% of its volume was occupied by pores) before larger pores were assigned.
Micro-cracks are considered to initiate at pores and as such pores are represented in the model by a change in bond mechanical response. The pore-free response, Figure 3, was scaled according to the size of the pore present on the particular face, as shown in Figure 6. The change of peak force from the pore-free value, Fd, to the new value, F’d, is related to the change of an effective area, Equation 2:
ிᇱி ൌ ቀ
ᇱ ቁ
ଶ ଷൗ
(2)
where V is the support volume of the face and V’ is the support volume remaining after the corresponding pore volume is removed, Equation 3:
ܸᇱൌ ܸௌ௨௧௩௨െ ܸ (3)
In the same manner, the displacement at which damage initiates, Ud, scales to the new value, U’d
according to the change an effective length, Equation 4:
ᇱ ൌ ቀ
ᇱ ቁ
ଵ ଷൗ
(4)
The stored elastic energy, GE, thus scales with the change of support volume, Equation 5:
ᇱிᇱ ி ൌ
ᇱ
(5)
Differently, the damage energy, GD, is considered to scale with the real face area, Equation 6:
൫ᇱିᇱ൯ிᇱ ൫ି൯ி ൌ
ᇱ
(6)
ܣᇱൌ ܣிെ ܣ (7)
In this manner the failure displacement, Uf’ reduces proportionally less from the pore-free value than the damage displacement Ud’ so response exhibits less softening as the pore size is increased and essentially becomes more brittle.
Figure 6. Bond failure criteria accounting for the affect of porostiy
Bonds were removed prior to simulations if the assigned pores were larger than their support volumes. To accomodate pores at the tail-end of the distribution, i.e. pores with volume significantly larger than the support volume, an algorithm was implemented whereby if the volume of a pore was enough to fail a bond, the excess pore volume was then designated to neighbouring bonds until there was no excess volume. In this manner, the largest pores could fail over 200 bonds of the 94578 bonds in the model depending on the predesessing conditions of the bonds.
RESULTS AND DISCUSSION
Figure 7. Experimental and computational (a) force-displacement; and (b) damage energy results for the 2×2×10ʅm cantilever beam.
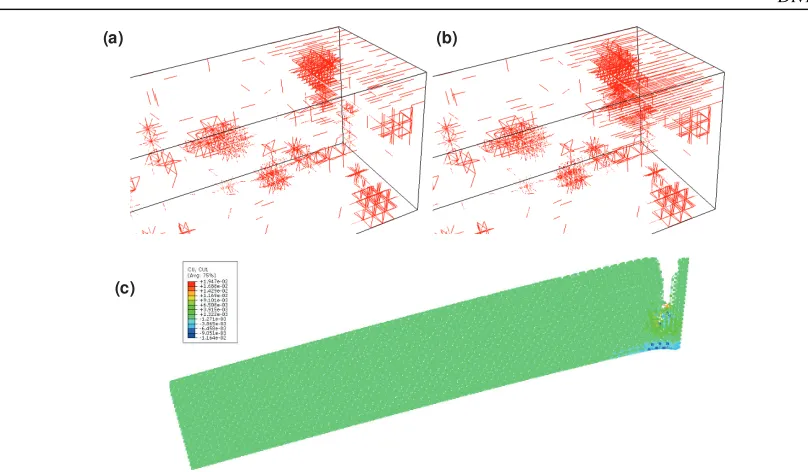
The open-source software ParaView was used to visualise damage within the model. Figure 8 shows the initial porosity for simulation 2, where the clusters of failed bonds representing large pores are clearly visible. Figures 9a and 9b show the development of failed bonds within the model - at an intermediate load increment corresponding to a displacement of 2.2 ʅm and the final increment before final failure, respectively. These represents the distributed damage within the deformed volume prior to the fracture at peak load, which is consistent with the observation of other workers (Hodgkins 2010) It can be seen from Figures 9a and 9b that damage occurs at the root of the beam leading to shearing at the wall. It appears that failed bonds are primarily principal bonds and the damage progresses from the bonds loaded in tension along the top surface, vertically down through the sample as the load is increased and the tension bearing bonds fail. This crack development from top to bottom, as seen in Figure 9c, is largely to be expected, although it differs slightly from that seen experimentally, Figure 1b, where the crack begins on the top surface but away from the root before progressing towards the root. This discrepancy suggests there may be additional complexity of the local microstructure of that particular beam has not been experimentally determined, hence not considered in the modelling.
Figure 8. Initial porosity for simulation 2
Figure 9. Failed bonds after: (a) 3000 increments; (b) final increment. (c) Relative displacement in the failed model
CONCLUSION
The site-bond technology has been adapted to consider a two-phase (matrix and pores) graphite micro-cantilever beam. Results are promising and physically realistic, but slight discrepancy between experimental and simulated force-displacement results has been observed. This can be attributed to the large spread seen from sample to sample in the physical tests. The failure of the beam occurs after accumulation of damage at its root with the distributed porosity throughout the rest of the beam having apparently negligible effect to the point of global failure. Further work will involve implementation of the site-bond methodology to graphite under different loading conditions with a view to visualisation of damage accumulation and derivation of a damage evolution law. Furthermore, it is necessary to explore new avenues for model calibration that are consistent with discretized elasticity theories (Yavari 2008).
ACKNOWLEDGEMENTS
Craig N Morrison acknowledges the support from EPSRC via Nuclear FiRST Doctoral Training Centre. Mingzhong Zhang, Dong Liu and Andrey P Jivkov acknowledge the support from EPSRC via grants EP/J019763/1 and EP/J019801/1, “QUBE: Quasi-Brittle fracture: a 3D experimentally-validated approach”. Moreover Mingzhong Zhang and Andrey P Jivkov acknowledge BNFL through the Research Centre for Radwaste & Decommissioning.
REFERENCES
Abrahamson, J. (1973). “The surface energies of graphite”. Carbon, 11, 337-362.
Berre, C., Fok, S.L., Marsden, B.J., Babout, L., Hodgkins, A., Marrow, T.J., Mummery, P.M. (2006). “Numerical modelling of the effects of porosity changes on the mechanical properties of nuclear graphite”. Journal of Nuclear Materials, 352, 1-5.
(a) (b)
de Borst, R. (2002). “Fracture in quasi-brittle materials: a review of continuum damage-based approaches”. Engineering Fracture Mechanics, 69, 95-112.
Hodgkins, A., Marrow, T.J., Wootton, M.R., Moskovic, R., Flewitt, P.E.J. (2010). “Fracture behaviour of radiolytically oxidised reactor core graphites: a view”. Materials Science and Technology, 26(8), 899-907.
Jenkins, G. (1962). “Fracture in reactor graphite”. Journal of Nuclear Materials, 3(3), 280-286.
Jivkov, A.P. (2014). “Structure of micro-crack population and damage evolution in quasi-brittle media”.
Theoretical and Applied Fracture Mechanics, 70, 1-9.
Jivkov, A.P., Gunther M, Travis KP (2012). “Site-bond modelling of porous quasi-brittle media”.
Mineralogical Magazine, 76(8), 2969-2974.
Jivkov, A.P., Morrison, C.N., Zhang, M. (2014a) “Site-bond modelling of structure-failure relations in quasi-brittle media”, Procedia Materials Science, 3, 1872-1877.
Jivkov, A.P., Todorov, T., Morrison, C.N., Zhang, M. (2014b) “Application of analysis on graphs to site-bond models for damage evolution in heterogeneous materials”, Proc. 11th World Congress on Computational Mechanics and 5th European Conference on Computational Mechanics.
Jivkov, A.P. and Yates, J.R. (2012). “Elastic behaviour of a regular lattice for meso-scale modelling of solids”. International Journal of Solids and Structures, 49(22), 3089-3099.
Kumar, S., Kurtz, S.K., Banavar, J.R., Sharma, M.G. (1992), “Properties of a three-dimensional Poisson-Voronoi tessellation: A Monte Carlo study”, Journal of Statistical Physics, 67(3-4), 523-551. Liu, D., Heard, P.J., Nakhodchi, S., Flewitt, P.E.J. (2014), “Small-Scale Approaches to Evaluate the
Mechanical Properties of Quasi-Brittle Reactor Core Graphite”. ASTM symposium, Graphite Testing for Nuclear Applications: The Significance of Test Specimen Volume and Geometry and the Statistical Significance of Test Specimen Population, ASTM International, 1-21.
Laudone, G.M., Gribble, C. M., Matthews, G. P. (2014). “Characterisation of the porous structure of Gilsocarbon graphite using pycnometry, cyclic porosimetry and void-network modeling”. Carbon, 73, 61-70.
Mantell, C.L. (1968). Carbon and Graphite Handbook, Interscience Publishers
Morrison, C.N., Zhang, M. Jivkov, A.P. (2014a). “Discrete lattice model of quasi-brittle fracture in porous graphite”. Materials Performance and Characterization, 3, 414-429, ASTM International Morrison, C.N., Zhang, M., Jivkov, A.P. (2014b). “Fracture energy of graphite from
microstructure-informed lattice model”. Procedia Materials Science, 3, 1848-1853.
Nemeth, N. Bratton, R. (2010). “Overview of statistical models of fracture for nonirradiated nuclear-graphite”. Nuclear Engineering and Design, 240, 1-29.
Schlangen, E. (2008). “Crack development in Concrete, Part 2: Modelling of Fracture Process”. Key Engineering Materials, 385-387, 73-76.
Schlangen, E., Flewitt, P.E.J., Smith, G.E., Crocker, A.G., Hodgkins, A. (2010). “Computer Modelling of Crack Propagation in Porous Reactor Core Graphite”. Key Engineering Materials, 452-453, 729-732.
Schlangen, E. and Garboczi, E. (1997). “Fracture simulations of concrete using lattice models: computational aspects”. Engineering Fracture Mechanics, 57(2), 319-332.
Simulia, Abaqus Version 6.13 Documentation, Dassault systemes, 2013.
Turner, M.J., Clough, R.W., Martin, H.C., Topp, L.J. (1956). “Stiffness and Deflection Analysis of Complex Structures”, Journal of Aeronautical Sciences, 23(9), 805-824.
Yavari, A. (2008). “On geometric discretization of elasticity”, Journal of Mathematical Physics, 49(2), 022901.
Zhang, M., Morrison, C.N., Jivkov, A.P. (2014a). “A lattice-spring model for damage evolution in cement paste”, Procedia Materials Science, 3, 1854-1859.