INHERITANCE OF QUANTITATIVE CHARACTERS IN ZEA MAYS. I. ESTIMATION OF THE NUMBER OF GENES CONTROLLING
THE TIME OF MATURITY
ALY H. MOHAMED
Department of Gemtics, Alexandria University, Alexandria, Egypt
Received December 3, 1958
HE estimation of the number of gene pairs controlling quantitative characters
T
is a great challenge to geneticists. While the study of discontinuous variations is relatively simple, that of continuous variations is complicated, since such a study is concerned with multiple factors, heterosis, dominance and the nature of the interactions between the genes differentiating these quantitative characters. The method suggested by ANDERSON (1938) using chromosomal interchanges as tools for detecting the number of gene pairs controlling quantitative characters, and applied by BURNHAM and CARTLEDGE (1939), SABOE and HAYES (1942), MILLER (1951), IBRAHIM (1954) and MOHAMED (1954,1956), will not reveal the type of gene interactions. The chromosomal interchanges used in such studies were not in an isogenic background, which limits the final conclusions. Therefore, the methods given by EMERSON and EAST (1913) andPOWERS
(1950a) are very adequate if the genetic and environmental variabilities are following the same scale of measurement and the gene effects are additive on such a scale.POWERS, LOCKE and GARRETT (1950) suggested and described a method for estimating the number of genes controlling quantitative characters. This method is based on partitioning the backcrosses and F, populations into their component genotypes. Also it involves the separation of environmental and genetic variances from the total variances with the purpose of determining the nature of all these variances. This can be accomplished from the three nonsegregating populations, namely, P,, F,, and P,, and the three segregating populations,
B,
to PI, F,, andB, to P,. The latter are essential in arriving at the entire genetic hypothesis. The study in this paper will be limited to the estimation of the number of genes controlling the number of days from seeding to silking and pollen shedding. Also the number of gene pairs differentiating the two parents for the difference of days between silking and pollen shedding will be discussed. The time of maturity was used in these studies because of its importance in the production of hybrid corn,, since differences between inbreds with respect to this character will affect the general output of the yield.
MATERIAL A N D METHOD
The hybrid populations were obtained from a cross between E.G. 102 (PI), and
E.G. 205 (P2) maize inbred lines, which were kindly furnished to the author by
714 A. H. M O H A M E D
study of the experiment included PI, B, to P,, F,, F,, B, to P,, and P, populations. The field design of the experiment was a randomized complete block. Planting of the experiment started in the summer of 1955, at the University of Alexandria Experimental Farm. The above two inbreds were selected for this study because they are considered very promising in the Ministry of Agriculture program for producing hybrid corn for commercial use.
The dates of silking and pollen shedding were recorded once daily on the same plant. The means and the standard deviations were calculated to study the phenotypic dominance. The environmental and genetic variances were estimated according to the method suggested by POWERS ( 1942)
,
and POWERS et al. (1950). I n testing for the proper scale, the method discussed by POWERS et al. (1950) andPOWERS (1 95 1 ) was used.
EXPERIMENTAL RESULTS
1. Silking date
One of the essential steps in studying any continuous character is to determine the type of scale of measurement which fits better the biological processes causing the variability.
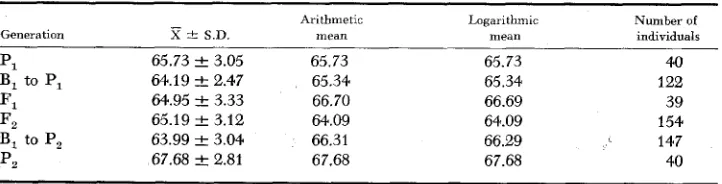
It can be seen from Table 1 that neither the arithmetic scale (on an additive base) nor the logarithmic scale agreed with the obtained means. The mean values for the number of days from seeding to silking date showed that E.G. 102 (P,) had a mean of 65.73 days and E.G. 205 (P,) a mean of 67.68 days. The difference between the two inbred lines was 1.95 days with a P value of 0.01. The mean of E.G. 102 (P,) was slightly higher than that of the F1 (64.95 days), but the difference was within the limits of variation expected due to the errors of random sampling. The mean of B, to PI (64.19 days) was less than the mean of PI, with a difference of 1.54 days. This difference was significant. However,
x2
test showed that the frequency distribution of B, to P, was not significantly different from that of PI and F,, sincex2
value was 13.0179 with a P value of .20-.10 (d.f. 8). Also “t” tests indicated that the mean of the F, did not differ significantly from the mean of B, to P,. From the above analysis it was concluded that phenotypic dominance was complete for fewer days over more days.TABLE 1
The obtained and the calculated means on the basis of both arithmetic and logarithmic scales for the number of days from seeding to silking
Arithmetic Logarithmic Number uf
Generation
x
-C S.D. mean mean individualsPl 65.73
-+
3.05 65.73B, to P, 64.19 -C 2.47 65.34 Fl 644.95 f 3.33 66.70
F, 65.19
-+
3.12 64.09B, to P, 63.99 -+ 3.04 66.31 p2 67.68 & 2.81 67.68
65.73 40
65.34 122
66.69 39
64.09 154
66.29 147
TIME O F MATURITY I N MAIZE 715 The fact that the genetic variance (Table 2) of B, to P, was not significant and was very small compared with that of F, and B, to P,, indicated that genic dominance was also complete.
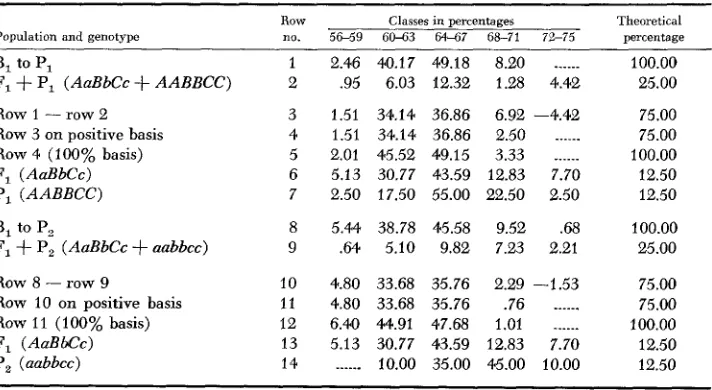
Number of major gene pairs differentiating parents: On the basis of the segre- gating generations, the assumption was made that the two parents were differ- entiated by three major gene pairs. The indication that three major gene pairs were involved was arrived at from the fact that only 1.95 percent of the individuals in the F, population fell in the class 65-69, whereas on a three- factor basis, 1.6 percent would be expected (Table 3 ) . Also the indication was further supported by dividing 0.68 percent (class 72-75 of B, to P,) by 7.70 per- cent (class 72-75 of F,) which gave a value of 8.83 percent. On a three-factor basis, a ratio of 12.5 percent would be expected.
When the theoretical means of F, and B, to P, for one factor pair of genes, two pairs and three pairs were compared with the obtained means of these two popu- lations (Table 4), it appeared that the calculations based on the hypothesis that the two inbred lines were differentiated by three major gene pairs was probably the best fit. Accordingly, the genotype of P, (E.G. 102) was symbolized as
AABBCC and of the P, (E.G. 205) as aabbcc.
The B, to P, and B, to P, frequency distributions were partitioned into their component genotypes (Table 5 ) . This partitioning will give the frequency distri-
TABLE 2
The means, standard deviations, variances and number of individuals in each population
for the number of days from seeding to silking
-
Population XPI 65.73 B, to P, 64.19
Fl 64.95 F* 65.19
B, to P, 63.99
p, 67.68
S.D.
3.05 2.47 3.33 3.12 3.04 2.81
Total variance
5.788 4.581 6.485 9.538 7.874 6.586
Environmental variance
_ _ _ _ _ _
6.345 6.580 6.453 6.430 6.610 6.051
Genetic variance
- .557 -1.999
.033 3.108 1.264
.535
Number of
individuals
40 1 22
154 147 40 39.
TABLE 3
Condensed frequency distribution for the number of days from
seeding to silking in percentages
Classes in percentages Number of
Population 56-59 60-63 64-67 68-71 72-75 individuals p, 2.50 17.50 55.00 22.50 2.50 4.0
B, to PI 2.46 40.1 7 49.18 8.20 ... 1 22
Fl 5.13 30.77 43.59 12.83 ' 7.70 39
p2 ... 10.00 35.00 45.00 10.00 40 F2 1.95 30.51 46.11 16.89 4.54 154
71 6 A. H. M O H A M E D TABLE 4
Theoretical values for the number of days from seeding to silking based on hypothesis that indicated the number of gene pairs diflerentiating the two inbreds
Number of Mean for
gene pairs F* B, to P,
1 69.1 66.70
2 65.82 69.10
3 65.65 66.95
Actual 65.19 & 3.12 63.99 k 3.04
TABLE 5
Partitioning of B , to P , and B , to P, frequency distribution into their component genotypes for the number of days from seeding to silking
Population and genotype
Row no.
Classes in percentages
5 6 5 9 60-63 64-67 68-71 7S-75
Theoretical percentage
B, to PI
F,
+
PI (AaBbCc+
AABBCC) Row 1 - row 2Row 3 on positive basis
Row 4 (100% basis)
F, (AaBbCc) P, ( A A B B C C ) B, to P,
F,
+
P, (AaBbCc+
nabbcc) Row 8-
row 9Row 10 on positive basis
Row 11 (100% basis)
F, (AaBbCc) P, (aabbcc)
10 11 I 2 13 14
2.46 40.17 49.18 8.20
______
.95 6.03 12.32 1.28 4.421.51 34.14 36.86 6.92 -4.42
1.51 34.14 36.86 2.50 ___.__
2.01 45.52 49.15 3.33 ~
_____
5.13 30.77 43.59 12.83 7.70 2.50 17.50 55.00 22.50 2.50
5.44 38.78 45.58 9.52 .68 .64 5.10 9.82 7.23 2.21
4.80 33.68 35.76 2.29 -1.53
4.80 33.68 35.76 .76 ~
____.
6.40 44.91 47.68 1.01 .____ ~
5.13 30.77 43.59 12.83 7.70
... 10.00 35.00 45.00 10.00
100.00 25.00
75.00 75.00 100.00 12.50 12.50
100.00 25.00
75.00 75.00 100.00 12.50 12.50
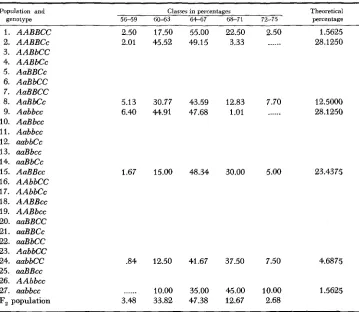
bution for the different genotypes in the B, to PI and B, to P, populations. Follow- ing the partition, a theoretical frequency distribution for the F, genotypes could be calculated. Twenty-seven genotypes would be expected in the F, generation. However, the following genotypes of the F, do not occm in either of the two backcross populations.
Group I A A BB cc
A A Bb cc A A bb CC A A bb Cc
Aa BB cc
Aa bb CC
aa %B CC
TIME O F MATURITY I N MAIZE 71 7
Group I1
A A bb cc
aa BB cc
A A bb cc
It can be seen that group I had two nonallelic dominant genes, while group I1
had only one dominant gene. The frequency distribution of the group I genotypes could be calculated by taking 66.67 percent of the P, distribution and 33.33
percent of the P, distribution ( SINGH 1949). The frequency distribution of group
I1 could be calculated by adding both the distributions of group I and P,, then
dividing by two, since this group, i.e., group 11, lies between both frequencies. This was based on the assumption that complete genic and phenotypic dominance exist. Table 6 gives the theoretical frequency distributions of the F, generation based on the above assumption.
TABLE 6
The F , generation frequency distribution partitioned into its component genotype on the basis of three-factor pairs for the number of days from seeding to silking
Population and genotype
~~~ ~ ~ ~ ~ ~~-
Classes in percentages Theoretical 56-59 60-63 64-67 68-71 72-75 percentage
1. AABBCC
2. AABBCc
3. AABbCC
4. AABbCc
5. AaBBCc
6. AaBbCC
7. AaBBCC
8. A a B K c
9. Aabbcc
10. AaBbcc
11. Aabbcc
12. aabbCc
13. aaBbcc
14. aaBbCc
15. AaBBcc
16. AAbbCC
17. AAbbCc
18. AABBcc
19. AABbcc
20. aaBBCC
21. aaBBCc
22. aaBbCC
23. AabbCC
24. aabbCC
25. aaBBcc
26. AAbbcc
27. aabbcc F, population
2.50 17.50 55.00 22.50 2.50 1.5625 2.01 45.52 49.15 3.33 _... 28.1250
5.13 30.77 43.59 12.83 7.70 12.5000 6.M 44.91 47.68 1.01 _...._ 28.1250
1.67 15.00 48.34 30.00 5.00 23.4375
.84 12.50 41.67 37.50 7.50 4.6875
718 A. H. MOHAMED
The
x 2
test for goodness of fit between the obtained and the theoretical F,frequency distributions gave a
x 2
value of 5.2938 with a P value lying between 0.20 and 0.10 (Table 7 j , indicating a good fit and supporting the hypothesis that the two parents were differentiated by three major gene pairs with respect to silking date.2. Pollen shedding
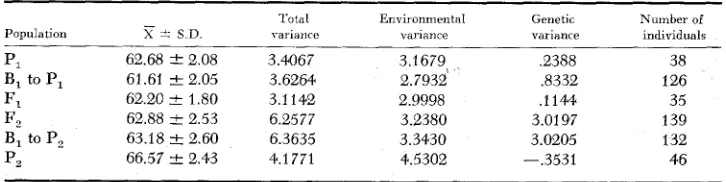
The mean values for the number of days from seeding to pollen shedding showed that P, (E.G. 102) and P, (E.G. 205) had mean values of 62.68 and 66.57 days respectively (Table 8 j .
The F1 cross between the two parents gave a mean value of 62.20 days, which was somewhat lower than that of
P,,
but the difference was insignificant. This fact indicated a complete phenotypic dominance of fewer days over more days. If this were true, then the B, to P, mean should not differ significantly from the means of either P, or F,. This was found to be true with respect to F, us. B, to P,,but not with P, us. E, to
PI.
However, since B, to PI gave a mean value less thanB, to Pi, then the conclusion would be justified as to the presence of complete
TABLE 7
Chi-square for goodness of fit between the obtained and the theoretical frequency distributions of
the F , population for the number of days from seeding to silking based on the assumption that the parents were differentiated b y three gene pairs
C l a s e s Number of
Population 56-59 60-63 64-67 68-71 72-75 individuals
I n percentages
Obtained 1.95 3C.51 46.11 16.89 4.54 154
Calculated 3.48 33.82 47.38 12.67 2.68 154
In numbers
Obtained 3 47 71 26 7 154
Calculated 5.36 52.08 72.97 19.51 4.13 154
x 2 = 5.2938
P .20-.10
d.f. = 3 (the last two classes on the left were grouped in one)
TABLE 8
T h e means, standard deuiations, uariances and number of indiuiduals in each population for the number of days from seeding to pollen shedding
Population
62.68 ? 2.08 61.61 2 2.05 62.20 I 1.80 62.88 1 2 . 5 3 63.18 -C 2.60 66.57 ? 2.43
Total variance
______
3.4067 3.6264 3.1142 6.2577 6.3635 4.1 771
Environmental variance
3.2679% 2.7932 2.9998 3.2380 3.3430 4.5302
Genetic vai iance
.e388 ,8332 ,1144 3.0197 3.0205 -.3531
Number of individuals
T I M E O F M A T U R I T Y I N M A I Z E 719 phenotypic dominance. The justification was arrived at by comparing the fre- quency distributions of the three populations, namely PI,
F,,
and B1 to P,.x2
test gave a value of 1.61 77 with a P value of .50-.3O (d.f. 2).By studying both the total variances and the genetic variances for PI, F, and
B1 to PI, it can be seen that the total variances did not differ significantly from each other and were less than those of
F,
and B, to P,. This supported the as- sumption of the occurrence of phenotypic dominance. By studying the genetic variances for the six populations it can be seen that the genetic variances of bothF, and B, to
P,
were much higher than B, to PI, which indicated complete genic dominance.Number of major gene pairs difJerentiating parents: On the basis of the segre- gating generations, Table 9, it was suggested that the parents were differentiated by two major gene pairs. This was arrived at from the fact that dividing 18.19 percent (class 66-74 of B, to
P,)
by 77.14 percent (class 61-65 of F,) gave a value of 23.58 percent, whereas on a two-factor basis a ratio of 25 percent would be expected. Also the indication was arrived at from the fact that only 10.88 percent of the individuals in the F, population fell in the class 66-74, whereas 6.25 percent would be expected on the basis of two factors. When the theoretical means of F, and B, to P, for one factor gene pair, two and three pairs were com- pared with the obtained means of these two populations (Table IO), it appeared that the calculation based on the hypothesis that the two inbreds were differ- entiated by two major gene pairs was the fit.TABLE 9
Condensed frequency distribution for the number of days from seeding to pollen shedding in percentage
Classes in percentages
Population 56-60 61-65 66-74 Number of individuals
Pl
B, to P,
B, t o P,
P,
21.05 78.95 ... 30.16 69.84 ... 22.86 77.14 ... 20.83 68.28 il 10.88
16.67 65.15 18.19 ... 34.78 65.22
38 126 35 139 132 46
TABLE 10
Theoretical values for the number of days from seeding to pollen shedding bused on hypothesis that indicated the number of gene pairs differentiating the two inbreds
Number of Mean for
gene pairs F* B, to P,
1 63.65 64.63
2 62.91 63.53
3 62.80 63.17
720 A. H. M O H A M E D
Following this, the backcrosses were partitioned into their component geno- types, Table 11.
Following this partition, a theoretical frequency distribution could be cal- culated for the F, population, Table 12. The
x2
test for goodness of fit between the theoretical and the obtained F, frequency distributions gave ax Z
value of .5469with a P value of .80-.70 (d.f. 2) indicating a good fit and supporting the hypo- thesis that the two parents were differentiated by two major gene pairs, Table 13.
3 . The difference in days between silking and pollen shedding
From the mean values given in Table 14, it can be seen that inbred E.G. 102
(P,) started shedding pollen 2.48 days, on the average, before silking. Mean-
TABLE 11
Partitioning of B, to P , and B, to P, frequency distributions into their component genotypes for the number of days from seeding to pollen shedding
Classes in percentages Theoretical Population and genotype Row 56-60 61-65 66-70 71-74 percentage
B, to P, 1
F,
+
P, ( A a B b+
A A B B )Row 1 - row 2
Row 3 (100% basis) 4
F, ( A a B b ) 5
B, to P, 7
2 3
P, ( A A B B ) 6
F,
+
P, (AaBb+
aabb) 8 Row 7 - row 8 9 Row 9 on a positive basis 10 ROW 10 (100% basis) 11P, (aabb) 13
F, ( A a B b ) 12
30.16 10.98 19.18 38.37 22.86 21.05 16.67 5.72 10.95 10.95 21.90 22.86 ... 69.84 39.03 30.81 61.63 77.14 78.95 65.15 27.99 37.16 37.16 74.32 77.14 34.78 ... ... ... ... ... 16.67 14.68 1.99 1.88 3.76 58.70 ... ... ... ... ... ... 1.52 1.63 -.I1 ... ... 6.52 100.00 50.00 50.00 100.00 25.00 25.00 100.00 50.00 50.00 50.00 100.00 25.00 25.00
TABLE 12
The I;, frequency distribution partitioned into its component genotypes on the basis o f two-factor pairs for the number of days from seeding to pollen shedding
Population and genotype
Cksses in percentages
56-60 61-65 66-70 71-74
Theoretical percentage A A B B
AaBB A A B b AaBb A A b b aaBB Aabb aaBb aabb F,
21.05 78.95 ... ...
30.16 69.84 ... ...
22.86 77.14 ... ...
16.67 65.15 16.67 1.52
16.67 65.15 16.67 1.52
... 34.78 58.70 6.52 20.83 68.28 9.91 .97
TIME O F MATURITY I N MAIZE 721 while, in the inbred E.G. 205 ( P2), the differences were 1.50 days. The magnitude of the difference between the two parents was .98 days. This difference was shown to be highly significant.
The means of P,, E’, and
B,
to P, were approximately the same. These means indicated complete phenotypic dominance of longer duration between silking and pollen shedding. The total variances of the three populations, P,, F,, and B, to P,were approximately the same, indicating complete genic dominance.
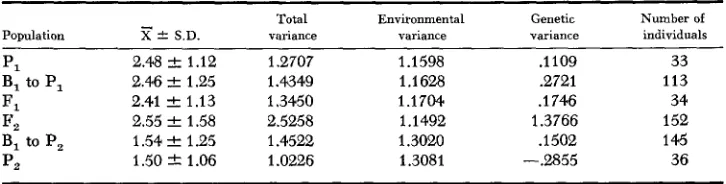
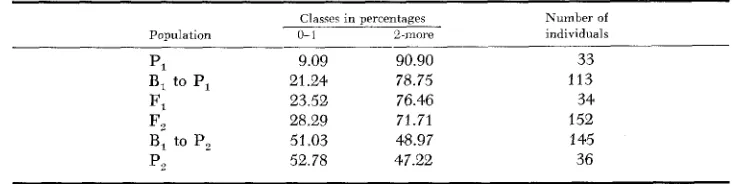
Number of gene pairs diflerentiating the two parents: The assumption was made that the two parents were differentiated by one major gene pair. This assumption was reached from the fact that only 28.29 percent of the individuals in the F,
population fell in the class 0-1, whereas, on a one gene pair, 25 percent would be expected (Table 15). The assumption was also arrived at by dividing 48.97 percent (class 2 or more of B, to P,) by 76.46 percent (the same class for F,) which gave a value of 64.05 percent. On the basis of one pair of genes, a 50 percent value would be expected.
On the assumption that one gene pair was responsible for the difference between silking and pollen shedding in the two parents, where PI was the domi- nant one, it would be expected that the frequency distributions of the three
TABLE 13
Chi-square test for goodness of fit between the obtained and theoretical Fe frequency distributions for the number of days from seeding to pollen shedding based on the assumption
that the two inbreds are differentiated b y two gene pairs
Classes Number of
Population 5GdO GI-65 66-70 71-74 individuals
In percentages
Obtained 26 96 17 ..._
Calculated 20.83 68.28 19.91 .97
Obtained 26 96 17 ...
Calculated 28.95 94.91 13.77 1.35
x2
= .5469In numbers
d.f. = 2 P = .80-.70 (last t w o classes on left were grouped in one)
139 139
139 139
TABLE 14
The means, standard deuiations, the variances and the number of indiuiduals in each population for the difference in days between silking and pollen shedding
-
Population X
*
S.D.PI 2.48 f 1.12
B, to P, 2.46 & 1.25
F, 2.41 2 1.13
I?, 2.55 & 1.58
B, to P, 1.54 2 1.25
p2 1.50 -C 1.06
Total variance
1.2707 1.4349 1.3450 2.5258 1.4522 1.0226
Environmental variance
1.1598 1.1628 1.1704 1.1492 1.3020 1.3081
Genetic variance
.1109 .2721
.
1 746 1.3766.
1 502 -2355Number of individuals
722 A. H. M O H A M E D TABLE 15
Condensed frequency distribution, in percentage, for the differences in days between silking and pollen shedding
Classes in percentages Kumber of Population 0- 1 B-more individuals
____
PI 9.09 90.90 33
F, 23.52 76.46 34
B, to PI 21.24 78.75 113
F, 28.29 71.71 152
B, to P2 51.03 48.97 145
P, 52.78 47.22 36
populations, P,, F,, and B, to PI, would be the same or differ within the limits of random sampling. This was found to be the case, since
x 2
value was 2.8532 which gave a P value of .30-.20 (d.f. 2 ) .xZ
tests for goodness of fit for the ratio 3: 1 in theF, population gave a P value of .50-.30. Also the
xZ
test f o r the ratio 1 : 1 in theB, to P, population gave a P value of .90-.80. All these supported the hypothesis that the difference between the two parents was governed by a major gene pair.
D I S C U S S I O N A N D C O N C L U S I O N
The development of an organ or an organism involves an organized system of interrelated and interdependent physiological processes, the end result of which is the manifestation of the phenotypic character. In this system the effects of most genes are integral parts (WRIGHT 1934). In such studies it was necessary to recognize both phenotypic and genic dominance. Phenotypic dominance was determined by studying the means of the two parents and the mean of the F,
generation. This relation could be checked by studying the mean of the backcross to the dominant parent. Genic dominance was determined from studying the means, variances and phenotypes of the different genotypes. However, it should be realized that dominance is a relative phenomenon and its manifestation differs according to the genic background of the different gene combinations (FISHER
193 1 ;
WRIGHT
1934; DOBZHANSKY and HOLZ 1943).“Fewer” days from seeding to silking and to pollen shedding showed complete phenotypic dominance over ‘ L m ~ r e ” days. The genetic variance indicated also complete genic dominance. SINGH (1949) found complete phenotypic and genic dominance f o r fewer days in the squash from seeding to opening of the first male and the first female flower. The same thing was reported by POWERS (1941) in tomatoes. It was found from these studies that silking date was determined by at least three major gene pairs by which the two inbred lines were differentiated. The number of days from seeding to pollen shedding was found to be governed by at least two major gene pairs. The difference in days between pollen shedding and silking indicated complete phenotypic and genic dominance for longer dura- tion with at least one major gene pair controlling the difference.
TIME O F MATURITY I N MAIZE 723 least two gene pairs responsible for the number of days from seeding to silking and at least three gene pairs for the number of days from seeding to pollen shed- ding. He concluded that since his observations were made on the same plants, and since only two of the genes indicated by the associations in pollen shedding studies were in the same arm as those for silking date, it appeared that not all the genes controlling pollen shedding and silking dates were the same.
Later the author, in 1956, in his studies on the effect of environment on gene segregation, using the same material used in 1954, reported that at least two major gene pairs controlled silking date and that one major gene pair controlled pollen shedding date under Alexandria, Egypt, conditions. The author concluded that the gene controlling pollen shedding date could be the same as that con- trolling silking date but the other gene which was found to be present in silking date could act as a differential one.
In the present studies, it can be stated that in the early stages of development? two major gene pairs would be responsible for pollen shedding and silking dates. However, a third gene probably interacts with the other two genes on the female side, i.e., silking date, and causes the silk appearance to be delayed more than that of pollen shedding. This conclusion can support that reported earlier by the author, i.e., the two characters are not the same but some genes are common to both. This can by no means be considered conclusive until more linkage data are available.
This finding should be of considerable importance to maize breeders who are breeding for earliness. If we consider what the author reported in 1954 and 1956, we could assume that the three genes are independent. Therefore, the breeder can combine earliness in his varieties since it is somewhat simply inherited. This earliness is essential in the northern parts of Egypt where the corn borer is abun- dant in August. Thus, earlier varieties will have a better chance to escape the damage done by this pest.
SUMMARY
1. The maize inbred line (E.G. 102) was crossed to the inbred (E.G. 205) raised by the Wnistry of Agriculture, Egypt, in its program for producing hybrid corn.
2. By using the partitioning method suggested by POWERS (1942) and POWERS
et aZ. (1950) it was possible to estimate the number of gene pairs controlling the number of days from seeding to silking and pollen shedding.
3. The number of days from seeding to silking and the number of days from seeding to pollen shedding were differentiated by three and two major gene pairs, respectively.
4. The differences in days between silking and pollen shedding was found to be governed by one major gene pair.
724 A. H. M O H A M E D
LITERATURE C I T E D
ANDERSON, E. G., 1938
BURNHAM, C. R., and J. L. CARTLEDGE, 1939
DOBZHANSKY, TH., and A. M. HOLZ, 1943
EMERSON, R. A., and E. M. EAST, 1913
FISHER, R. A., 1931
GOLDSCHMIDT, R., 1938 Physiological Genetics. McGraw-Hill Book Company, Inc. New York and London.
IBRAHIM, M. A., 1954 Association tests between chromosomal interchange in maize and resist- ance to the European corn borer. Agron. J. 46: 293-298.
MILLER, P. A., 1951 Use of chromosomal interchanges for investigating the inheritance of oil in corn kernel. Agron. J. 43 : 229-234.
MOHAMED, A. H., 1954 Association tests between chromosomal interchanges in maize and tender pericarp in sweet corn. Ph.D. Thesis, Univ. of Minnesota.
The use of chromosomal interchanges in locating the genes controlling some agronomical characters in maize. Alexandria J. Agr. Research 4: 69-84.
Studies on the nature of the interactions of the genes differentiating quantita- tive characters in a cross between Lycopersicon esculuntune and Lycopersicon pimpinellifol- ium. J. Genet. 39: 139-190.
Inheritance of quantitative characters in crosses involving two species of Lycopersicon.
J. Agr. Research 63 : 149-1 74.
The nature of the series of environmental variances and the estimation of the genetic variances and the geometric means in crosses involving species of Lycopersicon. Genetics 27 : 561-575.
Gene analysis of weight per locule in tomato hybrids. Botany Gaz. 112: 163-174. Determining scales and the use of transformations in studies on weight per locule of
Gene analysis by the partitioning method when interactions of genes are involved.
Partitioning method of genetic analysis ap-
Genetic studies of reactions to smut and firing in maize by
Inheritance of certain economic characters in the squash, Cucurbitu maxima
Physiological and evolutionary theories of dominance. Am. Naturalist 48 : Translocations in maize involving chromosome 9. Genetics 23: 307-313.
Linkage relations between smut resistance and
A re-examination of the problems of manifold effects
The inheritance of quantitative characters in maize. semisterility in maize. J. Am. Soc. Agron. 31 : 924-933.
of genes in Drosophila melanogaster. Genetics 28: 295-303.
Nebraska Univ. Agr. Exp. Sta. Research Bull. 2.
The evolution of dominance. Biol. Rev. 6: 345-368.
1956
POWERS, L., 1939
1941
1942
1950a 1950b
1951
tomato fruit. Biometrics 6: 145-163.
Botanical Gazette 113: 1-23.
plied to quantitative characters of tomato crosses. U.S. Dep. Agr. Tech. Bull. 998:
means of chromosomal translocations. J. Am. Soc. Agron. 38: 463470.
Duch. Univ. Minn. Agr. Exp. Sta. Tech. Bull. 186.
24-53.
POWERS, L., L. F. LOCKE, and J. C . GARRETT, 1950
SABOE, L. C., and H. K. HAYES, 1941
SINGH, D., 1949