Intelligence Scales, Fifth Edition. (Under the direction of Jeffery Braden).
This study examined the evidence for the response process validity of the Stanford Binet, Fifth Edition (Roid, 2003a). Students from introductory psychology classes (n = 101) were randomly assigned to one of five conditions defined by the five cognitive processes the SB5 intends to measure. Participants responded to items from the Verbal and Nonverbal Scale subtests for their condition. Participants explained how they solved the problems and rated the degree to which they used each of the cognitive processes and verbal mediation. Graduate student raters independently assigned participants’ descriptions into categories representing the cognitive process and level of verbal mediation. Results generally provide strong
by
Sandye Michelle Ouzts
A thesis submitted to the Graduate Faculty of North Carolina State University
In partial fulfillment of the Requirements for the degree of
Master of Science
Psychology
Raleigh, North Carolina 2007
APPROVED BY:
___________________________ ____________________________
Joan Michael, PhD John Nietfeld, PhD
___________________________________ Jeffery Braden, PhD
BIOGRAPHY
I was born in Greenwood, South Carolina, the daughter of Lawrence and Brenda Ouzts. I am the older sister of Jason Ouzts. I received my high school degree, graduating third in my class, from Saluda High School in Saluda, South Carolina in 1999. In 2003, I graduated Magna Cum Laude with a Bachelor of Arts and honors in Psychology from the University of South Carolina. I entered North Carolina State University for graduate study in School Psychology in the fall of 2003.
Growing up in my rural neighborhood in South Carolina, the houses were far and few between. I believe the population of cows was greater than the population of people. After graduating from high school, I attended the small campus of the University of South Carolina at Aiken with a student body population of about 3,000. Originally a Communications major, I became interested in psychology after taking Introduction to Psychology with Maureen Carrigan, who later became my advisor. My senior year, I conducted research on child maltreatment under the guidance of Keri Weed, getting my first hands on experience with research and psychological testing and also my first publication.
included co-authoring two articles in the Mental Measurements Yearbook with Jeff Braden, two NCSPA poster presentations, many conferences, a departmental research award, learning about and working with children with disabilities, a successful (and publishable) thesis, and completing my 1200 hour internship.
ACKNOWLEDGMENTS
I would like to thank my advisor, Jeff Braden, not only for the help and
encouragement along the way, but also for setting an example for myself and others. As I have known Jeff over the years, he has been a leader with integrity and compassion whose pursuit is excellence and truth. I would also like to thank my committee members, John Nietfeld and Joan Michael, for their time and feedback on my thesis.
I would like to thank Lauren, Michelle, Sena, Hailey, and Kelly for scoring responses, reviewing thesis drafts, and giving me feedback. I am also grateful to Danielle and Elizabeth for conducting the participant experiment sessions and helping to develop scoring rubrics. Thanks also to Lynne Myers of Wake County Public Schools for lending me a SB5 kit to use for my study. Thanks to a dear friend, Michelle, for listening and giving feedback during practice runs for my presentations and giving me tips on using Microsoft Word. Thanks to Athena for her friendship and encouragement over the years. I also want to give great thanks to Kevin, who has been an invaluable source of moral support and a great friend.
TABLE OF CONTENTS
List of Tables ………... vii
Chapter 1: Introduction ………... 1
Validity and Its Importance ……….. 1
Response Processes: Importance and Research ……….………….. 1
Validity of Intelligence Tests ………...……... 5
Description of the Stanford Binet, Fifth Edition ……….. 7
Purposes of the Study ……… 9
Chapter 2: Method ……….. 12
Pilot Studies ……….. 12
Main Study ……… 15
Chapter 3: Analyses and Results ……… 34
Hypothesis One ……… 34
Hypothesis Two ………... 45
Summary ……….. 51
Chapter 4: Discussion ……… 52
Limitations of the SB5 ………. 53
Limitations of Examinees ……… 54
Limitations of the Method ……… 57
Directions for Future Research ……… 59
Conclusions ……….. 62
Appendices ………. 68
Appendix A: Participant Interview Form Definitions ………. 69
Appendix B: Participant Interview Form ……… 70
Appendix C: Informed Consent Form for Research ……… 71
Appendix D: Demographics Form ………... 73
Appendix E: Method Used to Determine SB5 Items Administered ……… 74
Appendix F: Interview Protocol ……….. 76
Appendix G: IRB Approval Letter ……….. 79
Appendix H: Cognitive Process Scoring Rubric ………. 80
Appendix I: Verbal Mediation Scoring Rubric ……… 82
Appendix J: Participants’ Use of Labels in Interview Descriptions ……… 83
Appendix K: Cognitive Process Scoring Sheet ……… 85
Appendix L: Verbal Mediation Scoring Sheet ………. 92
LIST OF TABLES
Table 1.1 SB5 Subtests and Activities (Level 3, 4, and 5) According to Cognitive Process
and Level of Verbal Mediation………... 8
Table 1.2 Description of Five Processes Measured by the SB5 ……... 8
Table 2.1 Descriptive Data for Participants Sampled According to Condition …... 16
Table 2.2 SB5 Subtests Administered According to Participant Condition ... 19
Table 2.3 Number of Participants Interviewed By Each Examiner Within Each Condition ………... 20
Table 2.4 Items Scored By Each Rater ………... 25
Table 3.1 Mean Response Values for Cognitive Process Survey Items for Participants Sampled Within Each Condition ………... 35
Table 3.2 Mean Dominance Scores for Cognitive Process Survey Items for Participants Sampled Within Each Condition ………... 38
Table 3.3 Self-Reported Cognitive Process Scores for Participants Sampled Within Each Condition for Nonverbal Scale Subtests ………... 42
Table 3.4 Self-Reported Cognitive Process Scores for Participants Sampled Within Each Condition for Verbal Scale Subtests ………... 44
Table 3.5 Mean Response Values for Inner Language Survey Items for Participants Sampled Within Each Condition ………... 45
Table 3.7 Self-Reported Verbal Mediation Scores for Nonverbal and Verbal Scale
Subtests……… ………... 49
Table 3.8 Self-Reported Verbal Mediation Scores for Participants Sampled Within Each Condition for Verbal Scale Subtests ………... 50 Table 3.9 Self-Reported Verbal Mediation Scores for Participants Sampled Within Each
CHAPTER 1: INTRODUCTION
Validity and Its Importance
According to the Standards for Educational and Psychological Testing (AERA, APA, & NCME, 1999), validity is the extent to which the interpretation of test scores is supported by both evidence and theory. Test developers must provide evidence to support their claims concerning the appropriate uses and interpretation of test scores, and professionals need this information to ethically base decisions on the results of the test. According to the Standards, there are five types of evidence that may be used to support validity: (1) evidence based on test content, (2) response processes, (3) internal structure, (4) relations to other variables, and (5) consequences of testing. Evidence based on response processes consists of evidence that the examinee is actually engaging in the processes that the tasks are intended to measure, as well as evidence that the examiner is evaluating assessment data according to the processes that the tasks are intended to assess. The focus of this paper will be processes used by examinees, not the processes examiners use to interpret data.
Response Processes: Importance and Research
empirical analysis of the processes used by examinees and examiners during assessment. Therefore, evidence based on response processes is an important source of validity evidence.
According to Messick (1994, 1995), there are two possible sources of invalidity, construct underrepresentation and construct-irrelevant variance. Construct
underrepresentation occurs when the task fails to assess some important aspect of the construct it is intended to measure. Construct-irrelevant variance occurs when the task assesses an irrelevant construct or the examinee’s responses are influenced by extraneous variables that the test does not intend to measure. These sources of invalidity are particularly relevant to all cognitive tests because examinees may fail to use the cognitive processes the tests intend to measure (construct underrepresentation), or may use processes that a particular test does not intend to measure (task irrelevant variance). For example, if examinees use inner language, or verbal mediation, in comprehending, mediating, or responding to a nonverbal task, then the test scores should be considered invalid as nonverbal measures of cognitive processes. This would alter the meaning test users might assign to scores relative to the meaning they might assign if examinees did not use inner language. In sum, evidence that examinees do (or do not) use intended processes, and avoid using unintended processes, would help test users better understand the validity of any test.
Cognitive Psychology Research
processing, including eye movements, response latencies, error analysis, measurement of brain activity, and examinee interviews (Snow & Lohman, 1989). Using information collected by multiple methods, researchers are able to more accurately draw conclusions about the processes that a particular task elicits.
Eye movement and response latencies were used in one study to develop models of the mental processes involved in a mental rotation task, sentence verification task, and quantitative comparison task (Just & Carpenter, 1976). In another study (Carpenter, Just, & Shell, 1990), eye movement, response latencies, and error analysis were used to develop a model of the processes that examinees used to respond to the Raven Progressive Matrices test (Raven, 1962). Individual differences were examined to determine what processes (e.g., working memory) contributed to participants’ ability to answer items correctly on the test (Carpenter, Just, & Shell, 1990).
Campbell, & Stelmack, 1994). Reaction time and PET activity have been used to study the effects of aging on the processes involved in completing a verbal recognition memory task (Madden et al., 1999). In a recent study, reaction time and fMRI activity across different types of tasks were examined to infer which areas of the brain are involved in response selection (Schumacher & D’Esposito, 2002).
Education and Other Areas of Psychology
In other areas of research, participants are interviewed and asked to complete questionnaires about the cognitive processes they used to complete a task. A questionnaire was used in one study to analyze college students’ response strategies for answering personality test items (Gordon & Holden, 1996). College students’ cognition and use of learning strategies related to reading and understanding information from a Biology textbook have been assessed by questionnaire, written discussion, and interview discussion
(McCrindle & Christensen, 1995). Graduate students’ use of networking, a visual-spatial learning strategy, to comprehend novel text has been assessed through interviews. In addition, participants’ prior use of learning strategies (e.g., elaboration) has been assessed using a questionnaire (De Simone & Schmid, 2004).
Researchers have also interviewed school-aged children about the cognitive strategies they used during the learning process. Fourth and fifth grade students’ knowledge
structured interview (Craig & Yore, 1995). Another study assessed the cognitive strategies of seventh grade students while they constructed a model of a tower in groups. Students were videotaped during the task and later participated in an interview in which they described the process the group used to complete the task. In addition, students’ statements during the problem solving were analyzed (Welch, 1998).
Each of the methods described could provide useful information about the cognitive processes examinees use when solving test items from an intelligence test. Interviews and questionnaires are relatively easy and convenient methods that could be used to assess response processes validity. Research on the response processes in which examinees engage when taking an intelligence test would provide further insight into the specific cognitive abilities that are measured by that intelligence test. This type of information could be used to guide and refine theories of intelligence, as well as to inform the practice of intellectual assessment.
Validity of Intelligence Tests
therefore, claim to measure different cognitive processes that compose intelligence. Thus, evidence that examinees actually engage in the cognitive processes that the test claims to measure is an important component of validity evidence for intelligence tests (Braden & Niebling, 2005).
Tasks used to assess intelligence vary with respect to the amount of language they require examinees to use when responding to items. In comparison to verbal (or language-loaded) tasks, nonverbal (or language-reduced) tasks reduce the amount of language involved in test administration, item content, and examinee responses. These tests are often used with examinees who are hearing impaired, have language deficits, or who have not been exposed to the dominant language of their culture of residence. Nonverbal tests reduce the likelihood that examinees will use language to understand, mediate, or produce their responses.
Although nonverbal tests purport to measure intelligence without the use of language processes, it may be that nonverbal tests do, in fact, elicit language processes in examinees (Braden & Anathasiou, 2005).
There are two distinct schools of thought regarding the cognitive processes
nonverbal tests elicit. On the one hand, some intelligence tests are based on the assumption that nonverbal tasks measure the same cognitive processes as verbal, or verbally-loaded, tasks (i.e., intelligence). On the other hand, some tests are developed based on the assumption that nonverbal intelligence tests measure a different (i.e., nonverbal) kind of intelligence. Each of these assumptions lead to somewhat different interpretations of test scores (e.g., does a score represent an ability that can be measured either verbally or
Although many contemporary tests have been developed to reflect the hierarchical, CHC model of intelligence, only one has sought to measure CHC abilities using verbal and nonverbal tests: the Stanford Binet Fifth Edition (SB5; Roid, 2003a). The SB5 purports to measure five different cognitive processes: (1) Fluid Reasoning, (2) Quantitative Reasoning, (3) Visual Spatial Processing, (4) Knowledge, and (5) Working Memory, with verbal and nonverbal subtests to measure each process. For example, the nonverbal subtest for Working Memory requires the examinee to tap blocks in the same order as the examiner, whereas the verbal subtest requires the examinee to repeat the last words of sentences in order (Roid, 2003b; 2003c). In contrast, most other tests confound language loading with the abilities measured (e.g., Knowledge is measured exclusively with verbal tests, whereas Fluid
Reasoning is measured primarily with language-reduced tests). Confounding language with ability can restrict the range of cognitive abilities (i.e., nonverbal abilities) a test can measure if it is exclusively verbal or nonverbal. The question of whether nonverbal tests elicit similar processes as verbal tests of intelligence, or whether nonverbal tests elicit processes other than those elicited by verbal tests, is not directly addressed by relevant evidence for most current cognitive test batteries (Braden & Anathasiou, 2005).
Description of the Stanford Binet, Fifth Edition
Table 1.1
SB5 Subtests and Activities (Level 3, 4, and 5) According to Cognitive Process and Level of Verbal Mediation
Nonverbal Subtests Verbal Subtests Fluid Reasoning Object Series/Matrices Early Reasoning
Verbal Absurdities Verbal Analogies Knowledge Procedural Knowledge,
Picture Absurdities
Vocabulary
Quantitative Reasoning Quantitative Reasoning Quantitative Reasoning Visual-Spatial Processing Form Patterns Position and Direction Working Memory Block Span Memory for Sentences
Last Word
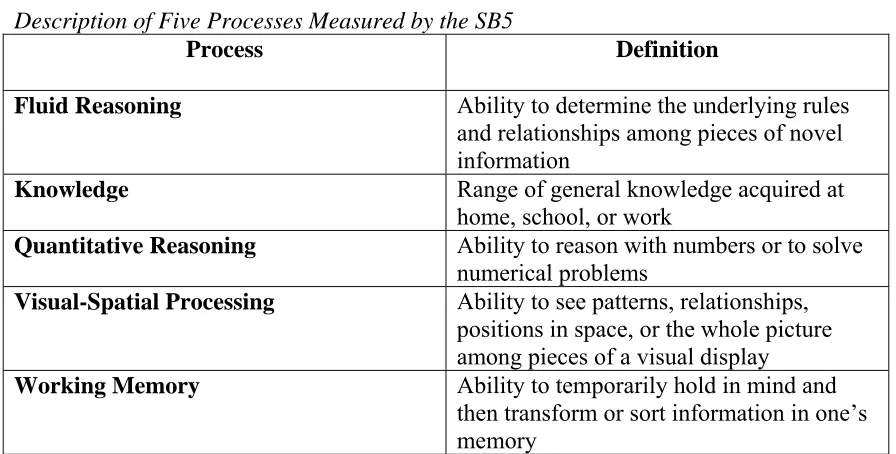
Table1.2
Description of Five Processes Measured by the SB5
Process Definition
Fluid Reasoning Ability to determine the underlying rules and relationships among pieces of novel information
Knowledge Range of general knowledge acquired at
home, school, or work
Quantitative Reasoning Ability to reason with numbers or to solve numerical problems
Visual-Spatial Processing Ability to see patterns, relationships, positions in space, or the whole picture among pieces of a visual display Working Memory Ability to temporarily hold in mind and
to measure. These abilities are derived from the Cattell-Horn-Carroll model of intelligence (Roid, 2003b).
The SB5 technical manual (Roid, 2003c; see Chapter 1 and Chapter 2) and
examiner’s manual (Roid, 2003b; see Chapter 2 and 5) present sufficient evidence for three of the five types of evidence discussed in Chapter 1 of the Standards: (1) evidence based on test content, (2) relations to other variables, and (3) internal structure. However, there is little if any evidence relevant to understanding the other two types of validity: viz., test
consequences, and response processes (see Braden & Niebling, 2005). In the manuals, the author provides information about how scores from the SB5 change across the developmental lifespan, providing indirect evidence that the processes underlying the scores are different (Braden & Niebling, 2005). However, more direct evidence of response processes is needed to understand to what degree SB5 subtests represent intended constructs, and avoid
representing unintended constructs. The current study will examine response processes evidence by asking test-takers to explain what processes they use when solving test items. This approach shifts the unit of analysis away from indirect methods of identifying processes (e.g., factor analyses, developmental differences in scores) to more direct reports from the individual test-taker.
Purposes of the Study
discuss how they solved the items. Second, participants will be asked to identify the degree to which they used each of the five cognitive processes the SB5 intends to sample, as well as the degree to which they used verbal mediation, when responding to test items. The results of this study will help to illuminate the degree to which post-assessment interviews may elicit evidence of response processes when applied to cognitive tests, and to supply evidence of response processes examinees use in responding to SB5 subtests and items. The hypotheses of the study, along with the predictions for each hypothesis, are below:
1. Examinees will report using the intended cognitive process (e.g., Working Memory) more than they report using the other four cognitive processes that the subtest is not intended to measure.
a) Prediction one. The mean rating for the degree to which examinees use the intended cognitive process will be higher than the mean rating of the other four cognitive processes that the subtest is not intended to measure.
b) Prediction two. Participants’ answers to open-ended questions about how they solved the problems on verbal subtests will reflect the cognitive process that the subtest is intended to measure more than the processes the subtest is not intended to measure.
2. Examinees will report using primarily verbal mediation in response to verbal subtests and avoid using verbal mediation in response to nonverbal subtests.
a) Prediction one. The mean rating for the degree to which examinees use verbal mediation will be higher for verbal subtests than the mean rating for nonverbal subtests.
b) Prediction two. Participants’ answers to open-ended questions about how they solved problems on verbal subtests will reflect the level of verbal mediation (i.e., verbal or nonverbal) that the subtest is intended to measure.
CHAPTER 2: METHOD Pilot Studies
Pilot Study One
A pilot study was conducted with a sample of three college students (two females, one male; age range 23 to 25 years; level of education range one year of college to one year of graduate study). Participants were administered Level 3 and Level 5 items from ten subtests: verbal and nonverbal subtests for each of the five of the processes. I asked
participants to explain how they solved the items using their own words (i.e., “How did you solve these problems?”). One participant rated the degree to which he used the five processes and inner language for both verbal and nonverbal subtests for three of the five processes.
Pilot Study Two
A second pilot study was conducted with a sample of four undergraduate students and one graduate student (three females, two males). The purpose of the pilot study was to: (a) provide information about the types of follow-up questions that would elicit the most amount of information, (b) provide information about the best way to phrase definitions of the five processes and inner language, so that participants would understand the task, and (c) explore whether procedures elicited unintended consequences (e.g., Do participants “make up” answers to interview questions or survey items?).
Participants answered selected items from Levels 3, 4, and 5 from the Nonverbal and Verbal Scale subtest for one of the five cognitive process domains (the same procedure used in the actual study). Each participant was administered subtests from a different cognitive process domain (e.g., only one person was administered the two subtests for Working Memory). Before answering test items, participants were given a list that defines the five processes and inner language (see Appendix A) and asked to read the list to cue them to consider which processes they might use in solving the tasks. After each subtest, I asked participants to explain how they solved the items using their own words (i.e., “How did you solve the last nine items you answered?”). Follow-up questions were asked to elicit
I asked participants to discuss their thoughts and reactions to the testing and interview including whether they felt the interview questions adequately elicited information about how they solved the problems. Concerning the survey, I asked participants whether they felt: (a) they understood the definitions on the rating scales, (b) their ratings on the survey were accurate, (c) they based their ratings on all nine of the items, and (d) whether easier items elicited different processes than more difficult items. Participants were also invited to discuss any other suggestions they had for improving the procedure and any other comments they had.
When asked whether they felt their ratings reflected all 9 test items, three participants felt that their use of the processes depended on the level of difficulty of the items. For
example, when responding to Knowledge items, one participant reported using primarily Knowledge for easy items and primarily Visual Spatial Processing for more difficult items. When given Visual Spatial Processing items, a participant reported that she used Visual Spatial Processing for both easy and difficult items, but that she used Visual Spatial
In some cases, I made slight changes to the testing materials and interview procedure based on participant feedback. I revised the definitions for Fluid Reasoning, Knowledge, Working Memory, and Inner language to make the definitions clearer and easier to apply to the testing situation. In addition, I changed the procedure to allow participants more time to complete items from the nonverbal Visual Spatial Processing subtest (Form Patterns) to facilitate rapport with the participants.
Main Study
Participants
Table 2.1
Descriptive Data for Participants Sampled According to Condition
Condition FR KN QR VSP WM All Conditions
Demographic Characteristics
Age M 18.60 22.14 20.90 21.10 19.30 20.43 (SD) (1.39) (7.70) (6.81) (8.31) (2.18) (6.06)
Female % 11 14 11 12 13 60
(n) (11) (14) (11) (12) (13) (61)
Male 9 7 9 8 7 40
(9) (7) (9) (8) (7) (40)
Caucasian 14 16 14 16 16 75
(14) (16) (14) (16) (16) (76)
Asian 3 2 4 1 1 11
(3) (2) (4) (1) (1) (11)
African 1 2 2 2 2 9
American (1) (2) (2) (2) (2) (9)
Hispanic 1 0 0 0 1 2
(1) (0) (0) (0) (1) (2)
American Indian/ 1 0 0 0 0 1
Alaskan Native (1) (0) (0) (0) (0) (1)
Native Hawaiian/ 0 0 0 0 0 0
Other Pacific Islander(0) (0) (0) (0) (0) (0)
aOther 0 1 0 1 0 2
Table 2.1 (continued)
Condition FR KN QR VSP WM All Conditions
Demographic Characteristics
Level of Education
Freshman 12 10 11 12 13 57
(12) (10) (11) (12) (13) (58)
Sophomore 4 3 3 2 3 15
(4) (3) (3) (2) (3) (15)
Junior 2 3 4 3 0 12
(2) (3) (4) (3) (0) (12)
Senior 1 4 1 1 3 10
(1) (4) (1) (1) (3) (10)
Graduate 0 1 0 0 0 1
(0) (1) (0) (0) (0) (1)
bOther 1 0 1 2 1 5
(1) (0) (1) (2) (1) (5)
Disability Status
cDisability 0 1 0 1 0 2
(0) (1) (0) (1) (0) (2)
No Disability 20 20 20 19 20 98
(20) (20) (20) (19) (20) (99)
Total N 20 21 20 20 20 101
Note. FR = Fluid Reasoning, KN = Knowledge, QR = Quantitative Reasoning, VSP = Visual Spatial Processing, and WM = Working Memory. Percentages have been rounded; therefore, the sum of subgroup percentages may not equal the total percentage for All Conditions.
aParticipants in this category reported their ethnicity as: “multiracial” (KN) and “American Indian/Caucasian” (VSP).
bParticipants in this category reported their level of education as: senior in high school (FR), Lifelong Education student (QR),
Post-Baccalaureate Studies student and Lifelong Education student (VSP), and Post-Post-Baccalaureate Studies student (WM).
cParticipants in this category reported their disability status as a mild form of Charcot-Marie-Tooth disease (KN), and both partial deafness
Study Design
This study used an experimental design in which participants were randomly assigned to one of five conditions defined by the five cognitive processes the SB5 intends to measure (i.e., Fluid Reasoning, Knowledge, Quantitative Reasoning, Visual Spatial Processing, and Working Memory). The study involved a repeated measures design because participants answered selected items from both the Verbal and Nonverbal Scale subtests for their
condition (see Table 2.2). Subtests were administered in a counterbalanced order within each condition to avoid order effects. However, due to error, the number of participants was exactly counterbalanced across examiners in only three of the five conditions. Participants answered 9 items from the Nonverbal Scale subtest and 9 items from the Verbal Scale subtest for their condition, for a total of 18 items. The dependent variables were verbal self-report descriptions and survey ratings of the degree to which the participant used the five cognitive processes the SB5 intends to measure, as well as the degree to which the participant used verbal mediation, when solving SB5 items.
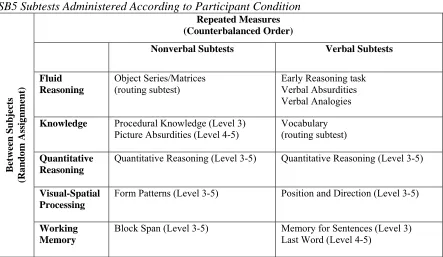
Table 2.2
SB5 Subtests Administered According to Participant Condition
Between Subjects (R and o m As si gnmen t) Repeated Measures (Counterbalanced Order)
Nonverbal Subtests Verbal Subtests
Fluid Reasoning
Object Series/Matrices
(routing subtest) Early Reasoning task Verbal Absurdities Verbal Analogies
Knowledge Procedural Knowledge (Level 3)
Picture Absurdities (Level 4-5) Vocabulary (routing subtest)
Quantitative Reasoning
Quantitative Reasoning (Level 3-5)
Quantitative Reasoning (Level 3-5)
Visual-Spatial Processing
Form Patterns (Level 3-5) Position and Direction (Level 3-5)
Working Memory
Block Span (Level 3-5) Memory for Sentences (Level 3) Last Word (Level 4-5)
*Note. The SB5 routing subtests include only one set of items, and thus, do not include levels in their design.
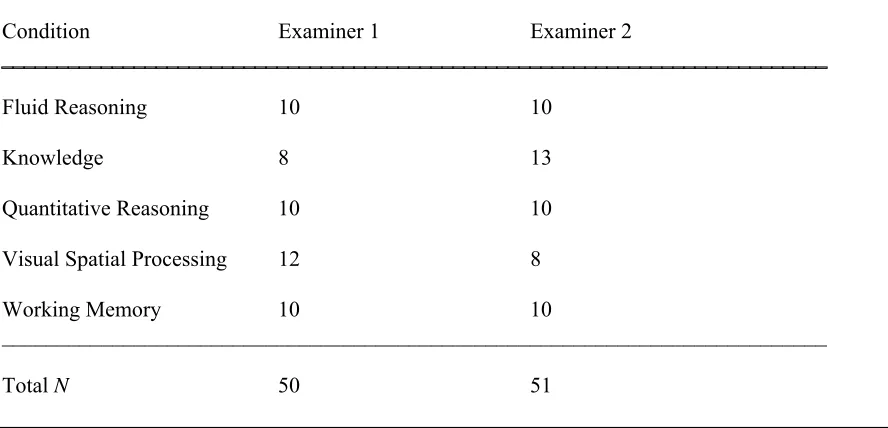
interviewed 8 and 13 participants, respectively. For the Visual Spatial Processing condition, each assistant interviewed 12 and 8 participants, respectively. The total number of
participants interviewed by each research assistant was 50 and 51 participants, respectively (see Table 2.3). To examine whether there was an association between examiner and number of participants interviewed in each condition, a Pearson chi square was conducted. There was no difference between the number of participants interviewed in each condition by the two examiners, χ2 (4, N = 101) = 1.98, p = .74.
Procedures
Table 2.3
Number of Participants Interviewed by Each Examiner Within Each Condition
Condition Examiner 1 Examiner 2
Fluid Reasoning 10 10
Knowledge 8 13
Quantitative Reasoning 10 10
Visual Spatial Processing 12 8
Working Memory 10 10
___________________________________________________________________________
Total N 50 51
SB5. The research assistants were trained in test administration and interview procedures for all five of the cognitive process areas. Each research assistant completed test administration and interview procedures for participants in all five conditions.
As part of their training, assistants critiqued themselves using self-review videos, and I also reviewed the videos and provided feedback. Assistants were provided feedback
Participants were randomly assigned to one of the five conditions defined by the five cognitive processes the SB5 intends to measure (i.e., Fluid Reasoning, Knowledge,
Quantitative Reasoning, Visual Spatial Processing, and Working Memory). Research assistants administered selected items from the SB5 and then interviewed examinees about the processes they used to solve the problems. Prior to beginning the study, participants reviewed and signed the Informed Consent Form (see Appendix C). Participants completed a demographic survey including name, age, gender, race/ethnicity, year in college, and
disability status (see Appendix D). Participants were given a list that defines the five processes (i.e., Fluid Reasoning, Knowledge, Quantitative Reasoning, Visual-Spatial
Processing, and Working Memory) and use of inner language (see Appendix A) and asked to read the list to cue them to consider which processes they might use in solving the tasks. They were encouraged to ask any questions they had about the definitions.
Participants responded to 9 items from each of the two subtests (Verbal and
general estimate of the items corresponding to levels three, four, and five. Due to the fact that the highest items corresponding to each level are typically less difficult than the items to which they would route (A.D. Carson, personal communication, November 8, 2005), the range of items for each level was shifted up three items. After items for the three levels of each subtest were identified, three items from each level were selected to represent low, medium, and high levels of difficulty (see Appendix E for further description).
Originally, I proposed that if participants incorrectly answered all three items in the third level, they would be given additional items from level two. Further, I proposed that if participants incorrectly answered all three items in level three or four (or level two if administered), then questions from the next highest level would not be administered. However, none of the participants were administered items from level two, and none of the participants answered all three items in the third or fourth levels incorrectly, so that all participants were administered items from levels three, four, and five. For items that had a time limit (according to standardized administration procedures), participants were given extra time as long as they were actively engaged in solving the problem.
After each subtest (i.e., after the 9 items were administered for one of the two subtests), participants explained in their own words how they solved the problems and then rated the degree to which they used each process (see Interview Protocol in Appendix F). First, participants explained how they solved the problems in their own words. Before asking participants to explain how they solved problems, research assistants reviewed the items by showing participants the test pages and/or stimuli (e.g., blocks), as well as verbally
participants were asked, “How did you solve all of the items you just answered?” The research assistant ensured that the participant’s answer included at least five sentences in response to the question before moving on to the next subtest. Research assistants asked specific follow up questions (i.e., “What were you thinking while you were solving the problems?,” “Could you give me more detail?,” and “Did you use a certain strategy help you to solve the problems?”) to elicit additional information, as well as to clarify the meaning of responses that were unclear. If the participant did not provide at least five sentences in response to the follow-up questions, then the participant was asked to talk about how they solved a specific problem to elicit more detail from the participant. The assistant restated the participant’s answer to validate the participant’s answer and to elicit additional information before moving on to the next subtest. The participant’s answers to all of the questions were recorded verbatim.
Second, participants filled out a survey asking them to rate the degree to which they used the five cognitive processes, as well as the degree to which they used “inner language” (language as a mediator of psychological processes), using a Likert-type rating scale (see the following Measures section). The total time period for the testing and interview ranged from approximately 20 to 40 minutes, depending on the participant’s speed of responses during the testing and interview, as well as the type of subtest that was administered (i.e., the condition to which the participant was assigned).
testing and interview data. Each participant's demographic survey and informed consent form, which included the participant’s identification number as well as personal identifying information (i.e., name, gender, age, race/ethnicity, year in college, and disability status), was kept confidential and stored in a file cabinet separate from interview and testing data. See Appendix G for the IRB approval letter.
Measures
Participants reported the processes they used to answer the SB5 items via verbal self-report and structured survey. The following is a description of these measures, as well as the methods by which participants’ responses were scored.
Verbal Self-Report
Description. Participants were asked to explain how they solved the SB5 items in their own words. After administering the 9 test items for one subtest, the research assistants reviewed the test items to cue participants’ memory by showing them the item content (e.g., stimulus page) and summarizing the items (e.g., “I asked you to tell me what a ‘dog’
means”). Then, participants provided at least five sentences to answer the question, “How did you solve all of the items you just answered?” Participants’ answers to the question were recorded verbatim. Each participant provided two open-ended comments; one comment for the Verbal subtest and one comment of the Nonverbal subtest.
Scoring. Participants’ answers to the question, “How did you solve all of the items you just answered?” (N = 202) were printed separately onto half sheets of paper. Three upper-level psychology graduate students scored the answers by assigning them to
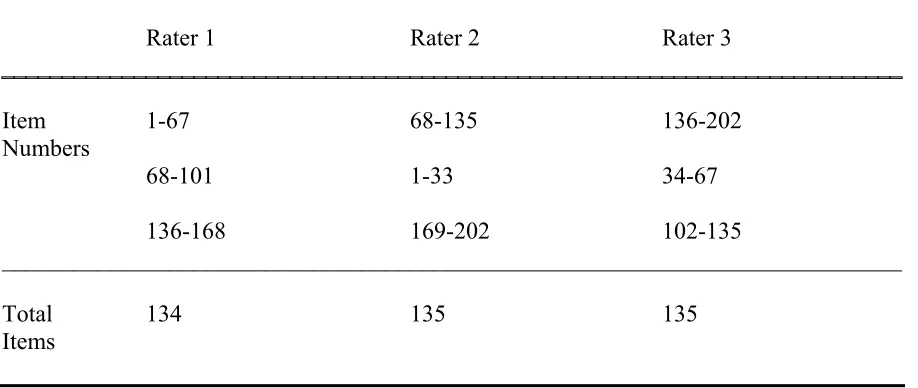
was originally proposed that each rater would score all 202 participant answers (i.e., 101 Nonverbal scale descriptions and 101 Verbal scale descriptions). However, the scoring procedure was changed due to the high frequency (96 of 202 self-reports) with which participants labeled their processes (e.g., reported using “fluid reasoning” when describing their response processes). If the participant used labels, the answer was scored twice (i.e., the version with labels and the version without labels; see description below). Due to this change in the scoring procedure, each participant’s answer was scored by two raters instead of three raters. Each of the three raters was assigned one-third of the 202 items to score (Rater 1, n = 67; Rater 2, n = 68; Rater 3, n = 67), and also scored half of the items assigned to each of the other two raters (Rater 1, n = 67; Rater 2, n = 67; Rater 3, n = 68). Thus, each rater scored a total of 134 (Rater 1) or 135 (Rater 2, Rater 3) items (see Table 2.4).
Table 2.4
Items Scored by Each Rater
Rater 1 Rater 2 Rater 3
Item 1-67 68-135 136-202
Numbers
68-101 1-33 34-67
136-168 169-202 102-135
___________________________________________________________________________
Total 134 135 135
Items
five cognitive processes and a Verbal Mediation Scoring Rubric for the level of verbal mediation (see Appendices H and I). The two undergraduate research assistants and I developed the scoring rubrics. Using the definitions provided to the participants, as well as information provided in the SB5 examiner’s and technical manuals (Roid, 2003b; 2003c), the team sorted 20 random participant responses into each of the five cognitive process
categories and 20 random participant responses into the nonverbal and verbal categories. After the sorting, the team collaborated to draft the two scoring rubrics by developing examples to serve as guidelines for how to assign responses to categories. The Cognitive Process Scoring Rubric also provided concise definitions of the five cognitive processes, and the Verbal Mediation Scoring Rubric stated that Verbal subtests should require inner
language, but that Nonverbal subtests should require little or no inner language (based on information provided in the SB5 examiner’s and technical manuals). The scoring rubrics provided the three graduate student raters with objective criteria to guide them during the sorting, and were included to increase the reliability with which the raters assigned responses to categories.
Three graduate student raters independently assigned participants’ responses to
Raters assigned cognitive process and verbal mediation scores using two different procedures. Each of these is described below.
1. Cognitive process scoring procedure. Subsequent to my proposal, I made the decision to remove the labels from participant self-report descriptions. A label was defined as using one or more of the following terms: “fluid reasoning,” “knowledge,” “quantitative reasoning” (or “quantitative”), “visual spatial processing” (or “visual spatial”), and “working memory.” The labels were removed in case, due to limited background knowledge in
cognitive processes, participants incorrectly labeled the process they used. In other words, I removed the labels in case there was a discrepancy between the processes the participant described in their own words, and the processes the participant actually labeled in their statement. For example, a participant may state using “knowledge,” but then actually describe using a process more likely to be interpreted as a different cognitive process.
With this procedure, the number of times the participant’s answer was scored
depended on whether the participant used labels when describing their response processes. If the participant did not use labels, then the raters scored the participant’s answer only once. If the participant labeled one or more cognitive process(es), and also described how the labeled process was used, then raters scored two different versions of the participant’s answer (one version with labels and one version without labels). The raters first scored a version of the description in which the labels were removed and replaced with blanks (e.g., “I used
addition and subtraction.”). In the few cases where the participant failed to describe how the labeled process was used (i.e., the participant only made a statement that a certain process was used, such as “I used quantitative reasoning”), the phrase or sentence referencing the label was completely removed from the participant’s answer and was not shown to the raters.
The raters were asked to assign each self-report description to one of six cognitive process categories (i.e., “Fluid Reasoning,” “Quantitative Reasoning,” “Working Memory,” “Knowledge,” “Visual Spatial Processing,” or “Other”). The raters used the following process to score the answers: If the participant used one or more of the five processes, first indicate each process that was used, and second indicate the primary process if it could be determined from the participant’s response. If the participant did not use any of the five processes, or used processes that were ambiguous or unclear, then the answer would be scored as “Other.”
For the primary cognitive process, scores of 1, 2, 3, 4, and 5, respectively, were assigned to the cognitive categories of Fluid Reasoning, Knowledge, Quantitative Reasoning,
Nonverbal subtests, 44.5 % (45) of the 101 participants gave one or more cognitive process labels. On the Verbal subtests, 50.49% (51) of the 101 participants gave one or more labels (see Appendix J for further description). Note: Only the score for the primary cognitive process was used in statistical analyses. For self-report descriptions with labels (n=96), in the 5 cases where there was a discrepancy between the primary score for the two versions (i.e., with labels and without labels), the score for the version without labels was included in the analyses. See Appendix K for the Cognitive Process Scoring Sheet.
2. Level of verbal mediation scoring procedure. After rating each self-report description according to cognitive process, the pieces of paper with participants’ answers were shuffled to randomize the order, and the raters were asked to reassign each participant comment to one of three categories representing the level of verbal mediation (“Verbal,” “Nonverbal,” or “Other”). The phrase “inner language” was not removed for scoring purposes because the definition of this term is easily understandable even with limited background knowledge in cognitive processes and because of the low frequency with which participants used this label. Of the 101 participants, 5 participants used the label “inner language” for the Nonverbal subtests, and 18 participants used the label on the Verbal
subtests (see Appendix J for further description). Each response received one score; scores of 1 and 2, respectively, were assigned to the verbal mediation categories of Nonverbal and
Verbal (no responses were scored as “Other”). See Appendix L for the Verbal Mediation Scoring Sheet.
was used to calculate inter-rater agreement. For responses with labels (n=96), in the 5 cases where there was a discrepancy between the primary score for the two versions (i.e., with labels and without labels), the score for the version without labels was included in the analysis. The kappa coefficient for the graduate student raters’ assignment of responses to categories (prior to adjudication by a third party) was k = .94. This suggests that graduate student raters agreed when assigning responses to categories. For level of verbal mediation scores, each response received one score (either verbal or nonverbal). The kappa coefficient for the graduate student raters’ assignment of responses to level of verbal mediation
categories (prior to adjudication by a third party) was k = .89. This suggests that raters agreed when assigning responses to categories.
It was originally proposed that the percentage of responses for which the raters
assigned the same primary process score independently would be calculated. These data were collected for 135 of the responses, but were not collected for the remaining 67 responses. Thus, the percentage was not calculated because of the missing information.
Survey
Description. Participants rated the degree to which they used specific processes to solve the test items using a Likert-type scale (0-not at all, 1-a bit, 2-somewhat, 3-a lot, and 4-exclusively). Specifically, participants were asked to rate the degree to which they used each of the five cognitive processes, as well as “inner language,” or language as a mediator of psychological processes (see Appendix B for the rating scale).
process, and for the degree to which participants used “inner language” in developing their responses.
Statistical Analyses
Subsequent to proposing the thesis, I revised the method for evaluating some of the predictions due to the nature of the data and the statistical program (SPSS 14.0) used to run the statistical analyses. The original and revised analyses, as well as the rationale for why these changes were made, are presented below.
For Prediction One, the original analyses proposed were repeated measures
indicate no preference for the intended process (i.e., random use), and a negative dominance score (i.e., less than 0) would indicate the participant reported using other processes more than the intended process. The dominance scores were used to conduct one-sample t-tests and one-way ANOVAs with post-hoc t-tests with Bonferroni error correction.
The dominance scores allowed me to simplify the analyses so that I could easily test my hypotheses, although this method resulted in loss of data. For three of the subtests, the mean survey score for one or more unintended processes is higher than the mean score for the intended process, although the mean dominance score is positive. Whereas the dominance scores do not test the differences between the mean survey scores for each of the processes, they are a useful way to test the study’s hypotheses (i.e., that participants will report using intended processes to a greater degree than unintended processes) without increasing the alpha error rate that would be generated by multiple (n = 32) t-tests or the 50 (5 x 5x 2) post-hoc tests generated by a repeated measures MANOVA.
For Prediction Four, a repeated measures MANOVA was originally proposed, followed by post-hoc ANOVAs. MANOVA results and effect sizes were sufficient to test these analyses. Effect sizes were calculated for the MANOVA results, as proposed, and additional effect sizes were calculated for each condition to examine the magnitude of the difference between the mean survey scores for the Verbal Scale and Nonverbal Scale
subtests. Mean differences for the survey item scores for each condition were divided by the pooled SD of the score distribution to create effect sizes.
Nonverbal Scale subtest, and then for the Verbal Scale subtests, was proposed. However, this analysis would include two scores from the same participant and, thus, would violate the assumption for chi-square analyses that all observations are independent. Thus, the analyses included a one-sample chi-square test of single proportions for the Nonverbal Scale subtest, and then for the Verbal Scale subtests. The analyses and results for these predictions are discussed in Chapter 3.
Further, it was originally proposed that eta squared (η2) would be calculated for all
significant MANOVAs. Due to limitations of the statistical software (SPSS 14.0), eta
squared could not be calculated. Instead, partial eta squared (ηp2) values provided by SPSS
were provided. However, there is a lack of consensus about the interpretation of these values, and readers should use caution when interpreting them. The partial eta squared values
CHAPTER 3: ANALYSES AND RESULTS
In this chapter, the major hypotheses are evaluated by testing the predictions associated with each hypothesis. The chapter is organized according to the hypotheses proposed.
Hypothesis One: Examinees will report using the intended cognitive process more than they
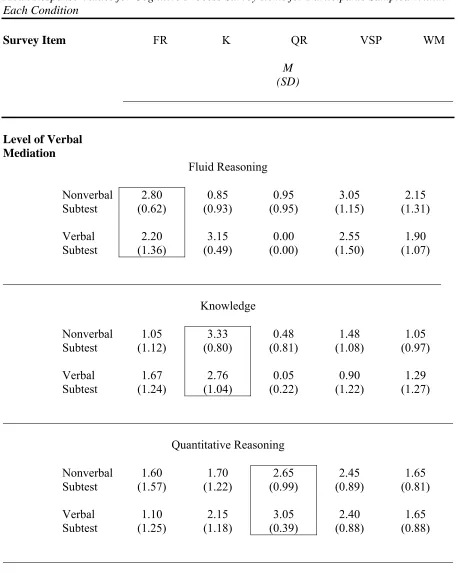
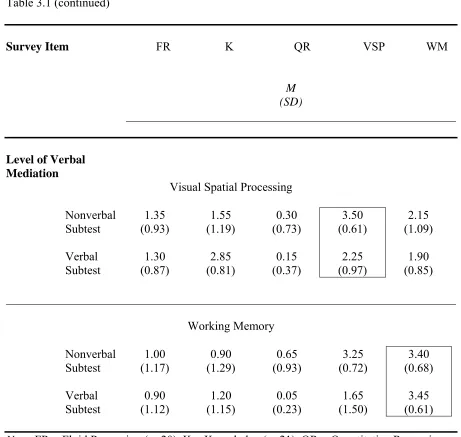
report using the other four cognitive processes that the subtest is not intended to measure. This hypothesis was tested using t-tests and ANOVAs (Prediction One) and chi square analyses (Predictions Two and Three). Descriptive results are presented first, and then results relevant to each prediction follow. Participants’ mean survey scores on the five survey items, according to the condition to which they were assigned, are presented in Table 3.1. Values in boxes represent the mean survey ratings for the intended cognitive process.
Prediction one. The mean rating for the degree to which examinees use the intended
cognitive process will be higher than the mean rating of the other four cognitive processes
that the subtest is not intended to measure. Evidence to support this prediction would manifest in the form of a statistically significant omnibus one-sample t-test using the dominance scores for all participants (n = 101) for the Verbal Scale subtests, as well as for the Nonverbal Scale subtests, at alpha = .05, assuming a directional (i.e., one-tailed) test. If significant, one-sample t-tests using dominance scores for each of the five conditions
(between- subjects) for Verbal Scale subtests, and then for Nonverbal Scale subtests, will be conducted at alpha = .01, one-tailed (to reduce Type I error for multiple dependent
Table 3.1
Mean Response Values for Cognitive Process Survey Items for Participants Sampled Within Each Condition
Survey Item FR K QR VSP WM
M (SD)
_______________________________________________________
Level of Verbal Mediation
Fluid Reasoning
Nonverbal 2.80 0.85 0.95 3.05 2.15
Subtest (0.62) (0.93) (0.95) (1.15) (1.31) Verbal 2.20 3.15 0.00 2.55 1.90 Subtest (1.36) (0.49) (0.00) (1.50) (1.07)
_________________________________________________________________________ Knowledge
Nonverbal 1.05 3.33 0.48 1.48 1.05
Subtest (1.12) (0.80) (0.81) (1.08) (0.97) Verbal 1.67 2.76 0.05 0.90 1.29 Subtest (1.24) (1.04) (0.22) (1.22) (1.27)
___________________________________________________________________________ Quantitative Reasoning
Nonverbal 1.60 1.70 2.65 2.45 1.65
Subtest (1.57) (1.22) (0.99) (0.89) (0.81) Verbal 1.10 2.15 3.05 2.40 1.65 Subtest (1.25) (1.18) (0.39) (0.88) (0.88)
Table 3.1 (continued)
Survey Item FR K QR VSP WM
M (SD)
_______________________________________________________
Level of Verbal Mediation
Visual Spatial Processing
Nonverbal 1.35 1.55 0.30 3.50 2.15
Subtest (0.93) (1.19) (0.73) (0.61) (1.09) Verbal 1.30 2.85 0.15 2.25 1.90 Subtest (0.87) (0.81) (0.37) (0.97) (0.85)
___________________________________________________________________________ Working Memory
Nonverbal 1.00 0.90 0.65 3.25 3.40
Subtest (1.17) (1.29) (0.93) (0.72) (0.68) Verbal 0.90 1.20 0.05 1.65 3.45 Subtest (1.12) (1.15) (0.23) (1.50) (0.61)
effect sizes. Large (ES > 0.80) effect sizes will be considered strong evidence for the prediction, medium (ES > 0.50) effect sizes will be considered moderate evidence for the prediction, and small (ES > 0.20) effect sizes will be considered weak evidence for the prediction.
Next, one-way ANOVAs using the dominance scores for all participants for the Verbal Scale subtests, and then for the Nonverbal Scale subtests, were conducted. When the main effect for condition (between- subjects) was significant, partial eta squared (ηp2) values
were calculated, and post-hoc t-tests with Bonferroni error correction were conducted to identify in which conditions participants were more or less likely to report using the intended process to respond to items. Strong evidence that participants’ tendency to report using the intended process varies according to the condition (i.e., the cognitive process intended to be
measured by the subtest) would be indicated by a large (ηp2 > 0.26) effect size, moderate
evidence would be indicated by a medium (ηp2 > 0.13) effect size, and weak evidence would
be indicated by a small (ηp2 > 0.02) effect size. Note: Partial eta squared (ηp2) values were
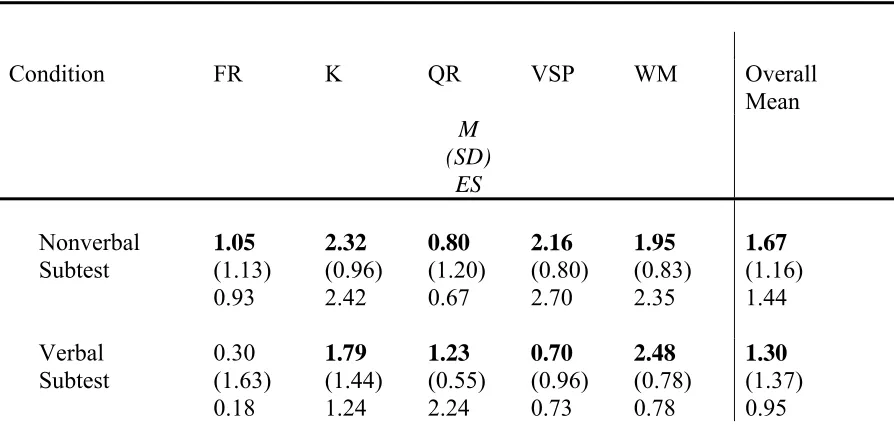
interpreted based on descriptors for Cohen’s (1988) multiple regression coefficient (R2). Caution should be used when interpreting these values as the proportion of explained variance exactly (Pierce, Block, & Aguinas, 2004). Table 3.2 presents the mean dominance score for each condition for the Nonverbal and Verbal Scale subtests separately. Bold values indicate the value is significantly greater than 0 (i.e., supportive of Prediction One).
Table 3.2
Mean Dominance Scores for Cognitive Process Survey Items for Participants Sampled Within Each Condition
Condition FR K QR VSP WM Overall
Mean M (SD) ES Nonverbal Subtest 1.05 (1.13) 0.93 2.32 (0.96) 2.42 0.80 (1.20) 0.67 2.16 (0.80) 2.70 1.95 (0.83) 2.35 1.67 (1.16) 1.44 Verbal
Subtest 0.30 (1.63) 0.18 1.79 (1.44) 1.24 1.23 (0.55) 2.24 0.70 (0.96) 0.73 2.48 (0.78) 0.78 1.30 (1.37) 0.95
Note. FR = Fluid Reasoning (n=20), K = Knowledge (n=21), QR = Quantitative Reasoning (n=20), VSP = Visual Spatial Processing (n=20), and WM = Working Memory (n=20). Results are based on one-sample t-tests. Positive values indicate the intended process was rated higher than the unintended processes. Values in bold are significantly greater than 0 (p < .01).
< .0001 (one-tailed). The mean dominance score was positive (M = 1.30, SD = 1.37) and large (ES = 0.95) indicating that participants reported using the intended cognitive process more than unintended processes. For the Nonverbal Scale subtests, the mean dominance score was significantly greater than 0, t(100) = 14.47, p < .0001 (one-tailed). The mean dominance score was positive (M = 1.67, SD = 1.16) and large (ES = 1.44), again indicating that participants reported using the intended cognitive process more than unintended
One-sample t- tests using dominance scores for each of the five conditions were conducted for Nonverbal Scale subtests, and then for the Verbal Scale subtests. Results support Prediction One for all subtests except the Fluid Reasoning Verbal Scale subtest. For 9 of the 10 subtests, the mean dominance score was greater than 0, indicating that
participants had a tendency to report using the intended cognitive process more than unintended cognitive processes for those subtests. There was a large effect size (i.e., ES > 0.80) for seven of the subtests and a medium effect size (i.e., ES > 0.50) for two of the subtests (Quantitative Reasoning Nonverbal Scale and Visual Spatial Processing Verbal Scale subtests). However, for the Fluid Reasoning Verbal Scale subtest, participants did not indicate a clear preference for the intended cognitive process over the other four cognitive processes (ES = 0.18).
Next, one-way ANOVAs were conducted using dominance scores for the Verbal Scale subtests, and then for the Nonverbal Scale subtests. Post-hoc comparisons with Bonferroni error correction were also conducted. For the Verbal Scale subtests, there was a significant main effect for condition, F(4, 96) = 11.43, p < .0001, suggesting that
participants’ tendency to report using the intended cognitive process varied according to the condition to which they were assigned. There was also a large effect size for condition (ηp2 =
Processing (M = 0.70) conditions. The mean Knowledge dominance score (M = 1.79) was higher than the mean dominance score for the Fluid Reasoning and Visual Spatial Processing conditions. The mean dominance scores for the Fluid Reasoning, Quantitative Reasoning, and Visual Spatial Processing conditions were not higher than the mean dominance scores for any other conditions.
For the Nonverbal Scale subtests, there was a significant main effect for condition,
F(4, 96) = 9.61, p < .0001, indicating that participants’ tendency to report using the intended cognitive process varied according to the condition to which they were assigned. There was
also a large effect size for condition (ηp2 = 0.29). Post-hoc comparisons with Bonferroni error
correction indicated that participants in the Knowledge and Visual Spatial Processing conditions reported higher survey ratings for the intended cognitive process when compared to participants in other conditions. Participant ratings from the Fluid Reasoning and
Evidence suggests that participants’ tendency to report using the intended process is strong, both in its statistical significance and effect size. However, the tendency varies according to the subtest/intended cognitive process. Evidence provided strong support for Prediction 1 for the Knowledge factor (both Verbal and Nonverbal Scale subtests), Working Memory Verbal Scale subtest, and the Visual Spatial Processing Nonverbal Scale subtest. Evidence provided moderate support for the validity of the Working Memory Nonverbal Scale subtest. Evidence provided the least support for the Fluid Reasoning subtests (both Verbal and Nonverbal Scale), Quantitative Reasoning subtest (both Verbal and Nonverbal Scale), and Visual Spatial Processing Verbal Scale subtest.
Prediction two. Participants’ answers to open-ended questions about how they solved
the problems on Nonverbal Scale subtests will reflect the cognitive process that the subtest is
intended to measure more than the processes the subtest is not intended to measure.
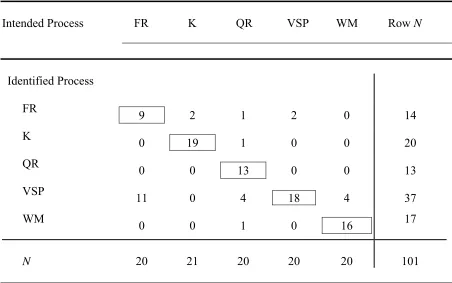
Evidence to support this prediction would manifest in the form of a significant χ 2 value for a 6 (5 cognitive process categories and one “other” category for unclassified responses) x 5 (experimental condition) chi square test of single proportions at alpha = .05. Because there were no responses assigned to the “other” process category, this analysis used a 5 x 5 chi square. Table 3.3 illustrates the number of items assigned by raters to each category according to the cognitive process intended to be elicited by the subtest.
Evidence provided moderate support for the prediction that participants’ open-ended comments would reflect the intended cognitive process more than the unintended process for Nonverbal Scale subtests. A 5 x 5 chi-square test of single proportions indicated the
Table 3.3
Self-Reported Cognitive Process Scores for Participants Sampled Within Each Condition for Nonverbal Scale Subtests
Intended Process FR K QR VSP WM Row N
_______________________________________________________
Identified Process
FR 9 2 1 2 0 14
K
0 19 1 0 0 20
QR 0 0 13 0 0 13
VSP 11 0 4 18 4 37
WM
0 0 1 0 16 17
N 20 21 20 20 20 101
Note. FR = Fluid Reasoning, K = Knowledge, QR = Quantitative Reasoning, VSP = Visual Spatial Processing, and WM = Working Memory. Values in boxes represent the number of comments assigned to the intended cognitive process category for each condition.
expected based on chance, χ2 (16, N = 101) = 234.40, p < .001. Thus, participants’ self-reported cognitive processes varied according to the condition to which they were assigned. Approximately 74% (n = 75) of the participants reported using intended processes, although participants tended to report using Visual Spatial Processing more often than would be expected (n = 37).
Participants reported using the intended process to solve test items from the
Quantitative Reasoning (4 participants), and Working Memory (4 participants) subtests frequently reported using Visual Spatial Processing rather than the intended process.
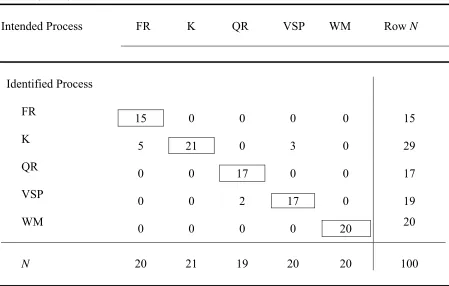
Prediction three.Participants’ answers to open-ended questions about how they
solved the problems on Verbal Scale subtests will reflect the cognitive process that the
subtest is intended to measure more than the processes the subtest is not intended to
measure. Evidence to support this prediction would manifest in the form of a significant χ 2 value for a 6 (5 cognitive process categories and one “other”) x 5 (experimental condition) chi square test of single proportions at alpha = .05. One answer from a participant in the Quantitative Reasoning condition was considered unscorable due to lack of consensus among raters, and thus was excluded from the analyses. Because there were no responses assigned to the “other” category, this analysis used a 5 x 5 chi square. Table 3.4 illustrates the number of items assigned by raters to each category according to the cognitive process intended to be elicited by the subtest.
Evidence provided strong support for the prediction that participants’ open-ended comments would reflect the intended cognitive process more than the unintended process for Verbal Scale subtests. A 5 x 5 chi-square test of single proportions indicated the proportion of scores assigned to each category was significantly different than would be expected based on chance, χ2 (16, N = 100) = 320.50, p < .001. This suggests that participants’ self-reported cognitive processes varied according to the condition to which they were assigned. Ninety percent (n = 90) of the participants reported using intended processes.
Table 3.4
Self-Reported Cognitive Process Scores for Participants Sampled Within Each Condition for Verbal Scale Subtests
Intended Process FR K QR VSP WM Row N
_______________________________________________________
Identified Process
FR 15 0 0 0 0 15
K
5 21 0 3 0 29
QR 0 0 17 0 0 17
VSP 0 0 2 17 0 19
WM
0 0 0 0 20 20
N 20 21 19 20 20 100
Note. FR = Fluid Reasoning, K = Knowledge, QR = Quantitative Reasoning, VSP = Visual Spatial Processing, and WM = Working Memory. One item from the Quantitative Reasoning condition was unscorable due to lack of consensus among raters and thus was excluded from the results. Values in boxes represent the number of comments assigned to the intended cognitive process category for each condition.
Hypothesis Two: Examinees will report using primarily verbal mediation in response to
Verbal Scale subtests and avoid using verbal mediation in response to Nonverbal Scale
subtests.
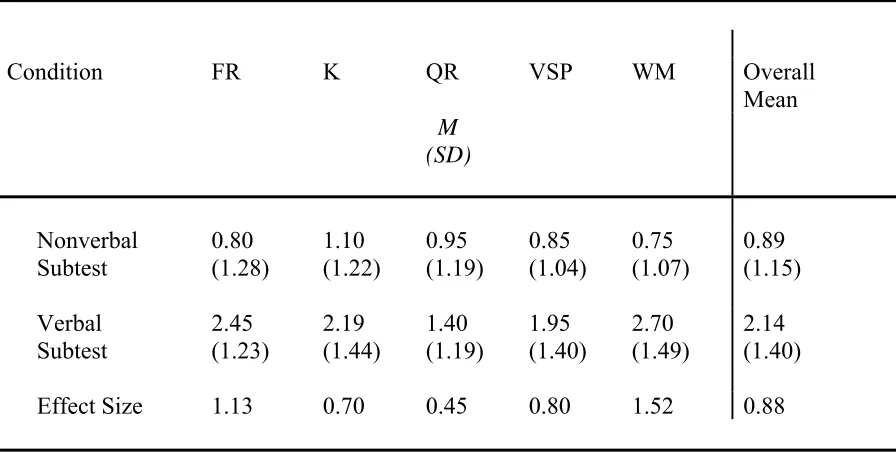
First, descriptive results are presented, and then results relevant to each prediction follow. The evidence for this hypothesis was evaluated using a repeated measures MANOVA (Prediction Four) and chi square analyses (Predictions Five and Six). The mean scores for the inner language survey item for Nonverbal and Verbal Scale subtests, as well as the effect sizes for each condition, are presented in Table 3.5. Mean differences for the survey item scores for each condition were divided by the pooled SD of the score distribution to create effect sizes.
Table 3.5
Mean Response Values for the Inner Language Survey Item for Participants Sampled Within Each Condition
Condition FR K QR VSP WM Overall
Mean M (SD) Nonverbal Subtest 0.80 (1.28) 1.10 (1.22) 0.95 (1.19) 0.85 (1.04) 0.75 (1.07) 0.89 (1.15) Verbal Subtest 2.45 (1.23) 2.19 (1.44) 1.40 (1.19) 1.95 (1.40) 2.70 (1.49) 2.14 (1.40)
Effect Size 1.13 0.70 0.45 0.80 1.52 0.88
Prediction four. The mean rating across all conditions for the degree to which
examinees use verbal mediation will be higher for Verbal Scale subtests than the mean rating
for Nonverbal Scale subtests. Evidence to support this prediction would manifest in the form of a significant main effect for the type of subtest (i.e., Verbal or Nonverbal) on the survey ratings based on a 5 (between- subjects) x 2 (within- subjects) repeated measures MANOVA
at alpha = .05. Should a main effect be significant, partial eta squared (ηp2) will be calculated.
Strong evidence that participants tended to report using more verbal mediation for Verbal
Scale subtests than for Nonverbal Scale subtests would be indicated by a large (ηp2 > 0.26)
effect size, moderate evidence would be indicated by a medium (ηp2 > 0.13) effect size, and
weak evidence would be indicated by a small (ηp2 > 0.02) effect size. Note: Partial eta
squared (ηp2) values were interpreted based on descriptors for Cohen’s (1988) multiple
regression coefficient (R2). Caution should be used when interpreting these values as the proportion of explained variance exactly (Pierce, Block, & Aguinas, 2004).
To examine the support for this prediction for each condition, effect sizes will be calculated. For each condition, large (ES > 0.80) effect sizes will be considered strong evidence for the prediction, medium (ES > 0.50) effect sizes will be considered moderate evidence for the prediction, and small (ES > 0.20) effect sizes will be considered weak evidence for the prediction. Table 3.6 presents the repeated measures MANOVA results for the inner language survey item scores.
Evidence provided strong support for this prediction. A repeated measures
Table 3.6
Repeated Measures Multivariate Analysis of Variance for Inner Language Survey Item Scores
Source df F ηp2 p
_______________________________________________________
Between subjects
Condition 4 0.89 .04 .48
Condition X
Subtest 4 3.69* .13 .01
S within- group
error 96 (2.29)
Within subjects
Subtest 1 3.69* .48 .00
S within- group
error 96 (0.91)
Note. Values in parentheses represent mean square errors. S = subjects. * p < .05.
between subtest and condition (between-subjects), F(4, 96) = 3.69, p < .01. The main effect for condition was not significant, F(4, 96) = 0.89, p > .05. Further, there was a large effect
(ηp2 = 0.48) for verbal vs. nonverbal subtests, and medium effect (ηp2 = 0.13) for the