RISK ANALYSIS OF PORTFOLIO OF FACILITIES
USING MULTI-EVENT MODEL
Sei’ichiro Fukushima1
1 CEO, RKK Consulting, Japan
ABSTRACT
In case of conducting seismic PRA, it is necessary to assess the risk not only of individual facilities but also of the portfolio of facilities. In the previous SMiRT in 2013, author proposed the joint probabilistic seismic hazard surface so that the risk of parallel system consisting of two elements can be evaluated. However, the real systems are more complex; they may be combination of series systems and parallel ones containing many facilities. Multi units of reactors, for example, may be considered as a parallel system and substation or transmission line may be a series system.
Recently the method called “multi-event model” was introduced in the field of financial risk evaluation where the seismic risk of portfolio of buildings is calculated. Concept of multi-event model is quite simple so that its application range is considerably wide. For example author demonstrates its applicability in calculation of business recovery time of supply chain and in calculation of simultaneous damage probability of redundant systems. Though the multi-event model is time consuming since it needs numerous scenario earthquakes and is Monte-Carlo simulation based, progress in computational technique will solve the issue.
This paper proposes the application of multi-event model to PRA of portfolio of facilities consisting of parallel and series systems. Examination on damage correlation is done based on the results of numerical analysis, so that a simple method to evaluate the risk of portfolio can be obtained.
INTRODUCTION
In case of conducting seismic PRA, it is necessary to assess the risk not only of individual facilities but also of the portfolio of facilities. In the previous SMiRT in 2013, author proposed the joint probabilistic seismic hazard surface so that the risk of parallel system consisting of two elements can be evaluated (Fukushima et al. (2013)). However, the real systems are more complex; they may be combination of series systems and parallel ones containing many facilities. For example, multi units of reactors may be considered as a parallel system since one of the units can give the power to the plant site to avoid the blackout. On the other hand, substation and transmission line forms the series system, since all the facilities must survive to give the power to the site.
Annual probability of failure can be calculated by convolving seismic hazard curve and seismic fragility curve; the former gives the relationship between ground motion intensity at the given site and its annual exceedance probability and the latter is the relationship between ground motion intensity and conditional failure probability. It is noted that the seismic hazard curve is defined at a given site so that it cannot be applied to the portfolio whose facilities are located at different locations.
is the summation of loss of each object is evaluated for each event, so that the relationship between total loss and its annual exceedance probability can be obtained as risk curve.
This paper employs the same concept to the more complex system to evaluate its seismic risk. Instead of summing up the loss, fault tree technique is used to evaluate the failure probability of the system consisting of parallel system and/or series one. The result off the risk evaluation is expressed by the risk curve of failure probability.
CONCEPT OF MULTI-EVENT MODEL
Figure 1 shows the concept of multi-event model, where events can be characteristic earthquake such as active faults or inter-plate earthquake, and discretised background earthquakes, as used in the seismic hazard analysis. For each event, the failure probabilities of facilities are calculated, followed by the event tree analysis that gives the functional failure probability of the system.
Figure 1. Concept of multi-event model 0.00
0.25 0.50 0.75 1.00
0 50 100 150 200
0.00 0.25 0.50 0.75 1.00
0 50 100 150 200
0.00 0.25 0.50 0.75 1.00
0 50 100 150 200
Event i
Facility j
Facility 1
… …
…
…
Facility m
Event 1
Event n
p1i
pji
pmi
… …
1-p1i
p1i
1-p2i
p2i
1-pji
PROCEDURE OF RISK ANALYSIS USING MULTI-EVENT MODEL
According to the Fig. 1, the procedure of risk analysis is constructed as shown in Fig. 2, where Monte-Carlo simulation is employed for statistical processing.
Figure 2. Procedure of risk analysis
Generation of Events and Estimation of Ground Motion Intensity
Events are generalized from the seismic zone models around the portfolio of facilities. Each event has following information; location such as longitude, latitude and depth of reference point, shape such as strike, dip angle, fault length and focal width, magnitude and annual occurrence rate. These parameters are usually uses in calculating probabilistic seismic hazard curve.
Being given events, ground motion intensities are estimated using attenuation relation. In many cases, ground motion intensity is peak ground acceleration or peak ground velocity, which may be selected so that seismic fragility curve has better shape, i.e. less variability.
In this paper, ground motion for facility j by event i is hereinafter denoted by xji
Calculation of Failure Probability
Capacity of each facility is expressed by the seismic fragility curve. This paper lets conditional failure
probability for facility j by event i be
kji
p , where k expresses damage state, e.g. slight, moderate,
severe and so on. The conditional failure pkji is obtained by the following equation,
Generation of Events
Estimation of Ground Motion Intensity
Calculation of Failure Probability of Each Facility
Calculation of Failure Probability of System
Statistical Processing
Evaluation of Risk Curve
EQ Data
Site Data
Facility Data Monte-Carlo
)
( ji
kj
kji f x
p = , (1)
where, the function fkj(⋅) is the seismic fragility curve for facilityj.
By employing event tree technique, functional failure probability of the system pFi can be evaluated by
the following equation,
∑
∑
= =
⋅
= N
l l N
l
l l
Fi
w c w
p
1 1
] [
, (2)
where, cl is consequence of path l in event tree and
l
w is weight of the path, respectively.
In case that path l gives functional failure,
l
c is set to unity, otherwise
l
c is null. The weight of path
l w
can be evaluated as the product of probability pkji in path. It is noted that the consequence of path
Statistical Processing
In risk analysis, it is necessary to include the effect of variability in estimating failure probability. Factors that can bring uncertainty are errors in estimating ground motion prediction and capacity of facilities. In the analysis the effect of these uncertainties on failure probability are evaluated by Monte-Carlo simulation, where error in capacity of facility is independent to one another and error in ground motion intensity is dependent to one another reflecting the site-to-site distance.
For event i, the probability distribution function of failure probability of facility j is denoted as
kji
F .
That of functional probability is also denoted as FFi. These probability density functions are evaluated
by using probability paper with numerical results from Monte-Carlo simulation.
Evaluation of Risk Curve
Risk curve of failure probability Rkj(p) of facility j for given failure probability p is obtained by
following equation,
− ⋅ −
=
∑
= n
i
kji i
kj p F p
R
1
)] ( 1 [ exp
1 )
( ν , (3)
where, νl is annual occurrence frequency of event i. Risk curve of functional probability R (p)
F is also
given as follows,
− ⋅ −
=
∑
= n
i
Fi i
F p F p
R
1
)] ( 1 [ exp
1 )
( ν . (4)
APPLICATION
In order to demonstrate the effects of portfolio, two simple functional correlation are employed, where all the facilities are connected as parallel system, or as series system.
Facilities
Figure 3 shows the location of nine model facilities; facility-0 is the reference one located at Tokyo metropolitan government office, 11 to 14 are arranged in the north direction from facility-0, and facility-21 to facility-24 are arranged in the southeast direction from facility-0.
Only one damage state is assumed for simplification, so that the median capacity of 600 [cm/s/s] with its lognormal standard deviation of 0.4 in natural logarithm is given to each facility.
Figure 3. Location of facilities
Seismic Hazard
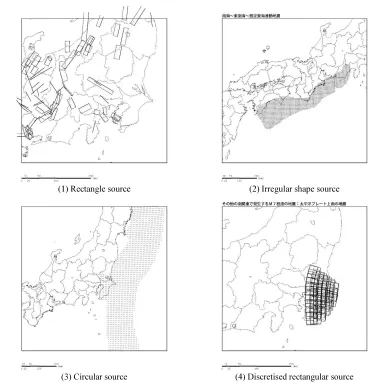
Seismic source zone model is based on J-SHIS2012 (Japan Seismic Hazard Information Station, 2012 ver.), where 4 types of source models are established as shown in Fig. 4.
Rectangle source corresponds to active fault. Irregular shape source consists of numerous points for calculation of distance from site. These two sources are categorizes as characteristic earthquake.
Circular source shows location of focal point with equivalent source area corresponding to magnitude so that distance to the site is magnitude dependent. Discretized rectangular source consists of group of rectangular sources to express the uncertainty of location. These two sources are categorizes as background earthquake.
139E 140E 141E
35N 36N
0 10
20 50
100 (km)
0 11 12 13 14
21
23
24
Figures in parenthesis denotes the distance from site-0
[100]
[50]
[20] [10]
[100] [50] 22
(1) Rectangle source (2) Irregular shape source
(3) Circular source (4) Discretised rectangular source
Figure 4. Example of earthquake model
Ground motion prediction is done using attenuation formula by Si and Midorikawa (1999). Peak ground acceleration at surface is selected as a ground motion measure, which is given by the following equation,
w
M w
r d
r d
d h M
a
5 . 0
10 028 . 0
002 . 0 ) log( 61 . 0 0043
. 0 5 . 0 log
⋅ + =
+ −
+ + +
=
, (5)
where, a is a peak ground acceleration, r is the shortest distance from the source, h is a focal depth, d
is a coefficient corresponding to earthquake type, and
w
M is a moment magnitude, respectively.
Standard deviation of ground motion prediction is given by Hayashi (2006), by which inter-event standard deviation is 0.239 (in common logarithms) and intra-event one is 0.198 (in common logarithms),
respectively. Intra-event correlation ρ is given by the following equation,
) 042 . 0
exp( 1.033
z ⋅ − =
ρ , (6)
Conditions in Risk Evaluation
In the analysis of probability density functions Fkji and FFi, the results of Monte-Carlo simulation are
directly used, i.e. probability density functions are evaluated by counting numbers of samples whose
failure probability exceed the given threshold. The number of trial in simulation is set to 500.
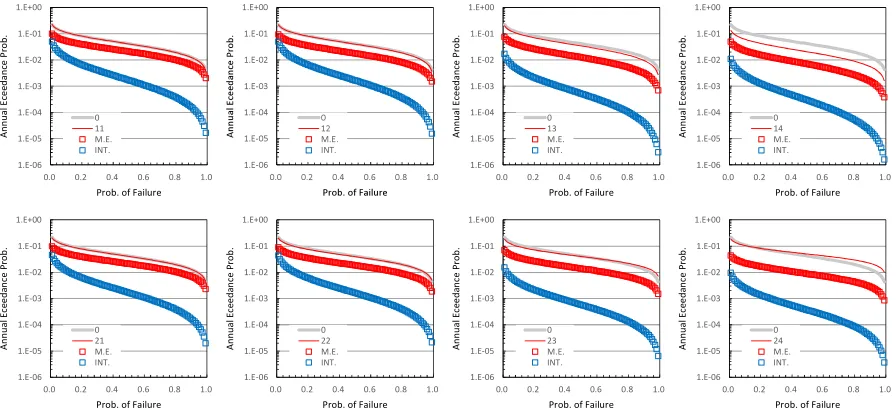
Evaluation of Risk Curves of Parallel System
Figure 5 shows the risk curves in case that two facilities form a parallel system. In Fig.5, bold grey lines show risk curve of facility-0, thin red lines are risk curves of other facilities. Red squares shows the risk of parallel system evaluated by the multi-event model. Blue squares shows the risk of parallel system, where annual exceedance probability is calculated by the following equation,
) ( ) ( ) ( 2
1 p R p
R p
RF = j ⋅ j , (7)
where, j1 and j2 correspond to facilities of concern, respectively.
It is very important to take the effect of correlation of failure into account in risk assessment for portfolio of facilities. Eqn. (7) assume that the correlation of failure between two facilities is perfectly independent, so that the failure probability of parallel system is estimated extremely low. However this assumption is not realistic since earthquake risk is partially dependent. On the other hand, assuming that failure in each facility is perfectly dependent is not also realistic, especially in case that two facilities are located far from each other as shown in Fig. 5, since simultaneous failure may seldom occur.
So, it can be said that multi-event model gives the risk curve duly taking the effect of correlation of failure into account.
Figure 5. Risk curves of failure probability for parallel system
1.E-06 1.E-05 1.E-04 1.E-03 1.E-02 1.E-01 1.E+00
0.0 0.2 0.4 0.6 0.8 1.0
A nnua l E cee da nce P r ob.
Prob. of Failure 0 11 M.E. INT. 1.E-06 1.E-05 1.E-04 1.E-03 1.E-02 1.E-01 1.E+00
0.0 0.2 0.4 0.6 0.8 1.0
A nnua l E cee da nce P rob.
Prob. of Failure 0 12 M.E. INT. 1.E-06 1.E-05 1.E-04 1.E-03 1.E-02 1.E-01 1.E+00
0.0 0.2 0.4 0.6 0.8 1.0
A nnua l E cee da nce P r ob.
Prob. of Failure 0 13 M.E. INT. 1.E-06 1.E-05 1.E-04 1.E-03 1.E-02 1.E-01 1.E+00
0.0 0.2 0.4 0.6 0.8 1.0
A nnua l E cee da nce P r ob.
Prob. of Failure 0 14 M.E. INT. 1.E-06 1.E-05 1.E-04 1.E-03 1.E-02 1.E-01 1.E+00
0.0 0.2 0.4 0.6 0.8 1.0
A n n u al Ec e ed a n c e Pr o b .
Prob. of Failure
0 24 M.E. INT. 1.E-06 1.E-05 1.E-04 1.E-03 1.E-02 1.E-01 1.E+00
0.0 0.2 0.4 0.6 0.8 1.0
A n n u al Ec e ed a n c e Pr o b .
Prob. of Failure
0 23 M.E. INT. 1.E-06 1.E-05 1.E-04 1.E-03 1.E-02 1.E-01 1.E+00
0.0 0.2 0.4 0.6 0.8 1.0
A n n u al Ec e ed a n c e Pr o b .
Prob. of Failure
0 22 M.E. INT. 1.E-06 1.E-05 1.E-04 1.E-03 1.E-02 1.E-01 1.E+00
0.0 0.2 0.4 0.6 0.8 1.0
A n n u al Ec e ed a n c e Pr o b .
Prob. of Failure
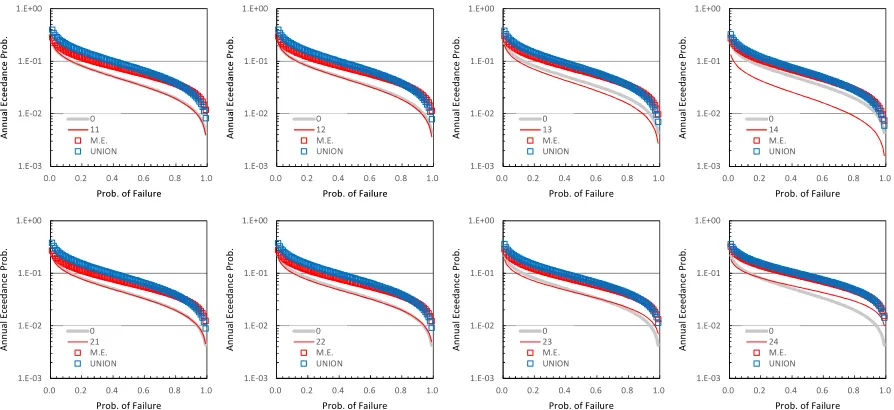
Evaluation of Risk Curves of Series System
Figure 6 shows the risk curves in case that two facilities form a series system. Meaning of lines and of symbols are same as explained for Fig. 5. It is noted that the union shown by blue square is obtained by the following equation,
)] ( 1 [ )] ( 1 [ 1 ) ( 2
1 p R p
R p
RF = − − j ⋅ − j . (8)
Being different from the case of parallel system, Eqn. (8) gives the risk curve close to the one by multi-event model.
Also, if the risk curve of one facility is dominant comparing to other as in the case of facility-0 and facility-14, the risk curve of the series system is close to the dominant one.
It is noted that risk curve by multi-event model remains between those of perfectly dependent and independent.
Figure 6. Risk curves of failure probability for series system
CONCLUSION
This paper proposed a risk analysis method based on the multi-event model, by which seismic risk of the portfolio consisting of plural facilities can be evaluated taking the correlation of failure of each facility into account.
Though the application for simple portfolios; one as parallel system and the other as series system, it was demonstrated that the multi-event model gives the results between ones by independent system and by dependent system. In many realistic cases, failures of facilities must be partially dependent, since ground motion intensity for each facility is partially dependent. Therefore, this method is considered effective in analysing risk of portfolio of facilities.
Another advantage of the method is that it does not require seismic hazard analysis. Though this paper employed seismic fragility curve to obtain failure probability of each facility for each event, there is a
1.E-03 1.E-02 1.E-01 1.E+00
0.0 0.2 0.4 0.6 0.8 1.0
An n u al Ec ee d an ce P ro b .
Prob. of Failure
0 11 M.E. UNION 1.E-03 1.E-02 1.E-01 1.E+00
0.0 0.2 0.4 0.6 0.8 1.0
An n u al Ec e e d an c e P ro b .
Prob. of Failure 0 14 M.E. UNION 1.E-03 1.E-02 1.E-01 1.E+00
0.0 0.2 0.4 0.6 0.8 1.0
An n u al Ec e e d an c e P ro b .
Prob. of Failure 0 13 M.E. UNION 1.E-03 1.E-02 1.E-01 1.E+00
0.0 0.2 0.4 0.6 0.8 1.0
An n u al Ec ee d an ce P ro b .
Prob. of Failure
0 12 M.E. UNION 1.E-03 1.E-02 1.E-01 1.E+00
0.0 0.2 0.4 0.6 0.8 1.0
A n n u al Ec ee d an c e Pro b .
Prob. of Failure
0 24 M.E. UNION 1.E-03 1.E-02 1.E-01 1.E+00
0.0 0.2 0.4 0.6 0.8 1.0
A n n u al Ec ee d an c e Pro b .
Prob. of Failure
0 23 M.E. UNION 1.E-03 1.E-02 1.E-01 1.E+00
0.0 0.2 0.4 0.6 0.8 1.0
A n n u al Ec ee d an c e Pro b .
Prob. of Failure
0 22 M.E. UNION 1.E-03 1.E-02 1.E-01 1.E+00
0.0 0.2 0.4 0.6 0.8 1.0
A n n u al Ec ee d an c e Pro b .
Prob. of Failure
room to use more accurate way to obtain the probability, such as dynamic response analysis. This means that the future risk analysis does not need to be separated into hazard analysis and fragility analysis.
REFERENCES
Fukushima, S. (2013). “Evaluation of Joint Probabilistic Seismic Hazard Surface” Trans. of 22nd
Structural Mechanics in Reactor Technology, IASMiRT, Div.IV.
Hayashi, T., Fukushima, S. and Yashiro, H. (2006). “Effects of the spatial correlation between ground
motion intensities on the seismic risk of portfolio of buildings” J. Structural and Construction
Engineering, AIJ, 600, 203-210.