ABSTRACT
HE, PENG. Reversible Addition-Fragmentation Chain Transfer Polymerization in Amplification-by-Polymerization for DNA Biosensing. (Under the direction of Lin He.)
DNA biosensing has been developed in the past decades and the current state-of-the-art techniques have been employed to amplify DNA hybridization signals in different formats. The challenge nowadays in DNA biosensing lies in simplifying signal readouts and building field-friendly sensors that are amenable to point-of-need applications without compromising achieved sensing sensitivity.
This dissertation reports the development of a simple yet sensitive molecular amplification method, i.e. amplification-by-polymerization, on DNA detection. Chapter 1 described the research background of DNA biosensing from history, development, and significance.
Chapter 2 described the proof-of-concept experiments of RAFT polymerization-based DNA detection method. In particular, surface-initiated polymer growth was regulated by the immobilization of chain transfer agents on the Au surface where DNA hybridization occurred. A linear polymer growth was observed as a function of the reaction time, characteristic of “living” polymer reactions. Significant improvement in assay sensitivity was realized in comparison to the previously reported polymerization-based sensing method by enhancing polymer growth rate and reducing background noises caused by nonspecific adsorption. Direct visualization of fewer than 2,000 copies of a short oligonucleotide sequence was demonstrated in a detector-free fashion.
poly(monomethoxy-capped oligo(ethylene glycol) methacrylate) atop DNA molecules is investigated by monitoring the change of polymer film thickness as a function of reaction time. The reaction conditions, including the polymerization temperature, the initiator concentration, the CTA surface density, and the selection of monomers, were varied to examine their impacts on the grafting efficiency of DNA−polymer conjugates. Comparing to polymer growth atop small molecules, the experimental results suggest that DNA molecules significantly accelerate polymer growth, which is speculated as a result of the presence of highly charged DNA backbones and purine/pyrimidine moieties surrounding the reaction sites.
Chapter 4 describes the possible mechanism of DNA-accelerated RAFT polymerization on surface. A DNA templating theory was discussed to address the observed accelerated surface-initiated RAFT polymerization atop DNA molecules. This DNA templating effect was found to be tunable by adjusting ionic strength, pH value and polarity of the solution. At the same time, chemical structures of monomers and DNA templates, such as negatively-charged monomers and DNA with different sequence length and base, also have an important impact on DNA-templated polymerization.
Reversible Addition-Fragmentation Chain Transfer Polymerization in Amplification-by-Polymerization for DNA Biosensing
by Peng He
A dissertation submitted to the Graduate Faculty of North Carolina State University
in partial fulfillment of the requirements for the degree of
Doctor of Philosophy
Chemistry
Raleigh, North Carolina 2009
APPROVED BY:
_______________________________ ______________________________ Lin He Christopher B. Gorman
Committee Chair Committee member
DEDICATION
BIOGRAPHY
Born: February 21st, 1980, Changsha, Hunan Province, China Parents: Aihua Peng and Jie He
Married: December 18th, 2004 Spouse: Siyang Ding
High School: Changjun High School of Changsha, Diploma, July, 1998 Undergraduate: Shanghai Jiao Tong University
B.E. in Applied Chemistry, July, 2002 Graduate: The University of Southern Mississippi
ACKNOWLEDGMENTS
My advisor, Professor Lin He, provided guidance, patience, and financial support (research assistantship) during my Ph.D. study. Chemistry Department of North Carolina State University also provided financial support (teaching assistantship). My Ph.D. research is supported by National Science Foundation Career Award, NCSU FPRD Award and Start-up Fund.
My Ph.D. committee members, Professors Christopher B. Gorman, Bruce M. Novak, and Keith R. Beck, provided suggestions, comments, and assistance for my Ph.D. research. Professor Keith R. Beck (College of Textiles) also serves as graduate school representative.
All the current and previous members from Professor Lin He’s group are appreciated for their valuable technical assistance for my experiments. Dr. Xinhui Lou, Geoffrey O. Okelo, Weiming Zheng, Hong Qian worked or are working on biosensing project. I highly appreciate Xinhui for her technical training for me at the initial stage of my Ph.D. research. Dr. Zhong Guo, Dr. Qiang Liu, Amel A. A. Ganawi, Abhilasha Shah, Yongsheng Xiao in mass spectrometry project provided assistance for MALDI-MS experiments. Aaron Blue and Susan N. Woody are undergraduates who worked with me for biosensing project in NSF AGEP program and NCSU undergraduate research program.
a lot of valuable suggestions and much encouragement when I prepared my preliminary examination.
I thank Dr. John T. Lai (Noveon Inc. and now Lubrizol Advanced Materials, Inc.) for the gift of the RAFT chain transfer reagent (CTA), Cognis Ltd. for the gift of OEGMA and HEMA monomers, MikroMasch Inc. for the gift of the AFM tips, Erie Scientific Inc. for the gift of Teflon-coated glass slides, and Millipore Inc. for the gift of C18 ZipTip for DNA
desalting. I thank Professors Harold Ade (Physics, NCSU) and Jan Genzer (Chemical & Biomolecular Engineering, NCSU) for the use of their ellipsometer, Professor Gregory Gibson (Genetics, NCSU and currently at Univ. Queensland, Australia) for the protocol on gel preparation, Professor Charles C. Hardin (Biochemistry, NCSU) for his valuable technical assistance in PCR experiments, and Jian Wu (Plant Biology, NCSU) for his helpful assistance in EB staining experiments. I thank Dr. Yuting Li (The University of Southern Mississippi) for his helpful suggestion on RAFT polymerization. Chemistry Department Facilities are appreciated, especially NMR instrument with the help of Drs. Sabapathy Sankar and Anil Sharma, and IR and fluorescence instruments with the help of Dr. Simon Lappi.
(currently at Univ. of Colorado, Boulder), Professor Charles B. Boss (emeritus), Ghada A. Rabah, and Marcie Belisle. I thank Chemistry Department administrative staff and faculty who provided prompt assistance and support for my research and study, including Michelle Clark, Brenda Burgess, Maria D. Moreno, Glenn Hennessee, Thelma Rhone, and Professors Edmond F. Bowden (former Director of Graduate Program) and Morteza G. Khaledi (Department Chair).
I am grateful to the current and previous graduate students and postdocs within the department, Dr. Weijun Niu, Dr. Feng Lv, Dr. Yanli Liu, Dr. Jennifer Ayres, Dr. Ying Zhang, J. B. Clark, Justin Kennemur, Joseph DeSousa, and Samuel I. Jenkins for their helpful discussion and technical support.
I am fortunate to have a lot of friends in NCSU and the friendship is one of the most important parts in my study and life in NCSU. I am so happy to know one of my best friends in NCSU, Lebo Xu and his selflessness is always ready to help others when they need. I am so proud to serve as the leader in a few student or professional organizations, such as President of Chinese Students & Scholars Friendship Association (2007-2008), President of Phi Lamba Upsilon at NCSU (2008-2009), Treasurer of University Graduate Student Association (2008-2009), and Chair of Student & Early-Career Professionals Committee of Association of Laboratory Automation (2008). The great team work and collaboration taught and impressed me very much.
Finally, I would like to thank the full support and encouragement from my family. Without them, I can not make the achievements, especially Ph.D. degree in NCSU. My wife, Siyang Ding shares the toughest years with me in NCSU and I really can not use a few sentences or paragraphs to describe this situation. Our mutual support and encouragement are the main driving force to my degree completion and I firmly believe we will have a brighter future with full of prospects. The love from my parents always gives me much confidence to overcome the difficulties I met with. My parents’ guidance and direction from my childhood are the most precious wealth in my life. My success belongs to all of you!
TABLE OF CONTENTS
Page
LIST OF SCHEMES... xii
LIST OF TABLES ... xiv
LIST OF FIGURES ...xv
CHAPTER 1: Introduction ...1
1.1 History, Development and Significance of DNA Biosensing ...1
1.2 Current Methods in DNA Biosensing ...3
1.2.1 Electrochemical DNA Biosensors ...3
1.2.1.1 Label-Based Detection ...4
1.2.1.2 Label-Free Detection ...6
1.2.2 Optical DNA Biosensors ...7
1.2.2.1 Fluorescence Detection ...8
1.2.2.2 Surface Plasmon Resonance-Based Detection ...9
1.2.2.3 Chemiluminescence Detection ...9
1.2.2.4 Surface-Enhanced Raman Scattering Spectroscopy-Based Detection ...10
1.2.2.5 New Generation of Commercial Optical DNA Biosensors ...10
1.2.3 Combinatorial DNA Biosensors ...11
1.2.3.1 Nanoparticle-Based Detection ...11
1.2.3.2 Carbon Nanotube-Based Detection ...12
1.2.3.3 Quantum Dot-Based Detection ...13
1.2.3.4 Optical Fiber in Detection ...14
1.2.4 Polymer-Based DNA Biosensors ...15
1.2.4.1 Electropolymerization ...16
1.2.4.2 Conventional Free Radical Polymerization ...18
1.2.4.3 Controlled/“Living” Radical Polymerization ...19
1.2.4.4 Other Polymerizations ...21
1.2.5 Limitation and Challenge in DNA Biosensing ...21
1.3 Amplification-by-Polymerization in DNA Biosensing ...22
Page
1.3.2 Photo-polymerization ...25
1.3.3 Reversible Addition-Fragmentation Chain Transfer Polymerization ...26
1.3.3.1 History of Reversible Addition-Fragmentation Chain Transfer Polymerization ...26
1.3.3.2 Mechanism of Reversible Addition-Fragmentation Chain Transfer Polymerization ...27
1.3.3.3 Applications of Reversible Addition-Fragmentation Chain Transfer Polymerization ...28
1.3.3.4 Perspective of Reversible Addition-Fragmentation Chain Transfer Polymerization ...29
1.4 Outline of Dissertation ...29
References ...35
CHAPTER 2: Concept Proof of Reversible Addition-Fragmentation Chain Transfer (RAFT) Polymerization in DNA Detection ...46
2.1 Introduction ...46
2.2 Experimental Section ...48
2.2.1 Materials ...48
2.2.2 Capture Probe Immobilization ...49
2.2.3 Detection Probe Conjugation (CTA-D) ...50
2.2.4 DNA Duplex Formation ...50
2.2.5 RAFT Polymerization for DNA Detection ...51
2.2.6 Instrumentation ...52
2.3 Results and Discussion ...53
2.4 Conclusions ...60
References ...76
Page
3.1 Introduction ...79
3.2 Experimental Section ...80
3.2.1 Materials ...80
3.2.2 Immobilization of CTA-Coupled ssDNA on Gold ...81
3.2.3 Immobilization of CTA-Coupled Small Molecules on Gold ...83
3.2.4 Surface-Initiated RAFT Polymerization ...83
3.2.5 Instrumentation ...84
3.3 Results and Discussion ...85
3.4 Conclusions ...92
References ...108
CHAPTER 4: Mechanism Study of DNA-Accelerated RAFT Polymerization on Surface ..111
4.1 Introduction ...111
4.2 Experimental Section ...114
4.2.1 Materials ...114
4.2.2 Immobilization of CTA-Coupled ssDNA on Gold ...115
4.2.3 Immobilization of CTA-Coupled Small Molecules on Gold ...116
4.2.4 Surface-Initiated RAFT Polymerization ...116
4.2.5 Instrumentation ...117
4.3 Results and Discussion ...118
4.4 Conclusions ...124
References ...139
CHAPTER 5: Application of RAFT-Based DNA Biosensing in In-Gel DNA Detection ....142
5.1 Introduction ...142
Page
5.2.1 Materials ...143
5.2.2 Bind-Silane Treatment of Slides ...144
5.2.3 Conjugation of CTA to Detection Probes ...145
5.2.4 Acrylamide Gel Casting on Slides ...145
5.2.5 DNA Hybridization and Duplex Formation ...146
5.2.6 RAFT Polymerization ...146
5.2.7 Ethidium Bromide Staining ...147
5.2.8 Instrumentation ...147
5.3 Results and Discussion ...148
5.4 Conclusions ...154
References ...165
CHAPTER 6: Application of RAFT-Based DNA Biosensing in Human Genomic DNA Detection ...167
6.1 Introduction ...167
6.2 Experimental Section ...169
6.2.1 Materials ...169
6.2.2 Genomic DNA Extraction from Human blood ...170
6.2.3 Probe Design for Sex-Specific Genomic DNA ...171
6.2.4 Amplification-by-Polymerization for DNA detection ...172
6.2.5 PCR Amplification and Gel Electrophoresis ...174
6.2.6 Instrumentation ...175
6.3 Results and Discussion ...175
6.4 Conclusions ...182
LIST OF SCHEMES
Page Scheme 1.1 Mechanism of RAFT Polymerization ...33 Scheme 2.1 Schematic Illustration of RAFT Reaction Mechanism on the Surface ...61 Scheme 2.2 Schematic Illustration of RAFT-Based DNA Detection ...62 Scheme 2.3 The Chemical Reaction of RAFT Polymerization Grafting on DNA-
Immobilized Surfaces ...63 Scheme 3.1 DNA-Polymer Conjugates Grafted on the Surface Using RAFT Polymerization93 Scheme 3.2 Chemical Steps in Preparation of CTA-Coupled ssDNA Molecules ...94 Scheme 4.1 Schematic Representation of (A) Zip Mechanism and (B) Pick-Up Mechanism of Template Polymerization ...126 Scheme 4.2 (A) Proposed Zip Mechanism for ATRP and (B) Pick-Up Mechanism for RAFT
in DNA Template Polymerization ...127 Scheme 5.1 Schematic Drawing of Major Steps for Polymer-Amplified in-Gel DNA
Detection with Three Spots of Different DNA Sequences Entrapped ...155 Scheme 5.2 Schematic RAFT Reaction from the Entrapped DNA Detector Probes inside of
Gel ...156 Scheme 6.1 Sequence Alignment of the Homologous Region of the Human Gender
Page Scheme 6.2 Probe Design for Sex-Specific gDNA Detection Used in this Study. The Color
Schemes Correct to the Specific Sequences in Scheme 6.1 ...185 Scheme 6.3 Sensor Design and the Expected Color Change in Sex-Specific gDNA Detection
Assays. White Spots Represent Positive Polymer Formation whereas the
Unchanged Spots Represent no Polymer Growth ...186 Scheme 6.4 Schematic Illustration of PCR-Free Sex-Specific gDNA Detection Using
LIST OF TABLES
Page
Table 1.1 Summary of DNA Biosensing Methods ...34
Table 2.1 Summary of the DNA Sequences Used in this Study ...64
Table 5.1 A Summary of Chemical Reagents Used in this Study ...157
Table 6.1 Summary of the DNA Sequences Used in this Study ...188
Table 6.2 A comparison between PCR-based and RAFT-based gDNA detection ...189
Table 6.3 Gender Determination of Unknown Blood Samples Using Amplification-by- Polymerization (RAFT) or PCR ...190
LIST OF FIGURES
Page Figure 2.1 MALDI-MS spectra of DNA probes D before (a) and after (b) the RAFT CTA
coupling. A mass increase of 264 correlated well with the addition of one CTA moiety per probe D ...65 Figure 2.2 A photographic picture of the Au substrates immobilized with the DNA capture
probes NC (left) or C (right) after DNA C'D' hybridization and 2-hr RAFT polymerization. Two spots in replication were clearly visible on the substrate immobilized with the probes C. Experimental conditions: [C'D'] =1 μM, [CTA-D] = 1 μM, hybridization volume = 3 µL, 1 h hybridization, OEGMA:H2O = 1:1
(v/v), AIBN = 0.004 mmol, T = 30 ºC ...66 Figure 2.3 AFM images of POEGMA film growth on DNA-coated Au substrates after 5-hour
RAFT polymerization. The images are 40 µm × 40 µm. The scale bars showing surface roughness are placed on the side of the images ...67 Figure 2.4 ATR-FTIR spectra of CTA-coupled DNA molecules immobilized on a Au surface
before (A) and after (B) the formation of POEGMA. Experimental conditions: [C'D'] =1 μM, [CTA-D] = 1 μM, hybridization volume = 3 µL, 1-h hybridization, OEGMA:H2O = 1:1 (v/v), AIBN = 0.004 mmol, T = 30 ºC, 2-h RAFT ...68
Figure 2.5 (A) Enlarged 1H NMR spectra of OEGMA and (B) POEGMA to show the formation of new proton peaks when polymerization proceeded. CDCl3 was used
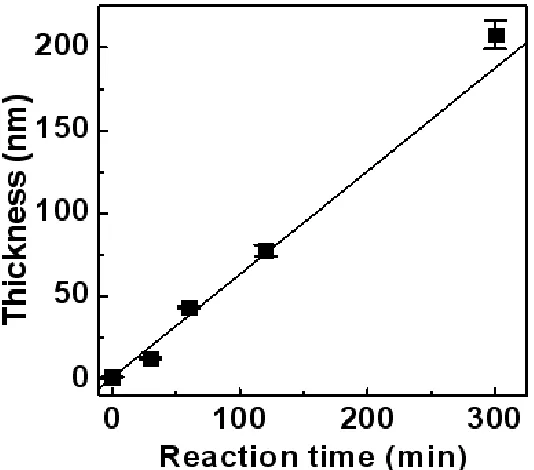
Page Figure 2.6 A plot of the measured POEGMA film thicknesses on the DNA-coated surfaces as
a function of polymerization time. A linear fitting was used to guide the eye. The error bars were calculated experimental standard deviations from four replicates. Experimental conditions: [C'D'] =1 μM, [CTA-D] = 1 μM, hybridization volume = 3 µL, 1-h hybridization, OEGMA:H2O = 1:1 (v/v), AIBN = 0.004 mmol, T = 30
ºC ...70 Figure 2.7 A representative GPC chromatogram of POEGMA after 300-min RAFT
polymerization. The elution peak at 14.03 min corresponded to the polymers with Mn of approximately 31.6K and the broad elution peak at 18.28 min corresponded to the monomers with 408 MW ...71 Figure 2.8 (A) Evolution of OEGMA conversion as a function of reaction time in
RAFT-assisted DNA detection and (B) plots of calculated Mn and PDI of the polymer products as a function of reaction conversion. Both linear fittings were added to guide the eye. Experimental conditions: [C'D'] =1 μM, [CTA-D] = 1 μM,
hybridization volume = 3 µL, 1-h hybridization, OEGMA:H2O = 1:1 (v/v), AIBN
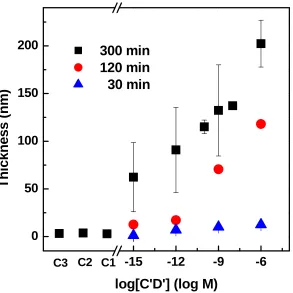
= 0.004 mmol, T = 30 ºC. Samples were collected at various time intervals from the reaction mixture above the substrates ...72 Figure 2.9 A schematic drawing of three control experiments used in DNA sensing ...73 Figure 2.10 Measured POEGMA film thicknesses plotted against target DNA C’D’
Page Experimental conditions: [D] or [CTA-D] = 1 μM, hybridization volume = 3 µL, 1-h hybridization, OEGMA:H2O = 1:1 (v/v), AIBN = 0.004 mmol, T = 30 ºC ..74
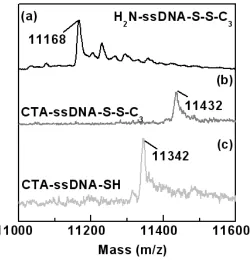
Figure 2.11 A photographic picture of the Au substrates incubated with the target DNA solutions at 1 fM or 1 zM, followed by a 5 h RAFT reaction ...75 Figure 3.1 MALDI-MS spectra of (a) ssDNA, (b) coupled ssDNA, and (c)
CTA-coupled ssDNA after thiol reduction ...95 Figure 3.2 A photographic picture of four substrates in the different stages of RAFT polymer
grafting atop DNA molecules: (a) the reaction spots before reaction, (b) the control spots before reaction, (c) clear polymer growth was observed from two spots where CTA-coupled DNA was immobilized, and (d) the control spots where non-CTA-coupled DNA was immobilized after RAFT reaction ...96 Figure 3.3 ATR-FTIR spectra of (a) a pure Au surface, (b) a ssDNA-coated Au surface, (c) a
CTA-coupled ssDNA-coated Au surface, (d) formation of POEGMA atop
ssDNAs on the Au surface, and (e) formation of PHEMA atop ssDNAs on the Au surface ...97 Figure 3.4 AFM images of POEGMA film growth on DNA-coated Au substrates for (A)
Page Figure 3.5 POEGMA film thicknesses as a function of polymerization time on CTA-coupled
ssDNA-coated substrates (□) or ssDNA-coated substrates without CTA, as the control (○). The error bars were calculated from four replicates ...99 Figure 3.6 Representative GPC chromatogram of POEGMA formed after 5 h RAFT
polymerization. The elution peak at 7.02 min corresponded to the polymers with Mn of approximately 29.6K MW ...100 Figure 3.7 Calculated Mn and PDI of the polymer products as a function of monomer
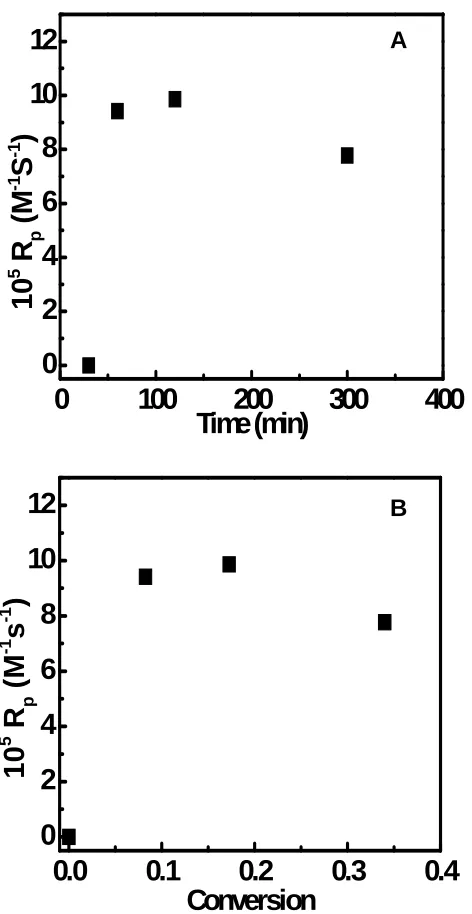
Conversion ...101 Figure 3.8 (A) Plot of the rate of polymerization (Rp) as a function of reaction time and (B)
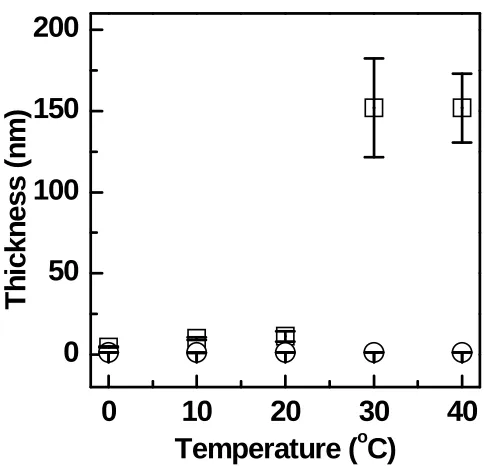
plot of Rp as a function of monomer conversion during RAFT polymerization atop DNA molecules ...102 Figure 3.9 Plots of POEGMA film thicknesses as a function of polymerization temperature
from CTA-coupled ssDNA-coated substrates (□) or ssDNA-coated substrates without CTA as the control (○) ...103 Figure 3.10 Plots of POEGMA film thicknesses as a function of initiator concentration from
CTA-coupled ssDNA-coated substrates (□) or ssDNA-coated substrates without CTA as the control (○) ...104 Figure 3.11 Plots of POEGMA film thicknesses as a function of CTA surface density from
Page Figure 3.12 Plots of POEGMA film thicknesses as a function of polymerization time from
CTA-coupled ssDNA-coated substrate (□), CTA-coupled small molecule-coated substrate at full coverage (○), and CTA-coupled small molecule-coated substrate at the same surface CTA density as CTA-coupled ssDNA-coated substrates (Δ) ...106 Figure 3.13 Plots of PHEMA film thicknesses as a function of polymerization time from
CTA-coupled ssDNA-coated substrate (□), CTA-coupled small molecule-coated substrate at full coverage (○), and CTA-coupled small molecule-molecule-coated substrate at the same surface CTA density as CTA-coupled ssDNA-coated substrates (Δ) ...107 Figure 4.1 Plots of PHEMA film thicknesses as a function of polymerization time from
CTA-coupled ssDNA-coated substrate (□), CTA-CTA-coupled small molecule-coated substrate at full coverage (○), and CTA-coupled small molecule-coated substrate at the same surface CTA density as CTA-coupled ssDNA-coated substrate (Δ) .129 Figure 4.2 (A) ATR-FTIR spectra of DNA, HEMA, and the mixture of DNA and HEMA and
(B) ATR-FTIR spectra of the mixture of DNA and HEMA, the mixture of DNA and sodium methacrylate, and the mixture of high CG% DNA and HEMA ...130 Figure 4.3 NMR spectra of DNA (sample 1), HEMA (sample 2), the mixture of DNA and
HEMA (sample 3), and the mixture of DNA, HEMA and NaCl (sample 4). D2O
Page Figure 4.4 Plots of PHEMA film thicknesses as a function of polymerization time from
CTA-coupled ssDNA-coated substrate by RAFT polymerization (□) and initiator-coupled ssDNA-coated substrate by ATRP at the same surface ssDNA density as CTA-coupled ssDNA-coated substrate (○) ...132 Figure 4.5 Plots of PHEMA film thicknesses as a function of salt concentration from
CTA-coupled ssDNA-coated substrate (□) and CTA-CTA-coupled small molecule-coated substrate at the same surface CTA density as CTA-coupled ssDNA-coated
substrate (○). The polymer film thicknesses in control experiments of ssDNA and small molecules are 2.3 ± 0.0 nm and 1.2 ± 0.0 nm, respectively ...133 Figure 4.6 Plots of PHEMA film thicknesses as a function of pH value from CTA-coupled
ssDNA-coated substrate (□) and CTA-coupled small molecule-coated substrate at the same surface CTA density as CTA-coupled ssDNA-coated substrate (○). The polymer film thicknesses in control experiments of ssDNA and small molecules are 2.0 ± 0.1 nm and 1.6 ± 0.4 nm, respectively ...134 Figure 4.7 Thickness ratio of poly(hydroxyethyl methacrylate) (green column) and
poly(sodium methacrylate) (red column) growth atop DNA vs. small molecules as a function of polymerization time ...135 Figure 4.8 Plots of polymer film thicknesses as a function of H2O percentage in
Page CTA-coupled ssDNA-coated substrate (○). The polymer film thicknesses in
control experiments of ssDNA and small molecules are 1.8 ± 0.3 nm and 1.6 ± 0.4 nm, respectively ...136 Figure 4.9 PHEMA film thicknesses atop DNA with different sequence length (35-mer and
17-mer) ...137 Figure 4.10 PHEMA film thickness atop DNA with different C/G base percentage (71%,
14%, and 9%) ...138 Figure 5.1 ATR-FTIR spectra of (a) the negative control spot (spot 1) and (b) the reaction
spot (spot 2) in the gel after RAFT polymerization. The spectra were offset for clarity ...158 Figure 5.2 Photographic pictures of a gel substrate before (A) and after (B) RAFT
polymerization. Spot 1# was the negative control, 2# the target DNA, and 3# the positive control. The dotted circles were drawn to guide the eye ...159 Figure 5.3 (A) A 10 µm × 10 µm AFM image of POEGMA grown atop DNA molecules
embedded in gel after RAFT polymerization and (B) the z-value profile of the same spot where the black line locates. More than 200 nm in height difference was clearly observed for the features on the surface. Corresponding zoom-in AFM images from (C) Spot 2 and (D) Spot 1. Both were scanned at 1 µm × 1 µm. The scale bar on the right shows the relative height in nanometers ...160 Figure 5.4 Quantitative detection of in-gel DNA targets with different concentrations. The
Page Figure 5.5 Selective detection of in-gel DNA targets of different sequences. The error bars
were calculated from four replicates ...162 Figure 5.6 Thicknesses of polymer growth on DNA-embedded gel surfaces as a function of
polymerization time. The error bars were calculated from four replicates ...163 Figure 5.7 (A, C) Photographic pictures of polymer growth on gel substrates after RAFT
polymerization and (B, D) fluorescence images after EB staining. Spot 1 is where target DNA was detected and Spot 2 is the negative control where
non-complementary sequence was entrapped. The amount of target DNA entrapped was (A, B) 1 ng or (C, D) 0.1 ng per spot ...164 Figure 6.1 Concept proof of human genomic DNA detection using
amplification-by-polymerization: Genomic male and female sequences as targets in capture probes X and Y-coated Au surface, respectively, for genomic DNA recognition compared with short linker sequences as positive control and noncomplementary sequences as negative control. The error bars were calculated from four replicates ...191 Figure 6.2 Blocking oligonucleotide number effect on thermal denaturation of genomic DNA
with blocking oligonucleotides. The error bars were calculated from four
replicates ...192 Figure 6.3 Annealing temperature effect on thermal denaturation of genomic DNA with
blocking oligonucleotides. The error bars were calculated from four replicates .193 Figure 6.4 Annealing time effect on thermal denaturation of genomic DNA with blocking
Page Figure 6.5 A representative gel image of PCR detection of unknown samples 11-17#. L:
CHAPTER 1 INTRODUCTION
1.1. History, Development and Significance of DNA Biosensing
Accurate qualification and quantification of biologically and environmentally important analytes have long been a vital component in analytical research. These requirements call for the birth of detection devices, which connect the biological analytes with detecting components to generate the concept: biosensors. Biosensors are ideally small and portable analytical devices that perform selective detection of chemical and biochemical analytes at molecular levels. They consist of three components: the biological receptor, the transducer, and the processor. The biological receptors are species that recognize target analytes. The transducers are defined as devices that convert biological recognition events into measurable signals. The processors operate by converting the measured signals to the ones that can be interpreted by the users. An ideal biosensor should possess distinctive and stable receptors that provide accurate and precise responses, but with simple and cheap experimental set-up that uses miniaturized and biocompatible probes.1
biosensors has made a rapid expansion with an estimated ~5% annual growth rate in recent years.1 This rapid development of innovative biosensing technologies is attributed to increasing demands in the fields of medical diagnosis and biowarfare defense.1 Further, biosensors and biosensor-related techniques have exhibited enormous potential in providing invaluable information in the fields of toxicology, biology, and environmental science.3
In recent years, DNA-based diagnostic tests have attracted much interest and the development of DNA detection systems is stimulated by applications in various fields: DNA diagnostics, gene analysis, fast detection of biological warfare agents, forensic applications, and environmental and food analysis.4-6 The analysis of gene sequences and the study of gene polymorphisms play a vital role in rapid detection of genetic mutations at the molecular level, opening up the feasibility of performing reliable diagnostics even before any symptom of a disease appears; the detection of specific DNA sequences can be employed for the detection of genetically modified organism or pathogenic bacteria in environmental and food analysis. Various DNA detection devices based on the hybridization between a DNA target and its complementary probe in different media offer the determination of DNA sequences by means of optical or electrochemical approach.7-12 However, the current devices are still far from the
theory of complementary base pairing. The DNA hybridization signal transducer can be optical, electrochemical, or mass-sensitive devices.
1.2. Current Methods in DNA Biosensing
1.2.1. Electrochemical DNA Biosensors
An electrochemical biosensor is a small device to provide quantitative or semi-quantitative analytical information via a biological recognition element such as biochemical receptors.13 Since the biochemical film is directly coated on electronic conducting materials, an electrochemical biosensor is also considered a chemically modified electrode.14 Amperometric and potentiometric transducers are most commonly used in electrochemical biosensors. For example, potentiometric devices produce analytical signals by converting the biorecognition process into a potential signal using ion-selective electrodes.15 With high sensitivity and wide linear range, an amperometric biosensor is also attractive and has been widely used in clinical applications.16 A rising field in electrochemical biosensors is the utilization of chips and electrochemical methods in the detection of oligonucleotide binding. By delivering the diagnostic information in a fast, simple, and low cost fashion, these devices are extremely useful and uniquely qualified for meeting the demands of point-of-care cancer screening with the aid of high sensitivity of modern electrochemical bioaffinity assays.
significant improvement of solid electrodes has expanded the applicability of electrochemical methods for nucleic acid analysis. The immobilization step requires a well-oriented capture probe open for hybridization with the target analyte. The nature of the physical transducer determines the method used to attach the DNA probe to the solid surface. The use of thiolated DNA probe onto gold transducers via gold-thiol interaction is the most popular approach. Another method is to biotinylate DNA probe for attachment through biotin-avidin interaction on electrode surface.19,20 The hybridization is usually detected by the changes in signal measurement due to indicator or electrochemical parameters. The electrochemical DNA biosensor is divided into two main types: label-based detection and label-free detection.
1.2.1.1. Label-Based Detection
In label-based electrochemical DNA biosensors, enzyme, organic dyes, and metal complex are the most widely used indicators, which bind single-stranded DNA and double stranded DNA with different affinities to produce a variation of the electrochemical response near the electrode surface during the electroactive hybridization. Enzymatic labels bound to the DNA probe, catalyze a redox reaction, leading to an electrochemical change due to the hybridization event. de Lumley-Woodyear et al. used a horseradish peroxidase to label DNA target to monitor the duplex formation with a carbon fiber transducer and found the electro-reduction of H2O2 with single base-pair resolution based on a highly sensitive amperometric
glucose oxidase with several oligonucleotide sequences demonstrated significant signal amplification for enhanced detection sensitivity.25
Organic dyes are commonly used to intercalate with DNA chains to detect DNA concentration in biological systems and ethidium bromide and methylene blue are two representatives of them. It was reported that ethidium bromide intercalated into the double-stranded DNA after covalent immobilization of DNA probes onto a graphite electrode and hybridization to the DNA target, which gave off a signal for DNA detection shown in cyclic voltammetry characterization.26 Methylene blue has a strong affinity for free guanine bases and can mediate the electrocatalytic reduction of ferricyanide for the redox-active intercalative marker regeneration.27 Generally, the electrochemical detection of DNA via an interacting electroactive substance is a convenient approach for DNA hybridization measurements without any chemical modification of DNA target in advance.
Ferrocene, an organometallic compound, can be used to label DNA sequences because it is a very stable electrostatic- and groove-binder for double-stranded DNA. For example, electrochemical detection of sequence-specific DNA using aminoferrocene-labeled DNA probe was realized, providing a stronger and more stable attachment to the DNA probe.28 In
1.2.1.2. Label-Free Detection
In contrast to label-based indirect detection where labeling is a prerequisite to translate the hybridization event into a readable signal, label-free detection offers a target molecule or any other object to the system without labeling for direct electrochemical detection.30 In a label-free method, the biological recognition in the analyte was converted into a readable signal by the transducer to identify the fact that the immobilized DNA probe hybridizes to a complementary target and the signal strength depends on the amount of target molecules and the hybridization efficiency. Although detection sensitivity and specificity could be partially compromised, the merits of label-free detection are listed as follows: (1) eliminating the labeling steps to simplify the readout, the speed and ease of nucleic acid assays; (2) reducing analysis times and cost; and (3) avoiding unfavorable effects such as instability and steric hindrances from the labels.
were also conducted to track hybridization in DNA biosensors. As a technique to investigate interfacial properties, impedance was directly utilized on in-situ detection of hybridization between complementary homo-oligomer DNA strands.33 Direct electrooxidation of sugar residues in copper electrodes was used to monitor the DNA hybridization in the picomolar range since more sugar residues were available in DNA duplex structures.34
In summary, electrochemical DNA biosensors are comparatively simple, fast, and economical for miniaturization and large-scale production.35 Until now, they are the most commonly used DNA biosensors and the optimization of current electrochemical DNA biosensing devices is the most realistic approach for DNA biosensor commercialization. With the highly improved experimental conditions, electrochemical transduction is the most suitable equipment for diverse DNA diagnosis of many infectious and inherited diseases.
1.2.2. Optical DNA Biosensors
optically detected using fluorescence, surface plasmon resonance, chemiluminescence, and surface-enhanced Raman scattering spectroscopy.
1.2.2.1. Fluorescence Detection
1.2.2.2. Surface Plasmon Resonance-Based Detection
Surface plasmon resonance is a quantum optical-electrical phenomenon, where the excitation of surface plasmons is produced by the interaction of light with metal planar surfaces. Surface plasmon resonance-based DNA biosensors are based on monitoring the changes caused by the surface binding reaction or absorption in surface optical properties such as interfacial refractive index. Different moieties with different molecular weight, mass, chemical structure, and binding affinity show different signal changes on surface. Recently, this technique was used to study DNA assembly and DNA hybridization by immobilizing thiolated oligonucleotides onto suitable photolithographic pattern gold substrates and the detection limit was nanomolar level.42,43 These DNA biosensor systems render label-free and rapid detection, but offer a comparatively low detection sensitivity as main drawback.44
1.2.2.3. Chemiluminescence Detection
Chemiluminescence reactions are catalyzed by a biomolecular catalyst. The first sample is the peroxidase-catalyzed chemiluminescent oxidation of luminol, leading to light emission of aminophthalate from the excited state to the ground state.45 Recently, Expression Array
1.2.2.4. Surface-Enhanced Raman Scattering Spectroscopy-Based Detection
Surface-enhanced Raman spectroscopy is a sensitive technique for surface characterization and molecular detection using the enhancement of Raman scattering by molecules adsorbed on rough metal surfaces. For that, the pre-labeled DNA probes were firstly hybridized to DNA fragments on nitrocellulose, and then transferred on a surface-enhanced Raman scattering spectroscopy-sensitive substrate for signal detection.47 This platform was applied to breast cancer diagnosis on the modified silver surfaces.48 The surface-enhanced Raman spectroscopy-based detection offered several benefits, including high spectral specificity and a size-controlled and reproducible substrate.
1.2.2.5. New Generation of Commercial Optical DNA Biosensors
It is worthy to note a few successfully commercial available optical DNA biosensors in the past years. GeneChip® high-density microarray from Affymetrix company based on fluorescence-based detection was used to sequence thousands of bases with high accuracy, which set up the industry standard for bioanalytical and biomedical research. As an industry pioneer, fluorescence-detecting microbead-based BeadXpress® array system from Illumina
1.2.3. Combinatorial DNA Biosensors
Some DNA biosensors are built up by combined techniques based on different physical and chemical properties and the representative of them is material-based DNA biosensor. In recent years, the prospective applications of nanoscale materials in a variety of scientific fields including electronics, sensors, high-strength fibers and field emission, have been launched. The excellent physical and chemical properties of novel nanomaterials have attracted considerable attention and have expanded their application scope to life science. One of the promising aspects is signal amplification for ultrasensitive detection of disease markers and biothreat agents. The new horizon is open for highly sensitive bioaffinity and biocatalytic assays that employ electronic, optical, or microgravimetric signal transduction. The use of nanoparticle labels and the formation of nanoparticle-biomolecule assemblies allow great signal enlargement that offers the basis for ultrasensitive optical and electrical detection with PCR-like sensitivity.49,50 DNA detection can be achieved by different types of nanomaterials, such as nanoparticles, carbon nanotubes, and quantum dots.
1.2.3.1. Nanoparticle-Based Detection
a milestone, this method offers no instrument need for signal read-out in a fast and easy fashion with nanomolar-level detection limit. The detection limit has been further improved to zeptomolar level by the scanometric approach coupled bio-bar-code amplification strategy.53 Gold nanoparticles were also used into surface plasmon resonance and quartz crystal microbalance to detect the target DNA hybridization.54,55 Silver-gold nanoparticles functionalized with oligonucleotides and Raman labels, coupled with surface-enhanced Raman scattering spectroscopy, were used to execute multiplexed DNA detection in a sandwich format.56
Microscale labels such as magnetic nanoparticles were used to match the size of molecular recognition bioprobes and analyte targets.57 The behavior of this system highly depends on nonspecific background signals for sensitivity, specificity and reproducibility. Magnetic nanoparticles were conducted to multiplexed analysis for femtomolar detection of DNA and proteins in complex biological samples such as blood, serum, plasma and milk.58
1.2.3.2. Carbon Nanotube-Based Detection
research has been reported that the conductivity of carbon nanotubes can be altered up to 3 orders of magnitude within a very short exposure time, so this new kind of nano-materials can be used to fabricate the biosensors.70,71
The employment of carbon nanotubes in DNA analysis plays an important role by development of carbon nanotube-based DNA biosensors. Carbon nanotubes not only offer an intermediate for immobilization of DNA molecules but also act as powerful amplifier to amplify signal transduction of hybridization. A new biosensor based on DNA-wrapped carbon nanotubes was used in living cells. The nanotubes emitted infrared light and the signal changed when cancer drugs or molecules that damage DNA bind with the sensor, which was a new tool for scientists to real-time investigate the life of cells.72 An aligned carbon nanotube ultrasensitive DNA biosensor was built up based on aligned single wall carbon nanotubes with integrated single-strand DNAs.73 DNA hybridization between surface immobilized DNA and target DNA was detected by this ultra-sensitive fabrication in a label-free and real-time electronic detection manner, with the higher projected sensitivity level compared to other traditional hybridization detection assays.
1.2.3.3. Quantum Dot-Based Detection
been proven to possess more stable and fluorescent brightness. Benefiting from the special physical properties related to their quantum-confined nature, quantum dots serve as a potential functional platform for novel materials and devices.78-80 For composite semiconductor QDs such as CdSe/ZnS, different particle size distribution can provide continuous and expected changes in fluorescence emission. QDs are investigated as the basis for new materials and devices including biosensors.81-83
Quantum dot-based DNA biosensors based on fluorescence resonance energy transfer can detect very low concentration of DNA without any separation of unhybridized DNA. Quantum dots are modified with specific DNA probes to capture target DNA and the target DNA strand binds to a fluorophore-labeled reporter strand. During the hybridization, quantum dots concentrate the signal to produce a very strong signal via donor-acceptor assembly.84 Quantum dots have attracted much attentions for their potential in in-vivo biological targeting and imaging field and a mixture of CdSe/ZnS quantum dots in polymeric microbeads was used as detection tags for multiplexed DNA detection.85 This method introduced single-bead spectroscopy measurements corresponding to the sequence information of the target analyte after hybridization with quantum dot-labeled DNA probes. However, the sensitivity, specificity, and cytotoxicity are three major problems that have yet to be resolved.
1.2.3.4. Optical Fiber in Detection
single-stranded DNA probe at the end of the fiber and the observation of the fluorescent changes from a fluorescent indicator related with the double-stranded DNA hybrid.86 An optical fiber DNA biosensor for the real-time detection of multiple DNA sequences was developed and the hybridization of fluorescent labeled complementary sequences was monitored and transduced by evanescent wave devices. The combinations of optical fiber bundle tips to different DNA-coated microspheres were identified by different fluorescent labels in an optical microarray-based DNA biosensor with zeptomolar detection.87 The advantages and disadvantages of optical fiber DNA biosensors are very obvious. The advantages include small diameter of optical fibers for further miniaturization, remote detection of inaccessible or dangerous samples, and low measurement interference and noise for wide applications. The disadvantages are poor stability and vulnerability to environment.
1.2.4. Polymer-Based DNA Biosensors
chemistry has been extensively developed to fabricate different polymeric materials for biosensing devices by different polymerization methods. Due to their different benefits, interest in various polymerization means is growing rapidly, as confirmed by the available reports focusing on polymerization techniques. The different polymerization reactions suitable for biosensing will be discussed in more details in the following subsections.
1.2.4.1. Electropolymerization
contrast, the growth of conductive polymers, defined as organic polymer semiconductors with extended delocalized bonds in localized states, is virtually unlimited and governed by the electrode potential and the reaction time, which offers an opportunity to control the thickness of the resulting film.99 The role of electropolymers in DNA biosensing is transducing the DNA hybridization event into the electrochemical signal which can be detected by electro-processor. The representative monomers for the most extensively studied conducting polymers are pyrrole and aniline since they are easily oxidized, water-soluble, commercially available, and possesses environmentally stability, good redox properties, and high electrical conductivity.100 Cyclic voltammetry technique indicated that a peak at 1.1 V is consistent with the oxidative coupling mechanism for polypyrrole formation, leading to a zero kinetic order dependence on monomer concentration for polymerization.101
Recently, electropolymerization has attracted much interest in the development of biosensing devices since the discovery of new conducting polymeric systems. One major advantage is the electrochemical addressing that permits the reproducible and precise polymer formation over surfaces to immobilize separately different biomolecules on closely spaced microelectrodes, providing an attractive way for the elaboration of biosensing devices.92 Gros and his coworkers described a polypyrrole-containing Fe(CN)63- modified
electrode by anodic electropolymerization in an aqueous solution for the future application in amperometric biosensors.102 John and his coworkers reported anti-human serum albumin (anti-HSA) incorporation into polypyrrole film via a simple one-step galvanostatic polymerization for a direct detection of the corresponding antigen HAS.103 Livache and his
pyrrole group to build up the electrochemical construction of DNA matrix on microelectrode.104 Garnier and his coworkers employed electropolymerization of peptides and dipeptides bearing a pyrrole group to provide conductive polymers enabling the specific recognition of proteolytic enzymes.105 More recently, Ramanathan and his coworkers demonstrated the successful entrapment of avidin into a polypyrrole nanowire and its bioaffinity for the specific anchoring of biotinylated oligonucleotides thus opening the way for a new generation of nanobiosensor capable of sensing a single-biomolecule.106
1.2.4.2. Conventional Free Radical Polymerization
partially compromise the signal enlargement degree in the definite time. The uncontrolled polymers also can make nonspecific reaction to bring high background noise for the sensing devices.
1.2.4.3. Controlled/“Living” Radical Polymerization
1.2.4.4. Other Polymerizations
Ring-opening polymerization (ROP), molecular imprinting polymerization (MIP), emulsion polymerization (EP), UV polymerization (UVP), and plasma polymerization (PP) have also been utilized in the fabrication of biosensing devices. Sosnowski and his coworkers carried out the polymerization of lactones by ROP in bulk or in solution, emulsion, or dispersion for bioresorbable devices.118,119 Piletsky and his coworkers used MIP to prepare methacrylic polymers as the selective bioreceptors for nucleotides, amino acids, and herbicdes.120 Puech and his coworkers synthesized the biodegradable polymers functionalized by gluconamide (N-methylnorbornylgluconamide) groups by EP, which was proven to be good immobilization matrices for glucose oxidase.121,122 Brahim and his coworkers obtained electrode-supported hydrogel films by UVP of the 2-hydroxyethylmethacrylate (HEMA) component within the interstitial spaces of the pre-formed hydroxyl network.123 Cheng and his coworkers used PP to polymerize N-isopropyacrylamide (NIPAM) in a custom-built reactor to produce smart-responsive coating.124 All the polymers used here serve as biomolecular receptors, signal transducers, fluorescence labels, etc. in DNA biosensing.
DNA biosensing methods are summarized in Table 1.1.
1.2.5. Limitation and Challenge in DNA Biosensing
improve patients' health outcomes.125-130 With the launch of such public and private single nucleotide polymorphisms (SNP) database, the efforts in utilizing the gained knowledge to develop SNP detection-based test kits have been initiated in the field of bioanalytical chemistry. To be applicable in point-of-care diagnosis, these kits need to reliably evaluate an individual’s susceptibility to a specific disease or the expected severity of a disease. To date, fabricating such devices with the basic sensing requirements is still challenging in the following aspects: (1) sensitivity/selectivity: to detect few copies of specific DNA sequences in the presence of complex DNA matrices; (2) accuracy: to identify the exact SNP sites with the aid of redundant measurements or cluster analysis; (3) throughput: to conduct of such testing in a timely fashion; and (4) cost: to make the test suitable to daily clinical analysis by minimizing the reagent cost and eliminating extensive usage of complex instruments to the most degree.
While current sensing techniques have greatly improved DNA detection sensitivity and specificity, the reported protocols are still far away from applications in clinical settings. The main obstacle is the requirements for special laboratory skills in detection label preparation and in instrument set-up. Sensitive detection of SNPs with off-shelf chemistry in an instrument-free detection fashion is in demand.
1.3. Amplification-by-Polymerization in DNA Biosensing
that polymerization essentially is a highly efficient signal amplification process with the enhancement power controllable at will. For example, chain addition polymerization is a continuous molecular assembly process where small monomers covalently link to each other in a head-to-tail fashion and form a long polymer chain containing a huge number of repeating units. As a result, the information contained in the small monomer unit can be amplified hundreds to thousands times through chain propagation.
An “amplification-by-polymerization” approach has recently been developed by our group, in which DNA recognition is converted to effective mass growth.131 In this approach, formation of polymer brushes upon DNA binding leads to an assembly of polymer chains tethered at one end to a surface. Formation of polymer brushes on the surface results in an opaque spot that can be easily distinguished by naked eyes. In this approach, any type of polymerization reactions can be used in DNA sensing, as long as it exhibits certain important characteristics, including compatibility in a biomolecular environment and chemical inertness to biomolecules. Currently, three polymerization methods used in the concept of “amplification-by-polymerization” are atom transfer radical polymerization (ATRP), photo-polymerization, and reversible addition-fragmentation chain transfer (RAFT) polymerization.
1.3.1. Atom Transfer Radical Polymerization
In concept proof experiment, Lou et al. demonstrated that a DNA detection method in which polymer growth in atom transfer radical polymerization (ATRP) was used to amplify detection signals for DNA hybridization.131 In this system, DNA hybridization and ligation
initiators, leading to consequent growth of poly(hydroxyethyl methacrylate) (PHEMA) atop DNA molecules. The formation of PHEMA altered substrate opacity, providing the distinguishable spots to the naked eye. In order to improve the visibility of DNA hybridization and shorten the detection time, hyperbranched polymers were formed via a second ATRP reaction by coupling initiators to polymer brushes to directly visualize 1 fmol of target DNA molecules of interest. At the same time, the perfectly matched DNA targets were typically differentiated from those with DNA point mutations. The same concept was applied into a direct surface-grafting approach to forming DNA-containing polymer shells outside of Au nanoparticles using ATRP.132 The presence of thick polymer shells which improved particle stability induced a visible color difference of the solutions. “Reverse” colorimetric DNA detection by the formation of core-shell particles upon DNA hybridization was achieved based on this strategy in which polymer reaction initiators were covalently linked to suspended nanoparticles upon DNA hybridization.133
With the aim of eliminating dissolved oxygen-induced ATRP catalyst oxidation and radical chain termination, the use of Cu(0) as a reducing reagent allowed DNA detection to be conducted in a purge-free fashion.134 DNA detection sensitivity was not compromised
electrochemical biosensing and amplification-by-polymerization approach was designed on DNA biosensing.136 In particular, AGET ATRP was triggered after the capture of target molecules on the electrode surface. Polymer brushes with long chains supplied coupling sites for aminoferrocene to enhance electrochemical signal output, leading to a picomolar-level detection limit for DNA.
However, several problems that are inherent in ATRP-based DNA biosensing methods limited the sensitivity improvement and future applications, including the slow growth rate of ATRP due to the low radical density in the system at any given moment, strong background noise due to non-specific adsorption from interactions of DNA molecules and positively-charged metal catalysts, and the potentially toxic metal catalysts required in ATRP that may hinder future clinical application.
1.3.2. Photo-polymerization
compared with optical microscopy or CCD camera.138,139 In lab on a chip-based analysis, photo-polymerization was used to subtype the influenza virus from crude lysates by coupling a polymerization reaction to a protein–protein recognition event.140
Nevertheless, the complicated organic synthesis of photoinitiators and tough experimental condition such as the stability of biomolecules in irradiation (DNA damage can be caused by UV light and radiation in human cells) could hinder the further development of polymerization-based amplification technique.
1.3.3. Reversible Addition-Fragmentation Chain Transfer Polymerization
1.3.3.1. History of Reversible Addition-Fragmentation Chain Transfer Polymerization
aryl functional groups of O-Y, -NYY’, or S-Y that determine the general reactivity of the carbon-sulfur double bond and the lifetime of the intermediate radical resulting from the addition of a radical species across the carbon-sulfur double bond. The R groups are to tune the overall reactivity to effectively mediate polymerization in a well-controlled fashion. Overall, the control in RAFT polymerizations is a balanced result among the addition (Z-group controlled), lifetime of the intermediate radical (Z-(Z-group dominated and R-(Z-group contributed), the fragmentation step(s) (predominantly R group controlled) and the associated reaction rate constants.143-147
1.3.3.2. Mechanism of Reversible Addition-Fragmentation Chain Transfer
Polymerization
The mechanism of RAFT is shown in Scheme 1.1: the RAFT process involves conventional free radical polymerization of a substituted monomer (some atoms on the molecules substituted by other functional groups) in the presence of a suitable CTA. Initiation is accomplished utilizing conventional thermal, photochemical, redox, or γ -irradiation methods and chain growth of P• begins by addition of initiator-derived radicals to monomers. During the process of reversible chain transfer, P• attacks CTA to yield R•, a fragmented product of the intermediate; then almost exclusively CTA-derived chains Pm• are
1.3.3.3. Applications of Reversible Addition-Fragmentation Chain Transfer
Polymerization
Using RAFT polymerization, homopolymers, block copolymers and branched polymers with narrow polydispersities have been easily prepared. Smulders and coworkers have copolymerized styrene and n-butyl acrylates using RAFT to produce well-defined core–shell nanostructures with controlled particle sizes and molecular weight distributions.111 Scales et al. have used RAFT to graft a series of nonionic, cationic, anionic and zwitterionic homo- and block copolymers to either planar gold surfaces or spherical gold particles in order to explore their potential applications to biosensing.148 In situ synthesis of protein−polymer conjugates via RAFT as an efficient method to generate well-defined, homogeneous protein−polymer conjugates in one step was reported.149,150 A model protein, bovine serum albumin (BSA)-macroRAFT agent was employed to control the polymerization of two different water soluble monomers, N-isopropylacrylamide (NIPAAm) and hydroxyethyl acrylate (HEA) in aqueous medium at room temperature. Li et al. prepared well-defined polymer brushes grafted onto silica nanoparticles by RAFT by the attachment of a versatile RAFT agent, 4-cyanopentanoic acid dithiobenzoate (CPDB) on amino-functionalized silica nanoparticles.151
poly(NAM/NAS) as a support for oligonucleotide (ODN) dT25/dA25 synthesis, which afforded a significant sensitivity improvement of the hybridization assay.152 Microarray slides grafted with block copolymer brushes of N,N-dimethylacrylamide (DMA) and glycidyl methacrylate (GMA), poly(DMA-b-GMA) were prepared by RAFT to be used as a substrate for high oligonucleotide hybridization.153 Thermo-responsive biosensor platforms based on poly(N-isopropylacrylamide) (poly(NIPA)) synthesized by RAFT significantly increased hybridization efficiency at low temperatures.154
1.3.3.4. Perspective of Reversible Addition-Fragmentation Chain Transfer
Polymerization
RAFT polymerization has been the technique of choice to synthesize polymers of low polydispersities and complex architecture based on several advantages: (1) monomer variety, (2) solvent variety, (3) temperature variety, (4) various functionalities available in RAFT reagent, and (5) experiment practicable under bulk/solution/emulsion/suspension conditions. By adapting RAFT in amplification-by-polymerization sensing scheme, it is expected to improve the reaction rate with more efficient polymer growth and reduce background noise by eliminating the use of metallic catalysts.
1.4. Outline of Dissertation
Chapter 2 described the proof-of-concept experiments of RAFT polymerization-based DNA detection method. In particular, surface-initiated polymer growth was regulated by the immobilization of chain transfer agents on the Au surface where DNA hybridization occurred. A linear polymer growth was observed as a function of the reaction time, characteristic of “living” polymer reactions. Significant improvement in assay sensitivity was realized in comparison to the previously reported polymerization-based sensing method by enhancing polymer growth rate and reducing background noises caused by nonspecific adsorption. Direct visualization of fewer than 2,000 copies of a short oligonucleotide sequence was demonstrated in a detector-free fashion.
highly charged DNA backbones and purine/pyrimidine moieties surrounding the reaction sites.
Chapter 4 describes the possible mechanism of DNA-accelerated RAFT polymerization on surface. A DNA templating theory was discussed to address the observed accelerated surface-initiated RAFT polymerization atop DNA molecules. Specifically, it was argued that the ordered monomer assembly on DNA template was possibly achievable on the basis of hydrogen bonding between the DNA template and free monomers, which aligned the monomers along the DNA strand thus increased the reaction rate. This DNA templating effect was found to be tunable by adjusting ionic strength, pH value and the polarity of the solution. Low ionic strength, neutral pH value and high polarity were preferred reaction conditions due to high templating efficiency of DNA strand. At the same time, the chemical structures of monomers and DNA templates, such as negative-charged monomers and DNA with different sequence length and base, also have an important impact on DNA-templated polymerization. The comparison of DNA-accelerated radical polymerizations in RAFT and ATRP showed a different acceleration degree as a result of the “zip” mechanism for ATRP and the “pick-up” mechanism for RAFT.
chain transfer agents (CTA) into the gel via preconjugation to the probes. Surface-initiated polymer growth was prompted on the gel surface and the film growth at where DNA hybridization occurred was monitored using infrared spectroscopy and atomic force microscopy. Visible change in the texture of the porous gel occurred after polymer growth, which offered an attractive detection alternative for in-gel DNA analysis. Compared to the results from traditional ethidium bromide staining, better detection sensitivity and specificity was achieved.
Scheme 1.1. Mechanism of RAFT Polymerization.
Initation
Initiator I. M M Pn.
Reversible chain transfer
Pn.
M kp
+ S
Z
S R kadd
k-add
Pn S
Z
S R
. kB
k-B
Pn S
Z S
+ R.
Reinitiation
R. M
ki R M
. M M P
m.
Chain equilibration
Pm.
M kp
+ S
Z
S Pn S
Z
S Pn S
Z S+
. Pn.
M kp
Termination
Pn. + Pm.
kt Dead polymer
Table 1.1. Summary of DNA Biosensing Methods.
Method Sub-Method Reference
Electrochemical DNA Biosensor
Label-Based Detection 21-29 Label-Free Detection 31-34
Optical DNA Biosensor
Fluorescence Detection 37-41 Surface Plasmon Resonance-Based
Detection 42-43
Chemiluminescence Detection 45-46 Surface-Enhanced Raman
Scattering Spectroscopy-Based
Detection 47-48
Combinatorial DNA Biosensor
Nanoparticle-Based Detection 51-58 Carbon Nanotube-Based Detection 72-73 Quantum Dot-Based Detection 84-85 Optical Fibers Detection 86-87
Polymer-Based DNA Biosensor
Electropolymerization 100-106 Conventional Free Radical
Polymerization 107
Controlled/“Living” Radical
Polymerization 108-111
Other Polymerizations 118-124
Amplification-by-Polymerization in DNA Biosensing
Atom Transfer Radical
Polymerization 131-136
Photo-polymerization 137-140 Reversible Addition-Fragmentation
Chain Transfer Polymerization
REFERENCES
(1) http://www.lsbu.ac.uk/biology/enztech/biosensors.html
(2) Clark, L. C.; Lyons, J. R.; Lyons, C. Ann. N. Y. Acad. Sci.1962, 102, 29-45.
(3) http://www.epa.gov/heasd/edrb/biochem/intro.html
(4) Anjum, V.; Pundir, C. S. Sensors and Transducers2007, 76, 937-944.
(5) Ivniski, D.; Hamid, I. A.; Atanasov, P.; Wilkins, E. Biosens. Bioelectron. 1999, 14,
559-624.
(6) Berney, H.; West, J.; Haefele, E.; Alderman, J.; Lane, W.; Collins, J. K. Sens. Actuators B2000, 68, 100-108.
(7) Wu, Z.-S.; Jiang, J.-H.; Fu, L.; Shen, G.-L.; Yu, R.-Q. Anal. Biochem.2006, 353,
22-29.
(8) Yeh, H.-C.; Ho, Y.-P.; Wang, T.-H. Nanomed.: Nanotechnol., Biol. Med. 2005, 1,
115-121.
(9) Cao, C.; Huang, Z.-L.; Liu, T.-C.; Wang, H.-Q.; Zhu, X.-X.; Wang, Z.; Zhao, Y.-D.; Liu, M.-X.; Luo, Q.-M. Anal. Biochem.2006, 351, 193-200.
(10) Laitala, V.; Ylikoski, A.; Raussi, H.-M.; Ollikka, P.; Hemmilä, I. Anal. Biochem.
2007, 361, 126-131.
(11) Wang, J.; Liu, G.; Merkoçi, A. J. Am. Chem. Soc.2003, 125, 3214-3215.
(12) Castaneda, M. T.; Merkoçi, A.; Pumera, M.; Alegret, S. Biosens. Bioelectron. 2007,
22, 1961-1967.
(13) Thevenot, D. R.; Toth, K.; Durst, R. A.; Wilson, G. S. Biosens. Bioelectron.2001, 16,
(14) Durst, R. A.; Baumner, A. J.; Murray, R. W.; Buck, R. P.; Andrieux, C. P. Pure Appl. Chem.1997, 69, 1317-1323.
(15) Turner, A. P.; Karube, I.; Wilson, G. Biosensors: fundamentals and applications. Oxford Science Publication, Oxford, 1986.
(16) Wang, J. J. Pharm. Biomed. Anal.1999, 19, 53-74.
(17) Chrisey, L. A.; Lee, G. U.; Ferrall, C. E. O. Nucleic Acids Res.1996, 24, 3031-3039.
(18) Wang, J. Nucleic Acid. Res.2000, 28, 3011-3016.
(19) Prabhakar, N.; Arora, K.; Singh, S. P.; Singh, H.; Malhotra, B. D. Anal. Biochem.
2007, 366, 71-79.
(20) Arora, K.; Prabhakar, N.; Chand, S.; Malhotra, B. D. Anal. Chem. 2007, 79,
6152-6158.
(21) de Lumley-Woodyear, T.; Campbell, C.; Heller, A. J. Am. Chem. Soc. 1996, 118,
5504-5508.
(22) Patolsky, F.; Lichtenstein, A.; Willner, I. Nat. Biotechnol.2001, 19, 253-257.
(23) Alfonta, L.; Singh, A. K. Anal. Chem.2001, 73, 91-102.
(24) Azek, F.; Grossiord, C.; Joannes, M.; Limoges, B.; Brossier, P. Anal. Biochem. 2000,
284, 107-113.
(25) Domínguez, E.; Rincón, O.; Narváez, A. Anal. Chem.2004, 76, 3132-3138.
(26) Liu, S. H.; Ye, J. N.; He, P. G.; Fang, Y. H. Anal. Chim. Acta1996, 335, 239-243.
(27) Teh, H. F.; Gong, H. Q.; Dong, X. D.; Zeng, X. T.; Tan, A. L. K.; Yang, X. H.; Tan, S. N. Anal. Chim. Acta2005, 551, 23-29.
(29) Takenaka, S.; Yamashita, K.; Takagi, M.; Uto, Y.; Kondo, H. Anal. Chem. 2000, 72,
1334-1341.
(30) Lucarelli, F.; Tombelli, S.; Minunni, M.; Marrazza, G. Anal. Chim. Acta 2008, 609,
139-159.
(31) Palecek, E. Nature1960, 188, 656-657.
(32) Wang, J.; Kawde, A.-N. Anal. Chim. Acta2001, 431, 219-224.
(33) Souteyrand, E.; Cloarec, J. P.; Martin, J. R.; Wilson, C.; Lawrence, I.; Mikkelsen, S.; Lawrence, M. F. J. Phys. Chem. B1997, 101, 2980-2985.
(34) Singhal P.; Kuhr, W. G. Anal. Chem.1997, 69, 4828-4832.
(35) Kerman, K.; Kobayashi, M.; Tamiya, E. Meas. Sci. Technol.2004, 15, R1-R11.
(36) Piunno, P. A. E.; Krull, U. J.; Hudson, R. H. E.; Damha, M. J.; Cohen, H. Anal. Chim. Acta1994, 288, 205-214.
(37) Demchenko, A. P. Trends Biotechnol.2005, 23, 456-460.
(38) Wolfbeis, O. S. J. Mater. Chem.2005, 15, 2657-2669.
(39) Demchenko, A. P. Anal. Biochem.2005, 343, 1-22.
(40) Healey, B. G.; Matson, R. S.; Walt, D. R. Anal. Biochem.1997, 251, 270-279.
(41) Strohsahl, C. M.; Du, H.; Miller, B. L.; Krauss, T. D. Talanta2005, 67, 479-485.
(42) Spadavecchia, J.; Manera, M. G.; Quaranta, F.; Siciliano, P.; Rella, R. Biosens. Bioelectron.2005, 21, 894-900.
(43) Jiang, T. S.; Minunni, M.; Wilson, P.; Zhang, J.; Turner, A. P. F.; Mascini, M. Biosens. Bioelectron.2005, 20, 1939-1945.
(45) Albrecht, H. O. Z. Phys. Chem.1928, 136, 321-330.
(46) http://www.appliedbiosystems.com
(47) Vo-Dinh, T.; Houck, K.; Stokes, D. Anal. Chem.1994, 66, 3379-3383.
(48) Allain, L. R.; Vo-Dinh, T. Anal. Chim. Acta2002, 469, 149-154.
(49) Niemeyer, C. M. Angew. Chem. Int. Ed.2001, 40, 4128-4158.
(50) Curri, M. L.; Agostiano, A.; Leo, G.; Mallardi, A.; Cosma, P.; Della, M. M. Mater. Sci. Eng. C, Biomim. Mater. Sens. Syst.2002, 22, 449-452.
(51) Mirkin, C. A.; Letsinger, R. L.; Mucic, R. C.; Storhoff, J. J. Nature1996, 382,
607-609.
(52) Elghanian, R.; Storhoff, J. J.; Mucic, R. C.; Letsinger, R. L.; Mirkin, C. A. Science
1997, 277, 1078-1081.
(53) Nam, J.-M.; Stoeva, S. I.; Mirkin, C. A. J. Am. Chem. Soc. 2004, 126, 5932-5933.
(54) He, L.; Musick, M. D.; Nicewarner, S. R.; Salinas, F. G.; Benkovic, S. J.; Natan, M. J.; Keating, C. D. J. Am. Chem. Soc.2000, 122, 9071-9077.
(55) Weizmann, Y.; Patolsky, F.; Willner, I. Analyst2001, 126, 1502-1504.
(56) Cao, Y. C.; Jin, R.; Mirkin, C. A. Science2002, 297, 1536-1540.
(57) Graham, D. L.; Ferreira, H. A.; Freitas, P. P. Trends Biotechnol.2004, 22, 455-462.
(58) Mulvaney, S. P.; Cole, C. L.; Kniller, M. D.; Malito, M.; Tamanaha, C. R.; Rife, J. C.; Stanton, M. W.; Whitman, L. J. Biosens. Bioelectron.2007, 23, 191-200.
(59) Iijima, S.; Ichihashi, T. Nature1993, 363, 603-605.
(60) Avouris, P. Acc. Chem. Res.2002, 35, 1026-1034.