Transactions of the 17th International Conference on Structural Mechanics in Reactor Technology (SMiRT 17)
Prague, Czech Republic, August 17 –22, 2003
Paper # C05-5
Severe Core Damage Experiments and Analysis for CANDU Applications
P.M. Mathew 1), A.J. White1), V.G. Snell2) and M. Bonechi2)
1) Atomic Energy of Canada Ltd., Chalk River Laboratories, Chalk River, Ontario Canada, K0J 1J0
2) Atomic Energy of Canada Ltd., Sheridan Park Research Community, 2251 Speakman Drive, Mississauga, Ontario, Canada, L5K 1B2
ABSTRACT
AECL uses the MAAP CANDU code to calculate the progression of a severe core damage accident in a CANDU reactor to support Level 2 Probabilistic Safety Assessment and Severe Accident Management activities. Experimental data are required to ensure that the core damage models used in MAAP CANDU code are adequate. In SMiRT 16, details of single channel experiments were presented to elucidate the mechanisms of core debris formation. This paper presents the progress made in severe core damage experiments since then using single channels in an inert atmosphere and results of the model development work to support the experiments.
The core disassembly experiments are conducted with one-fifth scale channels made of Zr-2.5wt%Nb containing twelve simulated fuel bundles in an inert atmosphere. The reference fuel channel geometry consists of a pressure tube-calandria tube composite, with the pressure tube ballooned into circumferential contact with the tube-calandria tube. Experimental results from single channel tests showed the development of time-dependent sag when the reference channel temperature exceeded 8500C. The test results also showed significant strain localization in the gap at the bundle junctions
along the bottom side of the channel, thus suggesting creep to be the main deformation mechanism for debris formation. An ABAQUS finite element model using two-dimensional beam elements with circular cross-section was developed to explain the experimental findings. A comparison of the calculated central sag (at mid-span), the axial displacement at the free end of the channel and the post-test sag profile showed good agreement with the experiments, when strain localization was included in the model, suggesting such a simple modelling approach would be adequate to explain the test findings.
The results of the tests are important not only in the context of the validation of the analytical tools and models adopted by AECL for the severe accident analysis of CANDU reactors but also for the overall confirmation of the slow nature of core disassembly progression in CANDU under severe core damage accident conditions.
INTRODUCTION
The core of the CANada Deuterium Uranium (CANDU®) power reactor is comprised of several hundred horizontal fuel channels in a large cylindrical calandria vessel. The calandria vessel is surrounded by a shield tank with a large volume of light water. Each fuel channel consists of (i) an internal pressure tube, containing the fuel and the hot, pressurized heavy or light water primary coolant, and (ii) an external calandria tube separated from the pressure tube by an insulating gas-filled annulus. The calandria vessel contains cool low-pressure heavy-water moderator that surrounds each fuel channel. The primary coolant is distributed amongst the fuel channels by common headers and individual feeder pipes. The fuel can be natural or slightly enriched UO2 fuel in bundles about 0.5m long. The fuel bundles are replaced on-power by fuelling
machines at both ends of the core.
In a CANDU reactor, each safety function is performed by two independent means. For reactor shutdown, in addition to the control system, two independent shutdown systems can shut the plant down for any design basis or severe-accident. For accidents with the reactor coolant pressure boundary intact, the decay heat is removed by the steam generator heat sink or a dedicated decay heat removal system [1]. For loss-of-coolant accidents, the decay heat is removed by the Emergency Core Cooling System. Even in the unlikely failure of the decay heat removal systems, the moderator system will prevent gross damage to the fuel and maintain fuel channel integrity. In the unlikely event that the moderator cooling also fails (“Severe Core Damage Accidents”), the fuel channels would sag and collapse as the moderator boils off; but the core debris would still be contained within the calandria vessel as long as it remains cooled on the outside by the shield-tank water. Only should the shield tank water boil off would the calandria vessel fail, which will take a long time, typically more than 24 hours. This long delay in the failure of the calandria vessel allows time to implement Severe Accident Management procedures to arrest the progression of the accident.
progression and consequences of a postulated severe core damage accident. Many of the failure criteria currently used in the code, which are generic to both PWR and CANDU, are supported by experiments. Severe accident experiments, specific to the CANDU geometry are conducted at AECL to generate data necessary for model development and validation. The CANDU core disassembly experiments and analysis, described in this paper, address the behaviour of CANDU channels during moderator boil-off, when the channels are expected to sag under heat-up and form debris [3]. A sagging channel eventually contacts the lower channel and if the lower channel is also uncovered it is expected to sag under its own weight as well as that of the supported channel. This process would continue, as more channels are uncovered. As sagging increases, it is expected that the channel segments separate near the bundle junctions. A suspended debris bed is thus formed, which moves downward with the falling moderator level. The submerged channels will be able to support a finite number of channels after which they are also expected to fail. The loading on the submerged channels increases with the accumulation of debris from top channels, thereby leading to progressive failure of the lower channels and ultimately resulting in the collapse of the core into the moderator pool in the bottom of the calandria. In a first step to understand the core disassembly phenomenon, single channel disassembly tests were conducted in an inert atmosphere to study channel deformation, failure and disassembly mechanisms. Some of the experimental results were reported in SMiRT16 [4]. Since then, additional tests were conducted. This paper focuses on a numerical model, which was developed to explain the single channel test findings. Relevant experimental details, the numerical model and the results of two tests, which were used to verify the numerical model, are reported in this paper.
TEST CHANNEL GEOMETRY
For the experiments, the full-size channel was scaled down to a one-fifth linear scale by using a scaling analysis based on geometric and stress-level similarity [4]. The geometry of the fuel channel considered in this study is a pressure tube-calandria tube composite, with the pressure tube ballooned into circumferential contact with the tube-calandria tube as would be expected in the early stages of a severe core damage sequence. For the small-scale channel the pressure tube material Zirconium-2.5 wt% Niobium (Zr-2.5Nb) was chosen, because the pressure tube is thicker than the calandria tube, which is made of Zircaloy-2. The stress, temperature distributions and end-restraints were replicated in the experiments. The tests were conducted in an inert atmosphere to understand the deformation and failure mechanisms of a single channel; the effect of oxidation will be addressed in separate tests. Twelve tungsten heaters inside the test channel represented the twelve bundles in a typical CANDU 6 channel.
EXPERIMENTAL FACILITY
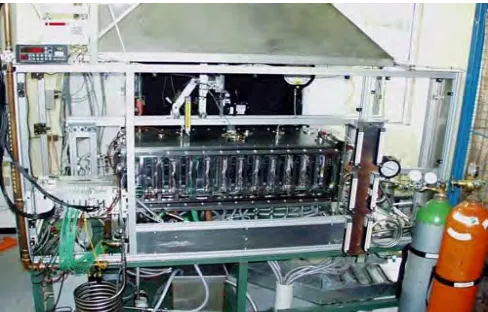
To study the disassembly behaviour of a CANDU core using small-scale channels a facility called the “Core Disassembly Test Facility (CDF)” was designed and built. Figure 1 shows a view of the heart of the facility, the test chamber, where the tests are conducted in an inert gas atmosphere.
The maximum channel length within the end supports is 1200 mm. One end of the channel is completely fixed against any movement, and the other end, the “floating end”, is allowed to move horizontally, but not rotate as in the reactor. As the channel temperature increases the floating end moves inward as a result of increasing sag with temperature. To measure the horizontal movement of the channel a linear variable displacement transducer is positioned at the floating end. Further, a restraining plate is installed at the floating end, which stops the channel from further inward movement beyond the original position as in the reactor. The typical maximum channel temperature during a test is about 14000C. Several
Pt-PtRh Type R thermocouples, spot-welded to the sheath along the top and bottom sides of the channel at different locations, measure the channel temperatures. A maximum of ten centre heaters inside the channel are powered during a test. Various test data such as temperature, sag at channel’s mid-point, channel horizontal displacement and channel power could be monitored using the LABVIEW software.
EXPERIMENTAL PROCEDURE
In a typical test, the temperature of the channel is at first increased to the range of reactor operating temperature (~3000C) and then held there until thermal equilibrium is reached. The power is then increased so that the channel reaches a
maximum temperature in the range 1300 to 14000C. The heat-up rate up to the maximum test temperature was varied in the
different tests, in the range 0.1 to 1.20C/s. This range covers the expected heat-up rate of fuel channels when uncovered by
the moderator. The channel was held at the maximum temperature for holding times in the range 600 to 5500 s. Tests were conducted with power supplied to either four or ten of the central heaters. In addition to monitoring the various test data and videotaping, post-test examination of the channel was conducted in which the axial sag profile, any change to original diameter and wall-thickness along the top and bottom at various locations were measured. The channel was also radiographed to determine the post-test location of the heaters. The localized axial strain at the bundle junctions along the bottom side was determined from the radiographs and the final bundle imprints at the bundle junctions.
TEST RESULTS
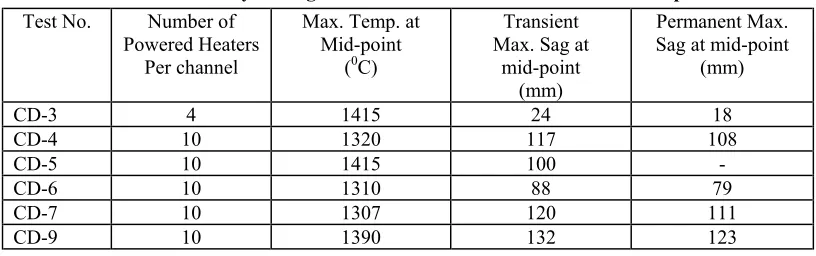
Six tests were conducted with a single channel in an inert atmosphere, where the channel was allowed to sag freely. A summary of the major parameters and results are summarized in Table 1. General examination of the results showed that no significant sag was observed until the channel bottom temperature reached 8500C. Two tests (CD-7 and CD-9) were
selected from Table 1 for the model development and verification, because they provided sufficient experimental data.
Table 1 Summary of Single Channel Test Results in an Inert Atmosphere
Test No. Number of Powered Heaters
Per channel
Max. Temp. at Mid-point
(0C)
Transient Max. Sag at
mid-point (mm)
Permanent Max. Sag at mid-point
(mm)
CD-3 4 1415 24 18
CD-4 10 1320 117 108
CD-5 10 1415 100
-CD-6 10 1310 88 79
CD-7 10 1307 120 111
CD-9 10 1390 132 123
MODEL DEVELOPMENT
A finite element model was developed to explain the experimental findings. The ABAQUS [5] finite element program was used for the modelling because it allows the solution of thermal-mechanical problems involving highly non-linear deformations such as the significant creep sag observed in the experiments. It also allows the implementation of custom creep-equations via standard programming language such as FORTRAN.
Model Description
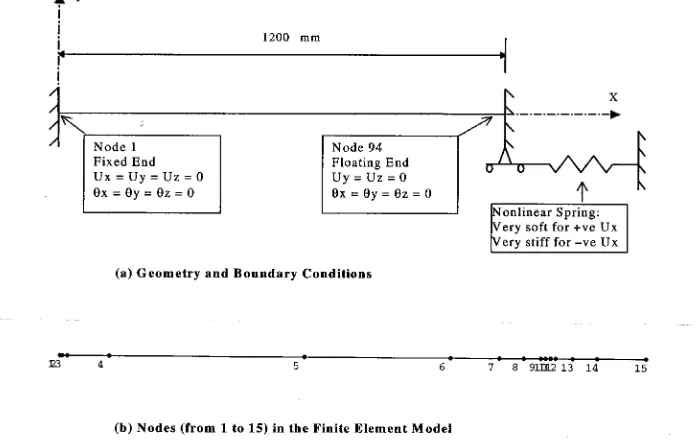
beam elements and 94 nodes (see Figure 2 (a)). A partial plot of the ABAQUS model (from nodes 1 to 15) is illustrated in Figure 2 (b), which shows details of the element sizes used in the analysis. The gap element size (distance between the heaters) is 1 mm (e.g. between nodes 10 and 11 in Figure 2(b)). The lengths of the neighboring element to the left, representing the first heater, are 1.0, 3.5, 5.0, 10.0, 30.0, 40, 8.5 and 1.0 mm. This variation is intended to simulate the stress/strain concentration observed in the gaps between the heaters. Because of the large span-to-diameter ratio, the overall sag behaviour of the channel is modelled using beam elements. A pipe cross-section is used with 25 mm outer diameter and 0.5 mm wall thickness.
Fig. 2 A Schematic of the ABAQUS Analysis Model
As in the test channel, one end (fixed end at Node 1) is restrained against displacements and rotations in all directions. The other end (the floating end at Node 94) is similarly restrained in all directions except for the axial (Ux) direction where it is allowed to move freely in the X-direction but is restrained to move back beyond the original location. Node 94 is attached to a non-linear spring to allow for free thermal expansion in the positive X-direction and to restrain axial retraction beyond the initial location. The nonlinear spring has a very small stiffness (10N/mm) in the positive direction and a relatively high stiffness in the negative direction (2.2x10⁶ N/mm) where the zero displacement point corresponds to the
initial location of the floating end. A spring pre-tension force of 10 N is applied in the model to correspond to the test condition. The convergence of the finite element model was verified by using different numbers of nodes in the model. The end result of these verification runs showed that a model made of 93 beam elements and five integration points across the depth gave converging results and was therefore considered adequate for this study.
Preliminary analyses using the ABAQUS model showed that the behaviour of the channel under the test conditions is controlled by highly nonlinear behaviour of the material because of the high creep strain rates and the ensuing large displacements, which leads to geometrical nonlinearity as the floating end expands and retracts. The nonlinear problem is solved incrementally by ABAQUS, whereas the governing equations are linearized and solved for a small increment in time to ensure that calculated forces and displacements do not exceed preset tolerance levels. The program automatically chooses the time step based on the convergence rate of the solution parameters. Due to the high creep strains in these experiments many iterations are needed to obtain a convergent solution.
Material Properties and Input Data for Model
The mechanical properties of the channel material Zr-2.5Nb as a function of temperature are required for the modelling. The modulus of elasticity as a function of temperature was taken from Reference 6. Since the coefficient of thermal expansion of Zr-2.5Nb for the temperatures up to 15000C was not available, the Zircaloy-4 data from Reference 7 were
The creep rate (
ε
&
) in the longitudinal direction is given by:2.4 10
2
26670
8 10 exp K
T ε ε σ σ = × − − & (1
where
ε
&
= longitudinal creep rate [1/s], T= Temperature [K],σ
= longitudinal stress [MPa] and K2 = a temperature dependent constant [8]. The constant K2 was originally derived for the α−β phase transformation temperature range from 800 to 9000C. For temperatures below 8000C, K2 = 0.0119 and above 9000C, K2 = 0.0100 were assumed in the currentanalysis. Equation (1) was used to account for the creep in the entire temperature range, and for all locations except for the 1 mm gap elements. Another creep equation was used in the gap for temperatures higher than 8500C as discussed below.
The data available for the longitudinal strain in Equation (1) are limited to relatively low stresses [8]. The post-test destructive channel examinations revealed significant wall thinning at the bundle junctions [4], suggesting accelerated creep and high stress concentration in the gap region between the heaters. To account for the observed stress localization at the bundle junctions, Equation (1) was restricted for up to 8500C only in the gap, and the creep rate Equation (2) for Zr-2.5Nb
in the transverse direction [9] was used for higher temperatures in the gap region, since the β-phase is stable at high temperature and creep rates in the longitudinal and transverse directions are expected to be similar.
(
)
2 4 1.4 3.4 3.72 19600 3.5 10 exp19600 10.4 exp
19600
1 274 expt 1105
t
T
T T dt
T σ ε σ × − = − + + − −
∫
& (2)where t2 is the time when 850°C is reached. Since the second term in Equation (2) diminishes quickly after a short time, only the first term was applied in the gap region.
Modelling the mechanical interaction between the heaters and the softening tube wall is complicated; therefore, a simpler approach was adopted by multiplying the creep rate in Equation (2) by a constant factor to magnify the effect of stress concentration in the gap region. This stress intensity factor was obtained by matching the measured transient sag of CD-9 with the calculated results. The same factor was applied to calculate also all the independently measured test data of CD-9 and CD-7. Good agreement was obtained for all the measurements of both tests, which demonstrated that such a simple approach adequately models the complicated mechanical interaction.
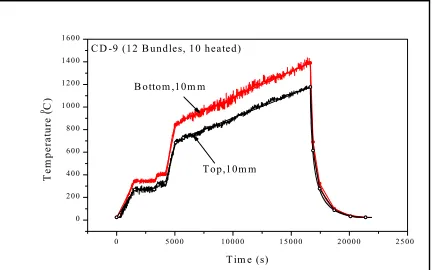
The experimental results also showed that the channel cross-section deformed to take an oval shape by conforming to the lower half diameter of the heater, suggesting that the temperature of the bottom half of the channel reached temperatures closer to the measured bottom temperatures. Therefore, a trapezoidal temperature distribution around the channel circumference was used in the modelling such that the input temperature at halfway between the top and bottom of the channel is equal to the bottom temperature. An example of the measured top, and bottom temperatures, at 10 mm from the channel midpoint from the tests CD-7 and CD-9 are shown in Figures 3 and 4. The temperature-time curves were linearized and were input for the calculations. The input data are shown in Figures 3 and 4 as open circles.
0 5000 10000 15000 20000 2500
0 200 400 600 800 1000 1200 1400 1600
C D -9 (12 B undles, 10 heated)
T op,10m m B ottom ,10m m
T em p er at u re ( 0C)
T im e (s)
Fig. 4 Measured Channel Temperature at 10 mm away from the mid-point from test CD-9 Fig. 3 Measured Channel Temperature at 10
mm away from the mid-point from test CD-7
-2 0 0 0 0 2 0 0 0 4 0 0 0 6 0 0 0 8 0 0 0 1 0 0 0 0 1 2 0 0 0 1 4 0 0 0 0
2 0 0 4 0 0 6 0 0 8 0 0 1 0 0 0 1 2 0 0 1 4 0 0
T o p ,1 0 m m B o tto m ,1 0 m m
C D -7 ( 1 2 B u n d le s , 1 0 h e a te d )
T e m p er a tu re ( 0C)
RESULTS AND DISCUSSION
Test CD-9 with an almost linear heatup rate from 8400C was chosen as the base case for modelling. Then the
modelling technique with the same stress concentration factor was then applied to the test CD-7.
Test CD-9
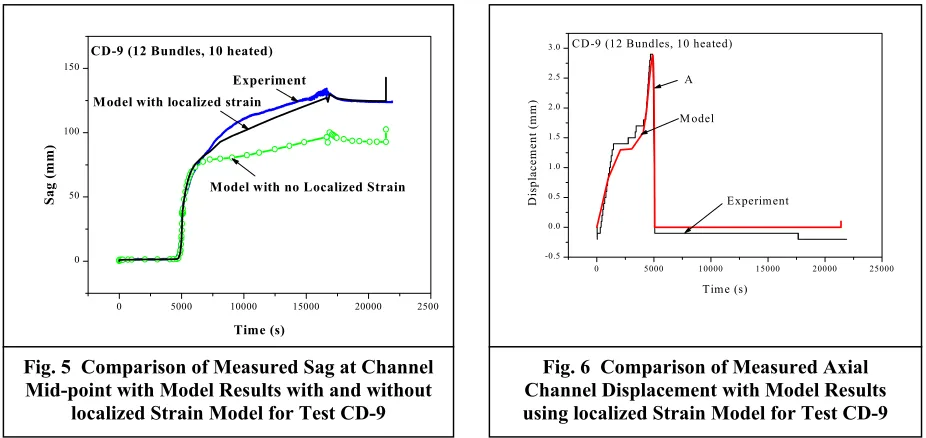
As discussed, the linearized top and bottom channel temperatures from the test were used as input data in the ABAQUS model. Calculations were performed without considering accelerated creep at the bundle junctions for test CD-9. The calculated sag curve is plotted as a function of time in Figure 5. Figure 5 shows that, while the pattern of the curve agrees with the experimental plot, the magnitude of the sag is lower than the measured sag by about 25% at
the end of heatup at 16,650 s. Good agreement is observed between the calculated curve and the experimental results, if accelerated creep at the bundle junctions is accounted for by applying a constant factor of 200 on the creep rate in Equation (2) and applied only at the 1.0 mm gap at the bundle junctions. It can be seen from Equation (2), that this factor corresponds to a small factor of about 4.75 on the stress to represent the stress concentration in the gap region, which causes the strain. This case is plotted in Figure 5, which shows that the sag curve is only about 2% lower than the experimental result at 16,650 s. The overall characteristics of the sag curve agree reasonably well with the experimental results, especially in predicting the rapid increase of sag at 5000 s when the temperatures exceed about 8500C.
-2 0 0 0 0 2 0 0 0 4 0 0 0 6 0 0 0 8 0 0 0 1 0 0 0 0 1 2 0 0 0 1 4 0 0 0 0
2 0 4 0 6 0 8 0 1 0 0 1 2 0 1 4 0
M o d e l
E x p e rim e n t C D -7 (1 2 H e a te rs, 1 0 h e a te d )
S
a
g
(
mm)
T im e (s )
0 5000 10000 15000 20000 2500
0 50 100 150
Model with no Localized Strain Model with localized strain
Experiment CD-9 (12 Bundles, 10 heated)
Sag
(m
m
)
Time (s)
0 5000 10000 15000 20000 25000
-0.5 0.0 0.5 1.0 1.5 2.0 2.5 3.0 M odel Experiment CD-9 (12 Bundles, 10 heated)
A Di sp la ce me n t (mm ) Time (s)
Fig. 6 Comparison of Measured Axial Channel Displacement with Model Results using localized Strain Model for Test CD-9 Fig. 5 Comparison of Measured Sag at Channel
Mid-point with Model Results with and without localized Strain Model for Test CD-9
Fig. 7 Comparison of Measured Post-Test Permanent Sag with Model Results using
localized Strain Model for Test CD-9
Fig. 8 Comparison of Measured Sag at Channel Mid-point with Model Results with localized
Strain Model for Test CD-7
0 20 0 40 0 60 0 80 0 10 0 0 12 0 0 -16 0 -14 0 -12 0 -10 0 -80 -60 -40 -20 0 20
E x p erim en t M o d el
C D -9 (1 2 B u nd les, 1 0 h eated )
P o st -T es t P er m an en t S ag ( m m )
The cusp in the curve at the beginning of cooling (at 16,764 s) observed in the experiment is also well predicted by the model. This cusp is caused by alpha-to-beta phase transformation of Zr-2.5Nb. During this temperature range, the thermal expansion coefficient goes through a maximum and a minimum, which is reflected in the sag curve. The sudden jump in the calculated sag curve at the end of the experiment (at about 21,400 s) is obtained when the end restraints, i.e., rotational and axial restraints at the two ends, are released to represent the post-test condition, when the channel is removed from the test chamber for sag profile measurements. Since good agreement was obtained for the post-sag data as well, the same stress intensity factor of 4.75 was used to calculate the remaining parameters, such as horizontal displacement, post-test permanent sag and permanent strain in the gap. The measured horizontal displacement of the free-end of the channel for CD-9 is compared with calculated in Figure 6, which shows good agreement between the two. The displacement curve in Figure 6 shows, that at about 5000 s (point “A”), the floating end reverses direction because of the increased sag caused by creep.
The calculated post-test permanent sag for CD-9 is compared with the measurements in Figure 7. The permanent sag is calculated by releasing the rotations and the axial degrees of freedom at the channel ends to simulate the removal of the channel from the test chamber and the relaxation of its two ends. Good agreement between the model and the experiment is obtained. The comparison also shows that the calculated sag is slightly larger than the measured at the channel mid-point. The observed difference is attributed to the post-test observation that the channel cross-section had deformed to take an oval shape during the test. The sag measurements are made by focusing the Laser at the top surface of the channel at the channel mid-point. Therefore, any oval deformation of the cross-section of the channel will appear as if the channel sag was smaller, when compared to the model, because the model does not account for the oval deformation of the channel cross-section.
Test CD-7
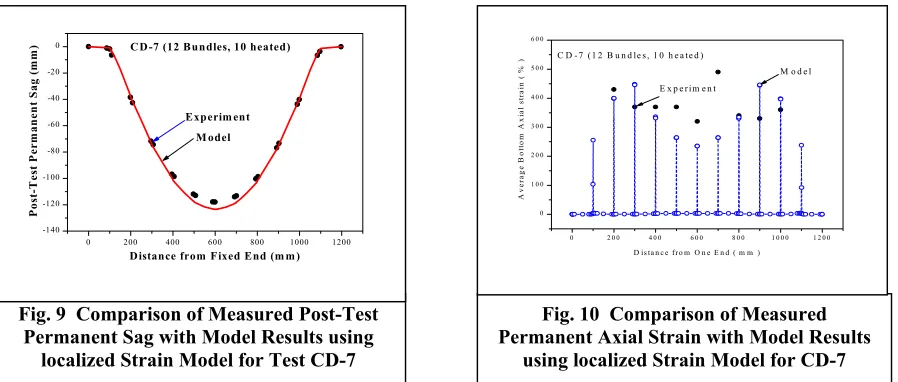
The same finite element model was used to simulate Test CD-7 after implementing the corresponding linearized temperature history. Figure 8 shows both the calculated and experimental sag as function of time. Also for this simulation the same stress intensity factor of 4.75 was used to account for the accelerated creep in the gap region. The calculated sag is only about 2% lower than the experimental sag at time 9,394 s. Once again, the overall characteristics of the sag curve agree reasonably well with the experimental results, especially in predicting the rapid increase of sag at 4000 s and the cusp in the curve at the beginning of cooling, at about 9,500s. Figure 9 shows for CD-7 good agreement between the model and the test for permanent sag. The calculated permanent axial creep strain along the bottom side of the channel is plotted in Figure 10 against distance from the fixed end as open circles, connected with a dotted line; the test results are shown as solid circles. The model correctly predicts the pattern of concentrated creep strain in the gap regions between the heaters. The observed high axial permanent strain reflects the experimentally observed wall thinning in the gap, suggesting that debris of different bundle lengths will be formed as a result of creep-sag deformation [4]. In general, the strain calculation is expected to be less accurate than displacement because it is a derivative of the displacement. While the magnitudes of the calculated strain do not compare well with the experiment, it is noted that the independent and primary variables in the model (i.e., sag and axial displacement) have good agreement.
Comparisons between the experimental and calculated results for the post-test permanent sag is shown in Figure 9. As in Test CD-9, the modelling results show a good agreement with the experimental results. Since the generalized
Fig. 9 Comparison of Measured Post-Test Permanent Sag with Model Results using
localized Strain Model for Test CD-7
Fig. 10 Comparison of Measured Permanent Axial Strain with Model Results
using localized Strain Model for CD-7
0 200 400 600 800 1000 1200
-140 -120 -100 -80 -60 -40 -20 0
M odel Experim ent CD-7 (12 Bundles, 10 heated)
P
o
st-T
es
t
P
erm
an
en
t
S
ag
(m
m
)
Distance from Fixed End (m m )
0 2 0 0 4 0 0 6 0 0 8 0 0 1 0 0 0 1 2 0 0
0 1 0 0 2 0 0 3 0 0 4 0 0 5 0 0 6 0 0
M o d e l E x p e r im e n t
C D - 7 ( 1 2 B u n d le s , 1 0 h e a te d )
A
v
e
rag
e
B
o
tt
o
m
A
x
ial
s
tr
ai
n
(
%
)
creeprate equation used here was also used to scale-down the full-size CANDU 6 channel to the size of the test channel while the same stress level was maintained in the test channel [4], the derived stress concentration factor in the gap region will be applicable to the full-size CANDU 6 channel.
CONCLUSIONS
The following conclusions can be drawn from the experiments and modelling studies presented in this paper:
• Significant sag driven by creep occurs only above 8500C. Creep deformation is a slow process indicating the
slow nature of the core damage progression in a CANDU.
• Significant strain localization observed at the bundle junctions along the bottom side of the channel suggest that debris is formed by accelerated creep in the gap region between the bundles.
• The ABAQUS beam element model developed here, which includes stress concentration in the gap region between the simulated bundles, is adequate to predict the deformation behaviour of the channel during the core disassembly experiments, in which the channel is subjected to high temperatures resulting in significant creep strains and localized deformations. Since the generalized creep rate equation used here was also used to scale-down the full-size CANDU 6 channel to the size of the test channel while the same stress level was maintained in the test channel, the derived stress concentration factor in the gap region should be applicable to the full-size CANDU 6 channel.
• The stress concentration observed in the gap region at the junctions between the simulated bundles is accounted for in the model by applying a magnification factor of 200 on the creep strain at the 1.0 mm gaps between the simulated bundles, which corresponds to a stress concentration factor of 4.75 in the gap region. • A comparison of the central sag (at mid-span) and post-test permanent sag shows good agreement between the
model and the experiments CD-7 and CD-9.
• The distribution of the permanent creep strain and the axial displacement at the free-end of the channel are also in good agreement with the experimental results.
• The test results are consistent with the slow nature of core disassembly progression in CANDU under severe core damage accident conditions.
ACKNOWLEDGEMENTS
The authors wish to thank Mr. P.A. Krueger for conducting the experiments and Dr. S. Baset for ABAQUS modelling.
REFERENCES
1. Snell, V.G., Bonechi, M. and Kupferschmidt, W.C.H.,”Advances in Nuclear Safety”, Proceedings of Pacific Basin Nuclear Conference, Seoul, Korea, October .29-Novemer 2, 2000.
2. Mathew, P.M., Kupferschmidt, W.C.H. and Bonechi, M., “Application of PSA to CANDU Design and Licensing”, Proceedings of the 13th Pacific Basin Nuclear Conference, Shenzhen, China, October 21-25, 2002.
3. Meneley, D.A., Blahnik, C., Rogers, J.T., Snell, V.G. and Nijhawan, S., “Coolability of Severely Degraded CANDU Cores”, International Seminar on Mass and Heat Transfer in Severe Reactor Accidents, Cesme, Turkey, May 22-26, 1995.
4. Mathew, P.M., Kupferschmidt, W.C.H., Snell, V.G. and Bonechi, B., “CANDU-Specific Severe Core Damage Accident Experiments in Support of Level 2 PSA”, Proceedings of 16th International Conference on Structural
Mechanics in Reactor Technology, SMiRT 16, Washington DC, August 12-17, 2001.
5. ABAQUS Program, HKS Inc., Version 5.7.3, 1998.
6. Rosinger, H.E., Ritchie, I.G. and Shillinglaw, A.J., “Young’s Modulus of Crystal Bar Zirconium and Zirconium Alloys [Zircaloy-2, Zircaloy-4, Zirconoum-2.5 wt% Niobium] to 1000 K, Atomic Energy of Canada Limited Report, AECL-5231, 1975.
7. Hohorst, J.K., ”SCDAP/RELAP5/MOD 2 Code Manual, Vol.4: MATPRO-A Library of Material Properties for Light Water Reactor Accident Analysis”, NUREG/CR-5273, 1990.
8. Shewfelt, R.S.W. and Lyall, L.W., “A High-Temperature Longitudinal Strain Rate Equation for Zr-2.5 wt% Nb Pressure Tubes”, Journal of Nuclear Materials, Vol. 132, (1985).