1
Application of Computational Fluid Dynamics in the
Construction Industry
Nikhil Sunil Raut
1, Abhishek Nana Salunkhe
2, Mahasidha R. Birajdar
3 1,2,3Department of Mechanical Engineering, TrinityCollege of Engineering and Research, Pune Email: [email protected], [email protected]
Abstract- The steady improvement in the speed of computers and the memory size since the 1950’s has led to
the emergence of computational fluid dynamics (CFD). It is a branch of fluid dynamics uses numerical methods such as the Navier-Stokes and allied equations to solve the fundamental nonlinear differential equations that describe fluid flow for predefined geometries and boundary conditions. The result is a wealth of predictions for flow velocity, temperature, density, and chemical concentrations for any region where flow occurs. In recent years field of CFD has grown tremendously over the past few decades. It is widely used in various engineering applications, especially in aircraft design; also its use in construction industry has been seen over the past few years. It has been a very helpful tool to solve the various flow related equations, which cannot be solved by using analytical methods. The main aim of CFD is to solve the basic flow related equations which describe the movements and other characteristics of the flow. In recent times, the techniques of CFD has been used almost in every industry where flow issues are to be solved, it has wide range of applications in Aerospace and Constructional Industry.
Index Terms- CFD simulation, ANSYS, GAMBIT, Naviers stokes Equations
1. INTRODUCTION
Computational fluid dynamics, usually abbreviated as CFD, is a branch of fluid mechanics that uses basic Navier-Stokes equations and algorithms to solve problems related with the flow of fluid. To perform this calculations computers are required to solve the problems related with the behavior of liquid and gases whose surfaces are defined by using boundary conditions.[5]
The behavior of any fluid flow is governed byusing three fundamental principles:-
1. Mass is conserved.
2. Newton’s second law (Force=Mass * Acceleration).
3. Conservation of energy.
These principles of behavior of fluid can be expressed by using basic mathematical equations, which are either integral equations or partial differential equations.
Computational fluid dynamics is usedin replacing the integral or the partial derivatives in these equations with discretized algebraic forms, which in turn are solved to obtain numbers for the flow field values at discrete points in time and/or space. The final equation obtained after solving these equations of CFD is in contrast to a closed-form analytical solution. However, in a long run the objective of most of engineering
analyses, closed form or otherwise is a quantitative description of the problem, i.e. numbers [1-3, 8-10]. Computational Fluid Dynamics (CFD) is thus the simulation of fluids engineering systems using modeling (mathematical physical problem formulation) and numerical methods (Discretization methods, solvers, numerical parameters, and grid generations, etc.).
2. Design Scheme of an Art Gallery in Guangzhou
Guangzhou is a semi-tropical coastal zone with sunlight available to a great extent and heat and long summer. The average temperature of the hottest month recorded is 28.7 degrees Celsius and the average relative humidity as high as 77% due to which the natural ventilation becomes important in architectural design of the gallery. The art gallery is part of the “Three Museums One Square” project in Guangzhou. The project site is located to the south of the Canton Tower, and in the core area of the southern part of Guangzhou’s new urban central axis. With an area of about 2.92 hectares and 80,000 sqm GFA, the gallery includes storage area, exhibition area, public service area, research & administrative office, mechanical area, basement car park and public spaces.[2]
2 the exchange and reception area, art workshop &
[image:2.595.76.284.209.430.2]interaction space, entrance/exit to research &administrative offices, ground level entrance/exit of collection storage, as well as service facilities like shops and cafes [2].
Figure No.1. Design option 1
[image:2.595.309.523.215.424.2]Option 1: As shown in Fig. 1, these design tends to divide the gallery building into two parts. All the sections except conference areas and the exchange and reception area at the southwest corner form an L-shaped block
Figure No. 2. Design option 2
Option 2: As shown in Fig. 2, option 2 is a modification of option 1 in which an east-west passage divides the l-shaped passage into two parts. This way,
the exhibition area, exhibition halls, shops and cafe and other service facilities are placed in the east-west block on the north, while the entrance/exit to research & administrative offices and the ground level entrance/exit to collection storage area are both located in the southeast blocks.
Figure No.3. Design option 3
Option 3: As shown in Fig. 3, part of the east-west passage in Option 2 is modified to be north- south. The functional layout remains unchanged, while the building massing and spatial forms are revised.
3. Wind Environment Simulation Technology and Outdoor Wind Environment Evaluation Criterion.
With the new development of computer technology and numerical computing technology, computational fluid dynamics (CFD) has made rapid progress thus coping up with them and other fields too. CFD technology involves mechanics of fluids, computing methods, computer graphics and many other disciplines. In CFD simulations, architectural design schemes are used to set up computer models, where the CFD software such as FLUENT and PHOENICS are used to simulate the surrounding and indoor wind environment of a building and to draw the simulation diagrams ofwind speed and wind pressure under natural ventilation, so that the architects could design the layouts of the buildings accordingly [6].
[image:2.595.74.291.505.713.2]3 pressure remains steady, wind pressure plays a more
[image:3.595.278.517.141.302.2]important role in the wind environment [2].
Table No.1 Different feeling levels of human body varying with wind speed
Wind speed range (m/s)
Human body feelings
<1.0 Breezeless
1.0 - 5.0 Comfortable
5.0 – 10.0 Uncomfortable with
movements affected
10.0 – 15.0 Very uncomfortable with movements greatly affected 15.0 – 20.0 Intolerable
>20.0 Dangerous
4. Analysis of CFD Simulation Results and Finalization of Design Option
When only the wind pressure isconsidered, PHOENICS is used to simulate and analyze the effects of natural ventilation in open-up spaces as shown in the three options above.
There are many mathematical models for simulating numerical flow fields surrounding a building, such as DNS, LES, RSM and K-ε two-equation turbulent model, among which, the K-ε model features cost effectiveness, small fluctuation and high precision and is consequently rather employed in many low-speed turbulent numerical simulations. The simulation results are shown in the figures below [2].
Figure No.4. Simulation results of outdoor wind environment at 1.5m above ground, Option 1
[image:3.595.307.528.386.579.2]As shown in Fig. 4, the wind speed in the art gallery in Option 1 is ranging below 1m/s leaving a few areas. The L-shaped building blocks gives anair convective in nature between east and west, creating a calm zone at Point 1 which results in a poor wind environment.
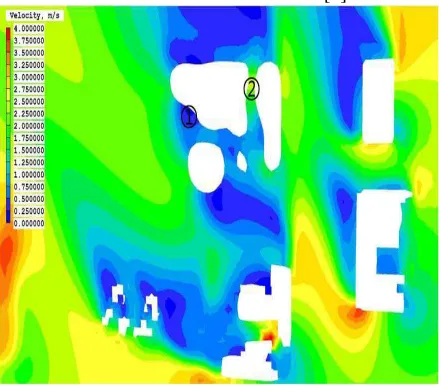
Figure No.5. Simulation results of outdoor wind environment at 1.5m above ground, Option 2
As shown in Fig. 5, the wind speed in Option 2 is within the range of 0-1.5m/s. The wind speed at Point 1 and Point 2 is below 1m/s and that at Point 3 is slightly higher than that and is around 1.5m/s. The whole wind environment is comfortable.[2]
Figure No.6. Simulation results of outdoor wind environment at 1.5m above ground, Option 3
[image:3.595.73.293.499.651.2]4 provides the most appropriate average speed, evenly
distributed wind fields and the smallest calm zone. As wind pressure plays a bigger role in wind environment, it is taken into consideration at stage 1 and the optimaloption for open-up spaces is finalized through PHOENICS simulations.
At stage 2, impact of the outdoor multi-levelatrium on thermal pressure ventilation in open-up spaces is taken into account, so as to provide basis for design ofthe outdoor atrium. Therefore, FLUENT is used to simulate and analyze the two outdoor wind environment scenarioswhere an outdoor multi-level atrium is or is not provided.[2]
[image:4.595.309.528.245.447.2]Simulation results are shown as below:
[image:4.595.74.291.308.499.2]Figure No. 7. Wind environment at section without atrium
Figure No. 8. Wind environment at section with atrium.
Comparison between Fig. 7 and Fig. 8 shows that the outdoor multi-level atrium makes a strong effect when the wind is at a speed of around 1.5m/s and has an upward direction. This is very favorable to indoor ventilation and exchange of fresh air. At the same time, with the atrium, the wind speed in the open-up spaces on ground level is higher and within a reasonable range compared to the scenario where there is no atrium [2].
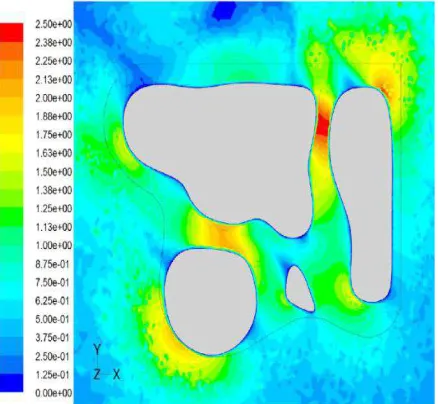
[image:4.595.72.292.335.730.2]Figure No. 9. Wind environment of art gallery at 1.5m above ground, without atrium.
Figure No. 10. Wind environment of art gallery at 1.5m above ground, with atrium
[image:4.595.307.527.486.721.2]5 there is and there is not an atrium. Comparisons
between the two figures show that at Point 1-4, the wind speed near ground is generally increased and is still within a comfortable range when the atrium is included. This is because the stack effect created by the atrium leads to a negative wind pressure value at the bottom of the multi-level atrium, which then results in a wind pressure difference and a higher wind speed in the open-up spaces on ground level. In doing so, the previously moderate wind environment is improved and indoor natural ventilation on ground level is better as well. The connection between the atrium and the open-up spaces and the connection between the atrium and the roof should be retained, which not only enrich building forms and spatial forms but also facilitate natural ventilation in open-up spaces on ground level for a more comfortable wind environment. When there is an atrium, the wind speed at Point 5 is relatively lower. However, the decrease is small and it only affects a small area. Moreover, Point 5 is on the perimeter of the project site of “Three Museums One Square”, thus, it has a slight impact on the activity venues within the project site [2].
5. CONCLUSION
In conclusion, CFD wind environment simulation results indicate that Option 3 that includes an outdoor multilevel atrium is the optimal design for the art gallery. With the art gallery as an example, thus it explains the methods to optimize the green building design where CFD outdoor wind environment simulations are conducted. In refining and detailing the building shape and floor plan, an architect needs to look at the following three aspects. First, after the functional requirements are met, make sure room depths are reasonable. Second, with comprehensive consideration given to elevation aesthetics and plane functions, create certain forms at suitable positions of a building to deflect wind and form through wind tunnels by distributing building volumes and creating open-up spaces and openings, so as to facilitate natural ventilation. Third, create spatial forms that help thermal pressure ventilation when necessary, such as atrium, patio and alleyway. With basic ventilation theories and knowledge, an architect can get a clear picture of the factors that influence natural ventilation in a project, thus improving building natural ventilation in designs of plane, elevation and section. The CFD simulation technology enables the architects to effectively and efficiently complete quantitative analysis and evaluation of the passive design, hence plays a key role for green building design optimization.
6. REFERENCES
[1] John D. Anderson, ”Computational Fluid Dynamics” , 5th edition(Indian), University of Maryland, 1995, chapter no. 1,2,12.
[2] WeihongGuo, Xiao Liu, Xu Yuan, “A Case Study on Optimization of Building Design Based on CFD Simulation Technology of Wind Environment” , Procedia Engineering volume(121),2015,pp. 225-231.
[3] VijayakumarNachimuthu, Prabhu Mani, Muthukumar, “CFD Analysis of Application of Phase Change Material in Automotive Climate Control Systems” ,International Journal of Innovative Research in Science, Engineering and Technology, volume 3, 2014.
[4] Chen, Q. and Srebric, J. 2002. “A procedure for verification, validation, and reporting of indoor environment CFD analyses,” HVAC&R Research, 8(2), 201-216.
[5] WangdaZuo, “Introduction of Computational Fluid Dynamics”, FAU Erlangen-Nurnberg, JASS 05, St. Petersburg, 2007.
[6] www.google.com/wikepedia.
[7] Andrini A, Facchini F, Cerutti M, Innocenti A. Numerical Analysis of a Low NOx Partially Premixed Burner for Industrial Gas Turbine Applications. ENERGY PROCEDIA. 2014; 45(ISSN: 1876-6102): p. 1382-1391.
[8] Ivanova E, Noll B, Aigner M. A numerical study on the turbulent Schmidt numbers in a jet in cross-flow. InProceedings of ASME Turbo Expo 2012, GT2012-69294. 2011.
[9] Galeazzo FCC, Donnert G, Cardenas C, Sedlmaier J, Habisreuther P, Zarzalis N, et al. Computational modelingof turbulent mixing in a jet in crossflow. International Journal of Heat and Fluid Flow. 2013; 41: p. 55-65.