Distributional Semantics in R with the
wordspace
Package
Stefan Evert
Professur f¨ur Korpuslinguistik
Friedrich-Alexander-Universit¨at Erlangen-N¨urnberg Bismarckstr. 6, 91054 Erlangen, Germany
stefan.evert@fau.de
Abstract
This paper introduces thewordspacepackage, which turns Gnu R into an interactive laboratory for research in distributional semantics. The package includes highly efficient implementations of a carefully chosen set of key functions, allowing it to scale up to real-life data sets.
1 Introduction
Distributional semantic models (DSMs) represent the meaning of a target term (which can be a word form, lemma, morpheme, word pair, etc.) in the form of a feature vector that records either co-occurrence frequencies of the target term with a set of feature terms (term-term model) or its distribution across text units (term-context model). Such DSMs have become an indispensable ingredient in many NLP applications that require flexible broad-coverage lexical semantics (Turney and Pantel, 2010).
Distributional modelling is an empirical science. DSM representations are determined by a wide range of parameters such as size and type of the co-occurrence context, feature selection, weighting of co-occurrence frequencies (often with statistical association measures), distance metric, dimensionality reduction method and the number of latent dimensions used. Despite recent efforts to carry out systematic evaluation studies (Bullinaria and Levy, 2007; Bullinaria and Levy, 2012), the precise effects of these parameters and their relevance for different application settings are still poorly understood.
The wordspacepackage for Gnu R (R Development Core Team, 2010) aims to provide a flexible, powerful and easy to use “interactive laboratory” that enables its users to build DSMs and experiment with them, but that also scales up to the large models required by real-life applications.
2 Related work
One reason for the popularity of distributional approaches is that even large-scale models can be im-plemented with relative ease. In the geometric interpretation, most operations involved in building and using a DSM can be expressed concisely in terms of matrix and vector algebra: matrix multiplication, inner and outer products, matrix decomposition, and vector norms and metrics.
In order to make DSMs accessible to a large group of users, several dedicated software packages have been developed. Most of these packages either implement a particular model, limiting their flexibility, or impose a complex framework of classes, making it hard for users to carry out operations not envisioned by the package developers. Examples of the first category are HiDeX (Shaoul and Westbury, 2010), a modern reimplementation of the HAL model, and Semantic Vectors (Widdows and Cohen, 2010), which enforces a random indexing representation in order to improve scalability.
A typical example of the second category is the S-Space package (Jurgens and Stevens, 2010), which defines a complete pipeline for building and evaluating a DSM; researchers wishing e.g. to evaluate the model on a different task need to implement the evaluation procedure in the form of a suitable Java class. Two Python-based software packages in this category are Gensim ( ˇReh˚uˇrek and Sojka, 2010) and DISSECT (Dinu et al., 2013), which has a particular focus on learning compositional models.
This work is licensed under a Creative Commons Attribution 4.0 International Licence. Page numbers and proceedings footer are added by the organisers. Licence details:http://creativecommons.org/licenses/by/4.0/
In order to avoid locking its users into a particular framework or class of distributional model, the
wordspacepackage takes a different approach. It builds on the statistical software environment Gnu R, which provides efficient dense and sparse matrix algebra, sophisticated statistical analysis and visual-ization, as well as numerous machine learning methods as part of its core library and through a wealth of add-on packages. R itself is already an excellent environment for the interactive exploration of DSMs.
Like many other R packages, wordspace does not define its own complex framework. It extends functionality that is already available (and easy to use) with a small set of carefully designed functions that (i) encapsulate non-trivial R operations in a convenient and user-friendly way and (ii) provide highly efficient and memory-friendly C implementations of key operations in order to improve scalability. Of the other DSM software packages available, DISSECT seems closest in spirit towordspace. There-fore, it is used as a point of reference for the performance comparison in Sec. 5.
3 Thewordspacepackage
Thewordspacepackage is an open-source project distributed under the GNU General Public License. Since the pacakge is linked to the R interpreter and its functions are always invoked from interpreted code, this does not preclude commercial applications involving closed-source components. The package source code is hosted on R-Forge.1It can easily be installed from the Comprehensive R Archive Network
(CRAN), which provides pre-compiled binaries for Windows and Mac OS X.
3.1 Input formats
The most general representation of a distributional model takes the form of a sparse matrix, with entries specified as a triplet of row label (target term), column label (feature term) and co-occurrence frequency (cf. left panel of Fig. 1). Thewordspacepackage creates DSM objects from such triplet representa-tions, which can easily be imported into R from a wide range of file and database formats. Ready-made import functions are provided for TAB-delimited text files (as used by DISSECT), which may be com-pressed to save disk space, and for term-document models from the text-mining frameworktmfor R.
The native input format is a pre-compiled sparse matrix representation generated by the UCS toolkit.2
In this way, UCS serves as a hub for the preparation of co-occurrence data, which can be collected from dependency pairs, extracted from a corpus indexed with the IMS Corpus Workbench,3or imported from
various other formats such as the Ngram Statistics Package (NSP).4
3.2 Features
The wordspace package offers flexible convenience functions to filter DSMs by properties of their rows (targets) and columns (features), combine multiple co-occurrence matrices by rows or by columns, and merge data obtained from different corpora. Co-occurrence frequencies can be weighted by a tf.idf scheme or one of various statistical association measures, rescaled e.g. by a logarithmic transformation, standardized and row-normalized.
Efficient implementations are provided for dimensionality reduction by randomized SVD (Halko et al., 2009) or random indexing, for computing a distance matrix between a set of row vectors, and for the identification of the nearest neighbours of a given target term. Additional functions compute centroid representations for sentence contexts and support the evaluation of DSMs in standard classification, clus-tering and regression tasks. Several freely available gold standard data sets are included in the package.
Due to its philosophy, wordspace only provides essential functionality that cannot easily be achieved with basic R functions or does not scale well in the standard implementation. Many further analyses and operations (e.g. partial least-squares regression for learning compositional DSMs) can be performed with standard R functions or one of more than 5000 add-on packages available from CRAN.
1http://wordspace.r-forge.r-project.org/ 2http://www.collocations.de/software.html 3http://cwb.sourceforge.net/
dog-n walk-v 6343 dog-n walk-n 2461
dog-n bite-v 1732
cat-n tail-n 1285
cat-n jump-v 541
. . . .
noun rel verb f mode
dog subj bite 3 spoken
dog subj bite 12 written
dog obj bite 4 written
dog obj stroke 3 written
[image:3.595.126.475.63.156.2]. . . .
Figure 1: Typical input data: triplet representation of a sparse co-occurrence matrix (left panel) and verb-noun cooccurrences from the BNC used as example data in Sec. 4 (right panel).
4 Example session
Fig. 3 shows the full set of R commands required to compile and use a DSM with the wordspace
package, based on a built-in table containing co-occurrence counts of verbs and their subject/object nouns in the British National Corpus (BNC), an excerpt of which is shown in the right panel of Fig. 1.
After loading the package (line 1), we use a standard R function to extract data for the written part of the BNC (line 3). Thedsm()function constructs a basic DSM object from co-occurrence data in various sparse matrix representations (line 4). Note that multiple entries for the same noun-verb combination are automatically aggregated, resulting in a19831×4854noun-verb co-occurrence matrix. Highly sparse vectors are unreliable as indicators of word meaning, so we filter out rows and columns with less than 3 nonzero entries using the subset()method for DSM objects. The required nonzero counts have automatically been added by the dsm() constructor. Since deleting rows and columns changes the nonzero counts, we apply the process recursively until both constraints are satisfied (line 9).
Co-occurrence counts are then weighted by the log-likelihood association measure, log-transformed to deskew their distribution, and row vectors are normalized to Euclidean unit length. This is achieved with a single function call and minimal memory overhead (line 13). For dimensionality reduction, the efficient randomized SVD algorithm is used (line 15), resulting in a plain R matrixVObj300.
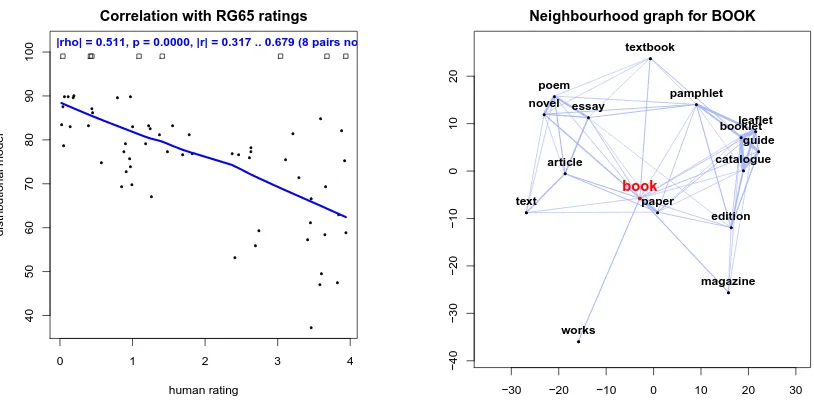
Typical applications of a DSM are to compute distances or cosine similarities between pairs of target terms (line 17) and to find the nearest neighbours of a given term (line 20). The final DSM can be evaluated e.g. by comparison with the RG65 data set of semantic similarity ratings (Rubenstein and Goodenough, 1965). Here, we obtain a Pearson correlation ofr = 0.521(with 95% confidence interval 0.317. . .0.679) and a Spearman rank correlation ofρ = 0.511(line 26). The correlation can also be visualized with a built-in plot method (line 29), shown in the left panel of Fig. 2.
The commands in lines 31–37 illustrate the use of standard R functions for further analysis and vi-sualization. Here, an implementation of non-metric multidimensional scaling in the R packageMASS
produces a semantic map of the nearest neighbours of book. A slightly more polished version of this plot is shown in the right panel of Fig. 2. The only step that takes a non-negligible amount of time is dimensionality reduction with randomized SVD (approx. 14 seconds on the reference system, see Sec. 5).
5 Performance comparison
In order to determine the usefulness of the wordspace package for realistically sized data sets, a benchmark was carried out using the W ×W projection of the Distributional Memory tensor (Baroni and Lenci, 2010), resulting in a sparse30686×30686matrix with 60 million nonzero entries (6.4% fill rate). Execution times of key operations and file sizes of the native serialization format are shown in Table 1 and compared against DISSECT v0.1.0 as the closest “competitor”. Tests were carried out on a 2012 MacBook Pro with a 2.6 GHz 4-core Intel Core i7 CPU, 16 GiB RAM and a 768 GB SSD.
wordspace DISSECT size (.rda/.pkl)
build model from triples file 186.0 s 503.3 s
save model 57.6 s 1.5 s 228.9 MB / 725.7 MB
normalize row vectors 0.5 s 1.3 s
SVD projection to 300 latent dimensions 353.6 s 296.6 s
save latent vectors 10.4 s 0.4 s 71.5 MB / 185.0 MB
20 nearest neighbours (full matrix) 119 ms 1269 ms
20 nearest neighbours (300 dims) 10 ms 92 ms
cosine similarity (full matrix) 4 ms <1 ms
cosine similarity (300 dims) <1 ms <1 ms
Table 1: Performance comparison: wordspacevs. DISSECT on Distributional Memory.
6 Further development
Thewordspacepackage is under very active development. Main objectives for the near future are (i) sparse SVD using SVDLIBC (which is more efficient than randomized SVD in certain cases), (ii) sparse non-negative matrix factorization (NMF), and (iii) built-in support for a wider range of file and database formats. In addition, new weighting functions and distance metrics are continuously being added.
References
Marco Baroni and Alessandro Lenci. 2010. Distributional Memory: A general framework for corpus-based semantics.Computational Linguistics, 36(4):673–712.
John A. Bullinaria and Joseph P. Levy. 2007. Extracting semantic representations from word co-occurrence statistics: A computational study. Behavior Research Methods, 39(3):510–526.
John A. Bullinaria and Joseph P. Levy. 2012. Extracting semantic representations from word co-occurrence statistics: Stop-lists, stemming and SVD. Behavior Research Methods, 44(3):890–907.
Georgiana Dinu, Nghia The Pham, and Marco Baroni. 2013. DISSECT – distributional semantics composition toolkit. InProceedings of the 51st Annual Meeting of the Association for Computational Linguistics: System Demonstrations, pages 31–36, Sofia, Bulgaria, August.
N. Halko, P. G. Martinsson, and J[oel] A. Tropp. 2009. Finding structure with randomness: Stochastic algorithms for constructing approximate matrix decompositions. Technical Report 2009-05, ACM, California Institute of Technology, September.
David Jurgens and Keith Stevens. 2010. The S-Space package: An open source package for word space models. InProceedings of the ACL 2010 System Demonstrations, pages 30–35, Uppsala, Sweden, July.
R Development Core Team, 2010. R: A Language and Environment for Statistical Computing. R Foundation for Statistical Computing, Vienna, Austria. ISBN 3-900051-07-0. See alsohttp://www.r-project.org/. Radim ˇReh˚uˇrek and Petr Sojka. 2010. Software framework for topic modelling with large corpora. InProceedings
of the LREC 2010 Workshop on New Challenges for NLP Frameworks, pages 45–50, Valletta, Malta, May. ELRA.
Herbert Rubenstein and John B. Goodenough. 1965. Contextual correlates of synonymy. Communications of the ACM, 8(10):627–633.
Cyrus Shaoul and Chris Westbury. 2010. Exploring lexical co-occurrence space using HiDEx.Behavior Research Methods, 42(2):393–413.
Peter D. Turney and Patrick Pantel. 2010. From frequency to meaning: Vector space models of semantics.Journal of Artificial Intelligence Research, 37:141–188.
● ● ● ●● ● ● ● ● ● ● ● ● ● ● ● ● ● ● ● ● ● ● ● ● ● ● ● ● ● ● ● ● ● ●●● ● ● ● ● ● ● ● ● ● ● ● ● ● ● ● ● ● ● ● ●
0 1 2 3 4
40 50 60 70 80 90 100
Correlation with RG65 ratings
human rating
distr
ib
[image:5.595.91.498.78.278.2] [image:5.595.78.504.245.709.2]utional model
|rho| = 0.511, p = 0.0000, |r| = 0.317 .. 0.679 (8 pairs not found)
● ● ● ● ● ● ● ● ● ● ● ● ● ● ● ●
−30 −20 −10 0 10 20 30
−40 −30 −20 −10 0 10 20
Neighbourhood graph for BOOK
● ● ● ● ● ● ● ● ● ● ● ● ● ● ● ● ●paper novel magazine works article textbook guide poem essay leaflet edition text pamphlet booklet catalogue book
Figure 2: Two visualizations created by the sample code in Fig. 2.
1 library(wordspace) 2
3 Triples <- subset(DSM_VerbNounTriples_BNC, mode == "written")
4 VObj <- dsm(target=Triples$noun, feature=Triples$verb, score=Triples$f,
5 raw.freq=TRUE, sort=TRUE)
6 dim(VObj)
7 [1] 19831 4854 8
9 VObj <- subset(VObj, nnzero >= 3, nnzero >= 3, recursive=TRUE) 10 dim(VObj)
11 [1] 12428 3735 12
13 VObj <- dsm.score(VObj, score="simple-ll", transform="log", normalize=TRUE) 14
15 VObj300 <- dsm.projection(VObj, method="rsvd", n=300, oversampling=4) 16
17 pair.distances("book", "paper", VObj300, method="cosine", convert=FALSE) 18 book/paper
19 0.7322982
20 nearest.neighbours(VObj300, "book", n=15) # defaults to angular distance
21 paper novel magazine works article textbook guide poem 22 42.92059 48.03492 49.10742 49.33028 49.54836 49.82660 50.29588 50.37111 23 essay leaflet edition text pamphlet booklet catalogue
24 50.45991 50.53009 50.78630 50.95731 51.12786 51.21351 52.43824 25
26 eval.similarity.correlation(RG65, VObj300, format="HW")
27 rho p.value missing r r.lower r.upper 28 RG65 0.5113531 1.342741e-05 8 0.520874 0.3172827 0.6785674
29 plot(eval.similarity.correlation(RG65, VObj300, format="HW", details=TRUE)) 30
31 nn <- nearest.neighbours(VObj300, "book", n=15)
32 nn.terms <- c("book", names(nn)) # nn = distances labelled with the neighbour terms 33 nn.dist <- dist.matrix(VObj300, terms=nn.terms, method="cosine") 34 library(MASS) # a standard R package that includes two MDS implementations
35 mds <- isoMDS(nn.dist, p=2)
36 plot(mds$points, pch=20, col="red") 37 text(mds$points, labels=nn.terms, pos=3)