E-ISSN: 2321-9637
Available online at www.ijrat.org
Edge Detection Using Ant Colony Optimization with
Specific Images
Aysun Coskun
*Department of Computer Education, Gazi University Faculty of Industrial Arts Education, Ankara, Turkey Email: aysunc@gazi.edu.tr
Abstract- Deficiencies occur during obtaining objective images, both at the instant of image developing and
while detecting the image. As a result of such imperfectness problems are encountered during detection of the image and defining the boundaries of the image, when traditional method used for the purpose. Most serious one of such problems is: some significant edge detection information may get lost because of getting the pieces separated from each other during image displaying. Edge detection is a technique to develop definite boundary lines on the pictures and necessary to analyze the contents of the image. An approach has been brought forward in this study that will ensure recognizing the fragmented (discontinued) edges using the ant colony algorithm. Here, the connectable edges are represented in the form of remaining amount of pheromone as a result of ant colony algorithm iteration. It has been observed during the experimental studies that the ant colony algorithm is a suitable method in connecting the fragmented edges of the image.
Index Terms- Ant Colony Optimization(ACA),Edge Detection, ,Image Recognition
1. INTRODUCTION
Edge detectors are used to determine the boundaries of the objects within an image. Complication starts for the edge detectors when answers are required for the “what is an edge” and “how it must be defined” questions. In real life, there is not a definite information in general, about where the boundary of an edge starts and where does it end. In spite of this fact, the edge detectors in general, are able to define the correct edges in an image. This operation is carried out by observers performing predefined subjective calculations. Many conventional edge detectors are functioning depending on the edge models. For example, grade based methods realize a function based on the change in the grey level within the image. Canny edge detectors on the other hand, operate based on the distorted step function from the added white Gaussian Noise. The edge information data are collected both using “on the edge” and “outside of the edge” filters [1].
Ant colony algorithm is an intuitive approach. In this algorithm artificial ants behave intelligently simulating the real ants. The real ants get benefitted from and make use of the experiences of the other ants while searching for the optimal paths to the food and back to the colony. For the artificial ants the same is simulated by pre-defining the initial states and terminating rules. These ants have to obey the rules related to transferring from a
certain point to another one, while wandering around to find the optimal solution [2].
[image:1.595.361.523.579.739.2]In a picture, it is assumed that 8 more adjacent neighboring pixels are present around every pixel those are altogether forming up the picture, in order to solve an edge detection problem (Figure-1). Distances between the adjacent neighboring pixels are calculated on the original picture, and ants are placed on the terminal points those are determined by using traditional edge detection approaches. These ants start the search procedure in order to repair the fragmented (discontinued) edges and for the appropriate edges those can be found by recalculations.
E-ISSN: 2321-9637
Available online at www.ijrat.org
2.ANT COLONY OPTIMIZATION
Ant colony meta-intuitive has been inspired from the scientific findings obtained from observing the routes that the natural ants prefer to follow between their colony and the sources of food. Experiments related to the real ants, have been carried out by Goss and his companions [4] in the year 1989 on the ant colonies raised in the laboratory medium. Results those are obtained from these studies are summarized as following: many ant species are almost blind; ants are leaving some kind of chemical substance called pheromone while moving on the routes leading to the source of food or back to their colony; when the ants face several choices at an intersection of the alternative routes they prefer the route on which the density of the pheromone is maximum and this behavior of the ants is centrally controlled.
2.1.Ant System Formulation
Result of a problem handled by ant system is assumed to be the permutation of n each entities those consisting of that problem (as the cities in the travelling salesman problem or as the operations in the workshop type scheduling problem). At the beginning of solving the problem each ant is located at the same corner or at different corners. Locations of these ants at the (t) moment is derived from the (1) equation (probability relationship) [3].
Pijk
(t)=
[ ( )] .[ ]
∑ ∈ [ ( )] .[ ] (when k is an allowed choice)
0 (otherwise)
!
(1)
tij (t) : pheromone trace amount on the (i,j) corners
at the (t) moment
nij : is the visibility value between (i,j) corners.
This value changes depending on the criterion considered in solving the problem.
α : is a parameter indicating the relative significance assigned to the pheromone trace in the problem.
β : is a parameter indicating the significance assigned to the visibility value in the problem. Ak: is the set of nodes those have not been chosen yet.
Ants make their choices of the next location to get transferred to according to this probability relationship. A tour or iteration gets completed following the entire nods in the problem have been visited. At this stage the amount of pheromone
tij (t + n) = p.tij (t) + ∆tij (2)
p : evaporated pheromone trace ratio between the
time t and time t+n. (0 < p <1)
∆tij : shows the amount of pheromone trace in the
(i,j) corner accumulated due to the ants’ choosing this corner during a complete tour. This amount is calculated according to the equation number (3).
∆#$%=∑'&()∆#$%& (3)
m : Total number of the ants k
∆tij : the amount of pheromone trace in the (i,j)
corner left by k ants; and equation number (4) shows any one of (k) ant’s individual contribution to the amount of pheromone trace at any one of (i,j) corner.
∆#$%& = +-,. (4)
Q : It is a constant.
Lk : k. length of the tour of the ant.
In case the ant has used the (i,j) corner during its tour the amount of pheromone trace that it left is calculated using the equation number (4). Otherwise the value of the trace is zero.
In the edge detection approach within the images, following components are thoroughly defined for the ACA (Ant Colony Algorithm).
1- A problem graphic area is defined, complete with its definite routes, movement cost and number of the ants.
2- Initial locations and required rules those will be generated in relation with the movements of the ants have to be defined.
3- Required conditions for the ants to terminate the optimization have to be constituted.
4- The rules in relation with pheromone update and pheromone evaporation have to be defined.
3. EDGE DETECTION APPROACH BY
USING ANT COLONY ALGORITHM
E-ISSN: 2321-9637
Available online at www.ijrat.org
(Fig.2-a) Original picture
(Fig.2-b) edges of a detected using the conventional method
(Fig.2-c) Placement of an ant on every
termination point
In general, there may be hundreds of termination points on any one image. Some of the ants those are placed at these termination points carry out a search operation within certain time intervals. However, some portion of the ants carry out more search in the same area. These excessive searches need to be limited or minimized. For this purpose ants are distributed into groups identified with different tags. Number of the excessive searches and intersecting search paths are tried to be limited applying the methods those are described in the following paragraphs [5],[6]. Coming face to face: In case two ants from different groups comes face to face i.e. both of them will go to the same pixel with their next movement then both of them halts.(Figure.3.a)
1- Following the traces: In case an ant encounters with the trace of another ant on the travelling path of the latter. (Figure.3.b)
2- Tabu list: An ant keeps record of the pixels it passes through, chooses its direction of movement by checking the tabu list consisting of the pixels the ant has not passed through yet. Sometimes may enter into a dead end path. (Figure.3.c)
3- Trace density measurement: In case the trace of an ant in close vicinity of a certain point has a density greater than the defined threshold value then the ant halts. (Figure.3.d)
Fig.3.
(a) Two ants come face to face
(b)Ant
coincides with the trace of an ant in a different group
(c) Dead end
Pixel Halt of the ant
Trace density measurement range
Trace of Movement Direction of Movement
Fig.3. (d) Trace density measurement
Available online at
Pheromone update is made according to the following formula;
tij = (1-p).tij + p ∆tij
Chosen parameters in the above formula are significant. Specifically, the initial pheromone amount and the coefficient that will be used for evaporation ratio must be chosen carefully.
4. SOFTWARE EXPERIMENT RESULTS
Alpha and beta have been used as control parameters in the edge detection project. parameter phi is the initial amount of The parameter rho is the amount of evaporation.
/$,%( )= 12(345), 6 (7 )
∑8Ω912(345), 6 (7 )
, :;< =Ω$
alpha=1, beta=0.1, rho=0.1 , phi =0.05 have been chosen as the starting parameters and a “cameraman.bmp” image of 128 x 128 pixels and a 272 x 280 pixels “circuit.tif” image have been processed by ACA for edge detection.
Number of ants has been taken as the square root of the product of multiplication of the pixel dimensions of the image in the form of rounded up to the nearest integer,
ant_total_num = round(sqrt(nrow*ncol))
The ant_total_num paramet
total number of ants to be used in the algorithm. Here it is possible to change the number of ants parametrically to any desired number.
Image have been subjected to various different functions such as Flat, Gaussian, Sine and Wave transformations then ant colony algorithm has been applied to each. MATLAB software development medium has been used on two diffe
pictures and results are obtained.
4 different edge images are processed for the “Cameraman.bmp” image in 7 minutes, and 4 different edge images are processed for the “circuit.tif” image in 13 minutes.
A computer with the following specifications has been used for image processing: Intel T2500 2 GHz CPU, 1GB Ram capacity; and the procedures are realized by using 300 iteration steps.
When, the program transforms the images for edge detection regardless of whether they are with bmp, tif, or jpeg extension, all r
images become with bmp extension
of edge detection by using ACA are shown below [7]:
E-ISSN: 2321-9637
Available online at www.ijrat.org
Pheromone update is made according to the
(5)
Chosen parameters in the above formula are Specifically, the initial pheromone the coefficient that will be used for evaporation ratio must be chosen carefully.
SOFTWARE EXPERIMENT RESULTS
used as control parameters in the edge detection project. The is the initial amount of pheromone. The parameter rho is the amount of evaporation.
(6)
alpha=1, beta=0.1, rho=0.1 , phi =0.05 starting parameters and a “cameraman.bmp” image of 128 x 128 pixels and a 272 x 280 pixels “circuit.tif” image have been processed by ACA for edge detection.
Number of ants has been taken as the square root of the product of multiplication of the pixel dimensions of the image in the form of rounded up
ant_total_num = round(sqrt(nrow*ncol))
parameter holds the total number of ants to be used in the algorithm. Here it is possible to change the number of ants
trically to any desired number.
Image have been subjected to various different functions such as Flat, Gaussian, Sine and Wave transformations then ant colony algorithm has been . MATLAB software development medium has been used on two different sized
images are processed for the “Cameraman.bmp” image in 7 minutes, and 4 different edge images are processed for the
A computer with the following specifications has been used for image processing: Intel T2500 2 GHz CPU, 1GB Ram capacity; and by using 300 iteration
[image:4.595.306.527.95.702.2]When, the program transforms the images f whether they are with bmp, tif, or jpeg extension, all resulting become with bmp extension. Two examples of edge detection by using ACA are shown below
Fig.4.a Original Image
Fig.4.b ACA edge detection using transformation
Fig.4.c ACA edge detection using Gaussian transformation
Fig. 4.d ACA edge detection using sin transformation
Fig. 4.e ACA edge detection using wave transformation
In another example;
ACA edge detection using Flat
ACA edge detection using Gaussian
ACA edge detection using sine
Available online at
Fig.5.a Original Image
Fig.5.b ACA edge detection by using transformation
E-ISSN: 2321-9637
Available online at www.ijrat.org
dge detection by using Flat
Fig.5.c ACA edge detection using Gaussian transformation
Fig. 5.d ACA edge detection using transformation
.c ACA edge detection using Gaussian
[image:5.595.74.559.96.647.2] [image:5.595.72.303.98.638.2]Available online at
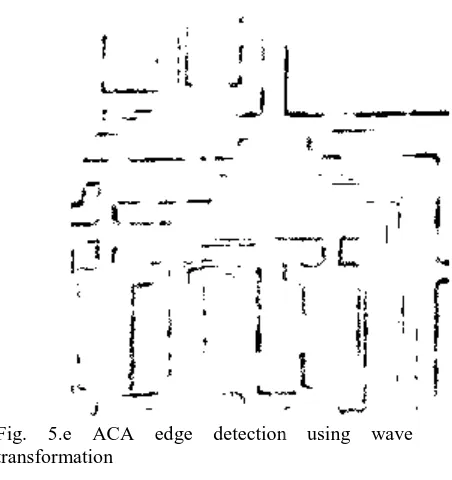
Fig. 5.e ACA edge detection using wave transformation
CONCLUSION
In this study certain images have been applied to pre determined Flat transformation, Gaussian transformation, Sine transformation
REFERENCES
[1] Canny, J., (1986). A computational approach to edge detection. IEEE Trans. Pattern Anal Machine Intell. 8, 679–698.
[2] Cook, G.W., Delp, E.J., (1995). Multiresolution sequential edge linking. In:Proc. IEEE Internat. Conf. on Image Processing, October, pp. 41 44.
[3] Colorni A., M. Dorigo & V. Maniezzo, (1992). Distributed Optimization by Ant Colonies. Proceedings of the First European Conference on Artificial Life, Paris, France, Elsev Publishing.
E-ISSN: 2321-9637
Available online at www.ijrat.org
ACA edge detection using wave
certain images have been applied to Flat transformation, Gaussian transformation, Sine transformation, and Wave
transformation for edge detection and edge images for each function successfully obtained by processing with the ant colony algorithm.
transformed images to be used for edge detection by the project become with bmp extension regardless of the original’s being with bmp, tif, or jpeg extension.
By comparison of the obtained results it may be said that the best edge detection
algorithm is obtained by using sine transformation.
It is possible to make original variations on the edge detection problem that is used in this study. In the more advanced studies, number of ants may be changed parametrically and the operation of the algorithm may be tried on the different images. It is possible to change the parameters such as the operation time of the algorithm and the number of iterations to obtain different results.
By using more new transformation functions for edge detection with ant colony algorithm, the study may be brought to a different dimension.
. A computational approach to edge detection. IEEE Trans. Pattern Anal
Cook, G.W., Delp, E.J., (1995). Multiresolution linking. In:Proc. IEEE Internat. Conf. on Image Processing, October, pp. 41–
Colorni A., M. Dorigo & V. Maniezzo, (1992). Distributed Optimization by Ant Colonies. Proceedings of the First European Conference , Paris, France, Elsevier
[4] Goss S., Aron S., Deneubourg J. L., and Pasteels J. M., (1989),Self
in the Argentine Ant, 76:579-581
[5] Dorigo, M., Stutzle, T., (2004). Ant Colony Optimization. MIT Press.
[6] Dorigo, M., Maniezzo, V., Colorni, A., (1996). The ant system: Optimization by a colony of cooperating agents. IEEE Trans. Systems Man Cybernet. – Part B 26, 1
[7] Jing T., Weiyu Y., and Shengli X.,(2008), Ant Colony Optimization Algorith
Edge Detection, IEEE Congress on Evolutionary Computation,751
for edge detection and edge images for each function successfully obtained by ant colony algorithm. Resulting o be used for edge detection by the project become with bmp extension regardless of the original’s being with bmp, tif, or
By comparison of the obtained results it may be said that the best edge detection with ant colony obtained by using sine transformation.
It is possible to make original variations on the edge detection problem that is used in this study. In the more advanced studies, number of ants may be changed parametrically and the operation of the tried on the different images. It is ossible to change the parameters such as the operation time of the algorithm and the number of iterations to obtain different results.
using more new transformation functions for edge detection with ant colony algorithm, the study
ifferent dimension.
Goss S., Aron S., Deneubourg J. L., and Pasteels J. M., (1989),Self-organized Shortcuts in the Argentine Ant, Naturwissenschaften,
Dorigo, M., Stutzle, T., (2004). Ant Colony Optimization. MIT Press.
Maniezzo, V., Colorni, A., (1996). The ant system: Optimization by a colony of cooperating agents. IEEE Trans. Systems Man
Part B 26, 1–13.
[image:6.595.73.299.104.344.2]