Toward a Unified Evaluation Method for Multiple Reading Support
Systems: A Reading Speed-based Procedure
Katsunori KOTANI
National Institute of
Infor-mation and Communications
Technology
3-5 Hikaridai, Seika-cho,
Soraku-gun, Kyoto, Japan,
619-0289
[email protected]
Takehiko YOSHIMI
Ryukoku University
1-5, Yokotani, Setaoe-cho,
Otsu-shi, Shiga, Japan,
520-2195
Takeshi KUTSUMI
Sharp Corporation
492 Minosho-cho,
Yamato-koriyama-shi, Nara, Japan,
639-1185
Ichiko SATA
Sharp Corporation
492 Minosho-cho, Yamatokoriyama-shi,
Nara, Japan, 639-1185
Hitoshi ISAHARA
National Institute of Information and
Communications Technology
3-5 Hikaridai, Seika-cho, Soraku-gun,
Kyoto, Japan, 619-0289
Abstract
This paper proposes a unified evalua-tion method for multiple reading sup-port systems such as a sentence translation system and a word transla-tion system. In reading a non-native language text, these systems aim to lighten the reading burden. When we evaluate the performance of these sys-tems, we cannot rely solely on these tests, as the output forms are different. Therefore, we must assess the perform-ance of these systems based on the us-ers’ reading comprehension and reading speed. We will further support our findings with experimental results. They show that the reading-speed pro-cedure is able to evaluate the support systems, as well as, the comprehension-based procedure proposed by Ohguro (1993) and Fuji et al. (2001).
1 Introduction
This paper presents an evaluation method for different reading support systems such as a sen-tence-machine translation system (henceforth, an MT-system) and a word/phrase translation system (henceforth, a w/p-MT-system). Al-though, there are various manual/automatic
evaluation methods for these systems, e.g., BLEU (Papineni et al. 2002), these methods are basically incapable of dealing with an MT-system and a w/p-MT-MT-system at the same time, as they have different output forms. On the con-trary, there are further methods which examine the efficacy of these systems (Ohguro 1993; Fuji et al. 2001). These studies demonstrate the ef-fectiveness of the reading support systems by comparing reading comprehension test scores between an English-only text and the one with outputs of either an MT-system (Fuji et al. 2001) or a w/p-MT-system (Ohguro 1993).
In our evaluation method, we examined the system based not only con comprehension but also on speed, i.e., reading efficacy (Alderson 2000). If the system supports a user in an appro-priate way, then the reading efficacy would in-crease from the bottom line, i.e., text without any support. The previous studies focused mainly on reading comprehension. We will now broaden our examination to include reading speed.
We are able to evaluate a system based on single sentences, as we measure sentence-reading speed. In contrast, we are unable to carry out such a local domain evaluation solely based on the comprehension performance.
MT-system and a w/p-MT-system based on speed performance; Section 4 reports the ex-perimental results. Through the experiments, we confirmed that the speed performance-based evaluation basically parallels the comprehension performance-based evaluation; and finally Sec-tion 5 presents our conclusions and future work.
2
The Comprehension-based Methods
2.1
Ohguro (1993)Ohguro (1993) carried out an experiment in which the efficacy of an English-Japanese w/p-MT-system was examined and reported that a w/p-MT-system would be of more aid to those with a lower reading ability. Fifty-four non-native English speakers took part in the experi-ment. Ohguro (1993) prepared 28 texts with 80 comprehension questions extracted from various Test of English for International Communication (TOEIC) texts.
The experiment held two phases. First, all the participants read 14 English-only texts and answered 40 comprehension questions. On the basis of the test score, the participants were di-vided into two groups so as to balance the read-ing ability between them. Then, Ohguro (1993) gave English-only texts to one group, the control group, and provided texts supported with the a w/p-MT-system to the other group.
Ohguro (1993) hypothesized that the control group would get similar test scores on both tests, as opposed to varying test scores from the other group. In addition, it was predicted that the scores of the non-control group would depend on the reading ability of the group members with respect to TOEIC scores (Hypothesis I). That is, a higher test score would be expected for those with a lower TOEIC score group. Thus, Hy-pothesis I was incorrect given the results. Oh-guro (1993) reanalysed the increase in the test scores by dividing that group into two. Under this revised analysis, he hypothesized that a greater increase in score would be shown in the second test by those with lower initial scores (the revised Hypothesis I). This revised hypothesis was correct given the result. Ohguro (1993) con-cluded that the supporting effect of a w/p-MT-system was greater for those who had a lower reading ability than those highly skilled readers.
2.2
Fuji et al. (2001)Fuji et al. (2001) examined how the efficacy of an English-Japanese MT system varied depend-ing on English readdepend-ing ability. Approximately 200 non-native English speakers participated in the experiment. The participants were divided into 12 groups based on their TOEIC scores. The score range was between (i) less than 395 and (ii) more than 900. Fuji et al. (2001) pre-pared three types of texts. One was an English-only text as a control text, another contained only translated sentences by an MT-system, and the other involved both English texts and the MT-system outputs. Each participant read 14 texts, and answered 40 comprehension ques-tions.
Through this experiment, Fuji et al. (2001) observed that translation-only texts would de-grade the test scores for the higher TOEIC score group, while the lower score group exhibited no degrading effect. In addition, they found that English texts with MT-outputs might increase the test scores for the lower score group more greatly than the higher score group.
With respect to the test completion time, Fuji et al. (2001) observed that an MT-system highly shortened the time for the lower score group relative to the higher score group.
2.3
SummaryThrough the surveys of these studies, we were able to confirm that both a w/p-MT-system and an MT-system exhibited greater supporting ef-fects on the lower TOEIC score group than the higher TOEIC score group.
3
Evaluation with Reading Speed
3.1
The purposeThe purpose of our evaluation is to pursue the efficacy of reading support systems with respect not only to the users’ reading ability but also to the readability of a complete text or a single sen-tence. That is, we would like to explicate through the evaluation whether the supporting effect might change due to the text properties such as complexity of a syntactic structure, fa-miliarity of words, and so on.
would be inappropriate, as it is inefficient to assign a comprehension question to each sen-tence. Suppose that we could evaluate reading support systems regarding such a local domain. Then, we could choose which system is proper, depending on his/her reading ability and the readability of a text. Such usage of reading sup-port systems would be useful.
3.2
Reading Speed as an Evaluation Criterion In our evaluation method, we adopt reading speed performance as an evaluation criterion in addition to the comprehension performance. There are three reasons for this adoption of read-ing speed.First, in contrast to reading comprehension, we can measure sentence-reading speed, and thus we can examine system efficacy on a sen-tence-level.
Secondly, reading speed can be measured with any texts which is readable by the reading support systems. For instance, we can evaluate system efficacy for texts such as newspapers, magazine articles, web pages, emails, and so on. By contrast, the comprehension-based evalua-tion requires comprehension quesevalua-tions.
Thirdly, as shown below, we have statisti-cally found that the reading speed reflects the readability of a sentence. We confirmed the positive correlation (r=0.7, p<0.01) between reading speed and readability of a text calculated with the so-called readability formula (Flesch 1948). Given this positive correlation, we as-sumed that reading speed indicates readability. Thus, a direct relationship exists between read-ability and reading speed.
3.3
Reading Speed-based Evaluation MethodAssuming that reading speed reflects text read-ability, we can further assume that the reading support systems would affect text readability. That is, the positive supporting effect of a sys-tem would increase the text readability. Given this, we can evaluate the efficacy of a system on the basis of reading speed.
Our evaluation method accepts the positive effect of a system if the reading speed is creased. When the reading speed remains in-variant, or decreases, the method regards a system as inefficient. Thus, if we compare the reading speed between a supported and a
non-supported text, the increase of speed should be greater for those who have a lower reading abil-ity than the highly skilled people on the basis of previous studies.
4 Evaluation
Experiment
4.1
The Experimental PurposeWe conducted an experiment in order to exam-ine the validity of our method. Given the read-ing speed evaluation method, it is predicted that reading speed would reflect readability of a text (Hypothesis 1) and reader’s ability (Hy-pothesis 2).
As for readability of a text, we assume that supporting systems would increase readability of a text. Therefore, we set the following hy-pothesis:
Hypothesis 1:
A non-supported English text would be the most difficult to read, whereas a manually translated Japanese text would be the easiest. Supported text would fall mid-range.
The efficacy of the supporting systems is in-versely related to the reader’s ability, as the pre-vious studies have shown. Therefore, we propose the following hypothesis:
Hypothesis2:
The inverse relation is detectable between the reading ability and the reading speed increase.
4.2
The Experimental DesignOne hundred and two non-native English speakers participated in the experiment. We divided the participants into three groups based on their TOEIC scores: (i) those with a lower score (400-595 pts.), (ii) those with an intermediate score (600-795 pts.); and (iii) those with a higher score (800-995 pts.). The group sizes were: (i) = 36, (ii) = 36, and (iii) = 30. We statistically compared average test scores and reading speed among these groups.
In this experiment, we examined the effi-cacy of the following supporting systems: a sentence translation system, a word/phrase translation system, and a chunker. Thus, we created four types of test texts: (i) English texts glossed with sentence translations (here-after, E&MT); (ii) machine-translated texts (MT); (iii) English texts glossed with word translation (RUB); and (iv) English texts with word/phrase boundary markers (CHU).
In addition, we prepared two types of con-trol texts. One is a raw English text, and the other is a human-translated Japanese text. We randomly selected sixteen texts from each text group and distributed eighty-four to each par-ticipant. Thus, the participants are exposed to a variety of texts.
[image:4.595.72.286.413.502.2]In the experiment we used a reading process monitoring tool and recorded the reading time per sentence (see Yoshimi et al. 2005 for further description). We calculated the sentence read-ing speed based on words per minute (WPM) read. As the cursor moves over each number bar, the text is displayed sentence-by-sentence. See Figure 1. There is no limit to how many times a sentence can be viewed.
Figure 1. Screenshot of the monitoring tool
We omitted the machine-translated words and focused solely on the number of English words to calculate the reading speed. Therefore, we were able to directly compare the reading speed of a supported text to that of a non-supported English text.
The goal of this study is to depict the effi-cacy of the support systems. Hence, the actual reading speed of an English and Japanese mixed text was out of the scope. If reading speed was calculated based on both English and Japanese words, the reading speed of a supported text would be faster than an English text, even though the reading time was the same. This is due to a greater number of words in the supported text. Therefore, we calculated
reading speed based solely on English words to account for this implausible effect. We also applied this procedure to a manually translated Japanese text.
4.3
Experimental Results 4.3.1 Tested DataBefore presenting the experimental results, one clarification is in order here. We chose to analyse a manageable 13 reading texts of the whole data, i.e., 84 reading texts. The texts we used varied in topic, style, and length. For instance, they were article-based texts, reports, and advertisements. Among these texts, we examined article type texts.
There were two reasons for this limitation. One concern was with the performance of the reading support systems. We assumed that the system performance was dependant on text styles, and that the system would most effec-tively support reading of article type texts be-cause they contained less stylistic variations compared with other types of texts, particu-larly, advertisements.
The other concern was with text length. Article type texts tended to be longer than the others, and hence were more conducive to the supporting effect of the systems as shown in Table 1.
Text Words Sentences
Non-article texts* 89.6 5.9 Article texts 142.9 9.6
Table 1. Article texts and non-article texts
*reports, advertisements, and announcements averaged together
Text* Mean SD 95% CI of Mean ENG 75.1 31.9 70.1 to 80.3 CHU 74.1 36.5 68.3 to 80.1 RUB 65.5 28.0 61.1 to 70.1 MT 102.6 57.0 93.2 to 111.9 E&MT 70.3 31.7 65.3 to 75.2
JPN 163.1 80.7 149.7 to 176.6 Table 2. Mean reading speed
*ENG, English texts; CHU, English texts marked with word/phrase boundary; RUB, English texts glossed with machine-translated words; MT, machine-translated texts; E&MT, English texts glossed with machine-translated sentences; JPN, manually-translated texts
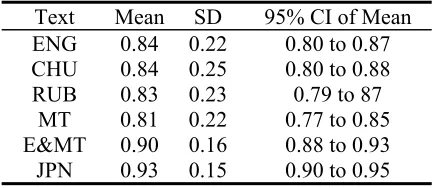
4.3.3 Testing Hypothesis 1: Comprehension Hypothesis 1 was not supported for the lowest comprehension scores, paralleling reading speed results. Thus, the lowest score was found in the MT texts as shown in Table 3. The results supported the hypothesis in respect to the JPN texts scoring highest.
Text Mean SD 95% CI of Mean ENG 0.84 0.22 0.80 to 0.87 CHU 0.84 0.25 0.80 to 0.88 RUB 0.83 0.23 0.79 to 87
MT 0.81 0.22 0.77 to 0.85 E&MT 0.90 0.16 0.88 to 0.93 JPN 0.93 0.15 0.90 to 0.95
Table 3. Mean percentatge of questions answered correctly. In order to analyse the reading data in more detail, we compared the correct answer rates among the TOEIC test score groups. We di-vided the participants into three groups based on TOEIC scores: 400-595 (BEGinner), 600-795 (INTermediate), and 800-995 (ADVanced).
The correct answer rate of each group is shown in Table 4. In the BEG class, the lowest rate was found in English texts, and the highest was seen in Japanese texts. Although the high-est rate can be seen in Japanese texts, the lowhigh-est was found in MT texts in the INT class and ADV class.
On the basis of comprehension test results, we confirmed that all the supporting systems increased comprehension test scores for the BEG class, E&MT for the INT class, but not for the ADV class.
BEG INT ADV
ENG 0.68 0.89 0.93
CHU 0.74 0.85 0.92
RUB 0.74 0.83 0.92
MT 0.77 0.82 0.84
E&MT 0.87 0.93 0.91
[image:5.595.71.288.360.454.2]JPN 0.87 0.96 0.94
Table 4. The correct answer rate by TOEIC score group
On the basis of this result, we conclude that the reading support systems help the lowest TOEIC score group participants, while the sup-porting effect would be minor for the higher score group.
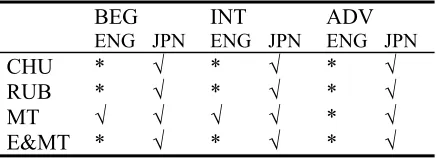
We analysed the mean rate with one-way ANOVA by contrasting the ENG texts or the JPN texts. The result is shown in Table 5. The asterisk refers to a non-significant difference, while the check mark shows a significant difference.
In the BEG class, the rate of correct answers in the ENG texts was significantly lower than in the E&MT texts. There was no text that signifi-cantly differed from the JPN texts.
In the INT class, there was no significant dif-ference compared with the ENG texts, while the rate of the JPN texts significantly differed from the CHU, RUB, and MT texts.
In the ADV class, there was no significant difference comparing with the ENG texts. The rate of the JPN texts showed a significant differ-ence from the MT texts.
BEG INT ADV ENG JPN ENG JPN ENG JPN
CHU * * * √ * *
RUB * * * √ * *
MT * * * √ * √
E&MT √ * * * * *
Table 5. ANOVA results for the correct rate by TOEIC
score group
4.3.4 Testing Hypothesis 2
There-fore, we were able to conclude that Hypothesis 1 was supported among the ENG, MT, and JPN texts.
Given this, we focused on these texts and found that Hypotheses 2 was correct. As Table 6 shows, the reading speed of the MT texts was faster than the ENG texts in all the groups. The increase of the speed was inversely related to the readers’ ability. Thus, the increase was 47.3 in the BEG class; 25.4 in the INT class; and 10.9 in the ADV class.
BEG INT ADV
ENG 62.4 73.2 89.2
[image:6.595.70.288.224.279.2]MT 109.7 98.6 100.1 JPN 172.2 152.1 170.9
Table 6. The reading speed (WPM) by TOEIC score range We analysed the mean reading speed (Table 7) with one-way ANOVA by contrasting the ENG texts or the JPN texts. The speed of the MT texts was significantly faster than that of the ENG texts in the BEG and INT classes. However, in the ADV class, there was no text that signifi-cantly deferred from the ENG texts. The reading speed of the JPN texts was significantly faster than the other texts in all the classes. See Table 8.
Text BEG INT ADV
ENG 62.4 73.2 89.2
CHU 63.2 63.4 98.1
RUB 58.4 60.0 80.3
[image:6.595.70.289.432.526.2]MT 109.6 98.6 100.1 E&MT 71.4 60.8 80.7 JPN 172.2 152.2 1701.0 Table 7. The reading speed (WPM) by TOEIC score range
BEG INT ADV ENG JPN ENG JPN ENG JPN
CHU * √ * √ * √
RUB * √ * √ * √
MT √ √ √ √ * √
E&MT * √ * √ * √
Table 8. ANOVA results for the reading speed by TOEIC
score group
5. Conclusion
In this paper, we presented the reading speed-based evaluation method for reading support systems. On the basis of the experiment, we found that the method articulated the perform-ance of the systems, such as a chunker, a word-translation system, and a sentence-word-translation system. We found that only a sentence-translation showed the supporting effect. How-ever, this supporting effect was not available for the advanced English learners.
We have not yet discussed crossing effects of comprehension result and speed result, but we will expect the further study would reveal it.
References
Alderson, J. C. 2000. Assessing Reading. Cambridge University Press: Cambridge.
Flesch, R. 1948. A New Readability Yardstick. Jour-nal of Applied Psychology 32: 221-233.
Fuji, M., N. Hatanaka, E. Ito, S. Kamei, H. Kumai, T. Sukehiro, T. Yoshimi, & H. Isahara. 2001. Evaluation Method for Determining Groups of Users Who Find MT “Useful.” Proceedings of the MT Summit VIII.
Ohguro, Y. 1993. Evaluating the Validity of Printing Japanese Words alongside English Text. Technical Report on Information Processing Society of Ja-pan. 93-NL-79: 127-134.
Papineni, K., S. Roukos, T. Ward, & W.-J. Zhu. 2002. BLEU: A Method for Automatic Evaluation of Machine Translation. Proceedings of the 40th An-nual Meeting of the Association for the Computa-tional Linguistics: 311-318.
[image:6.595.71.290.553.632.2]