•
•
General Ledger and Financial Control·
MINOR REVISION-1967
Page 33 has been updated with pictures of IBM System/360.
© 1956 by International Business Machines Corporation
Contents
GENERAL LEDGER ACCOUNTING ... .
Chart of Accounts ... .
Source Records ... 5
Trial Balance ... ... ... 8
Income Statement ... 9
Balance Sheet ... 12
The General Ledger ... 14
FINANCIAL CONTROL ... 16
Expense and Revenue ... 17
Budgets and Budgetary Control ... '" ... ... 20
CAPITAL STOCK ACCOUNTING ... 25
DATA PROCESSING SYSTEMS ... 32
Data for Decision
The management team of a successful business makes decisions on the basis of facts. And the number, timeliness and accuracy of the available facts depend directly on the accounting methods employed.
Your accounting methods channel a great number of details into books and journals. These books and journals pass on their information and conclusions to subsidiary ledgers higher in the accounting scale. And at the apex of the accounting scale is the general ledger-the terminal point of all your accounting entries, the summary of your company's activities.
The general ledger and the financial reports that it provides demand the highest degree of accuracy: accuracy in summaries of great masses of detail, in the shortest possible time. So, the general ledger and financial reports to management demand accuracy, efficiency and speed.
General Ledger Accounting
The evolution of accounting methods closely parallels increased production and the consequent growth of busi-ness. The first double-entry bookkeeping method used only two books-the daybook or journal, and the ledger. Each transaction was carefully recorded in the journal, both the debit and the credit side. Then the items were posted to the appropriate accounts in the ledger. This was usually a bound book, of considerable size, with groups of pages set aside for each type of account: receivables, payables, capital accounts, plant and equip-ment, and all the others.
Gradually, individual ledgers were established for all accounts in the general ledger. Only the totals from these subsidiary ledgers appear in the trial balance and in the control account in the general ledger.
Now the general ledger represents the control or master records, and the details supporting these master records are assigned to the subsidiary ledgers.
Let us outline briefly the basic requirements for an efficient general ledger accounting procedure:
CHART OF ACCOUNTS - preparation of general
classifications.
SOURCE RECORDS - processing original data for
multiple use.
TRIAL BALANCE - proof of all subsidiary ledgers.
INCOME STATEMENT - total income less expenses.
BALANCE SHEET - assets less liabilities equals net
worth.
GENERAL LEDGER - producing the summarized
rec-ord of all the company's transactions.
Chart of Accounts
Five broad divisions of accounts can include all the types of accounts you are likely to have in your company's operations:
ASSETS - things owned by the company, or amounts
due the company.
LIABILITIES - amounts owed by the company.
EXPENSE - holding accounts to be entered to surplus
as loss.
INCOME - holding accounts to be transferred to
sur-plus as profit.
CAPIT AL--proprietorship accounts owed to the stock-holders.
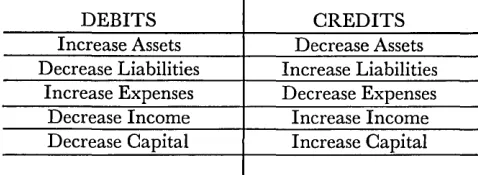
Double-entry bookkeeping provides that every entry must have a compensating debit and credit. Regardless of how many entries are made, debits must equal credits. Figure 1 shows how these balancing debits and credits affect the above accounts.
DEBITS CREDITS
Increase Assets Decrease Assets
Decrease Liabilities Increase Liabilities
Increase Expenses Decrease Expenses
Decrease Income Increase Income
Decrease Capital Increase Capital
[image:6.613.323.562.577.665.2]An orderly account classification is necessary to the preparation of well arranged and intelligible statements. This is the chart of accounts. But the chart of accounts must be designed to fill the specific and individual needs of a particular company, its activities, and the final re-ports needed by that company.
You will find many variations in different charts of accounts, but they should all possess certain character-istics:
1. Explicit account names.
2. Sequence-numbered account codes.
3. Items arranged in the same order as used for finan-cial and operating statements.
4. Simple yet comprehensive format, with room for ex-pansion and with provision for special factors such as company subsidiaries, divisions, branches and de-partments.
EXPLICIT ACCOUNT NAMES
The name of any account should be short and terse; yet it should explain clearly the function and purpose of that account. These are typical account names, and we shall build our sample chart of accounts around them:
Cash on hand and in banks Accounts receivable Reserve for bad debts Notes receivable Marketable securities Inventories
Land Buildings
Depreciation reserve for buildings Equipment and machinery
Depreciation reserve for equipment and machinery Prepaid interest Prepaid expenses Patents Good will Other assets Accounts payable Accrued liabilities Statutory obligations Notes payable Debentures Dividends payable Other liabilities Capital stock Surplus Profit and loss Sales,
Cost of sales
Sales administrative expense
2
Research Selling expenses
'''' arehouse and transportation Service, maintenance, and installation Dividends from partly owned companies Rents received
Discounts allowed Factory burden -labor
Factory burden - supplies
Factory labor
Materials and parts used
There will very likely be others in various organiza-tions, but these will serve our purpose in this discussion.
ACCOUNT CODES
Many systems of coding account numbers are in use. This is one of the more common patterns:
Major Account Minor Account
three digits xxx
three digits xxx
Starting with the first digit of the major account code, the code is organized as follows:
BALANCE SHEET GROUPS
lxx Assets 2xx Liabilities 3xx Proprietorships
INCOME STATEMENT GROUPS
4xx Operating income and expense 5xx Non-operating
income and expense
MANUFACTURING STATEMENTS
9xx Manufacturing Costs
Then the second digit of the major account code would further divide the general classifications: 11 x Current assets
12x Fixed assets 13x Deferred charges 14x Intangibles 15x Other assets
21x Current liabilities 22x Long-term liabilities 23x Other liabilities
31x Capital stock accounts 32x Surplus
41 x Sales income 42x Operating expenses
51x Non-operating income 52x Non-operating expenses
91x General factory burden 92x Factory labor
The third digit, then, would reEresent: 112 Accounts receivable
111 Cash on hand and in banks 1xx Domestic customers
112 Accounts receivable 2xx Foreign customers
113 Reserve for bad debts 3xx Employees
114 Notes receivable 4xx Officers, directors, stockholders
115 Marketable securities 5xx Licenses
116 Inventories 6xx Agency and intercompany
121 Land 7xx Associated companies
122 Buildings 8xx Other companies
123 Depreciation reserve for buildings
113
124 Equipment and machinery 100 Reserve for bad debts
125 Depreciation reserve for equipment and 114 Notes receivable
machinery 1xx Domestic customers
131 Prepaid interest 2xx Foreign customers
132 Prepaid expenses 3xx Employees
141 Patents 4xx Officers, directors, stockholders
142 Good will 5xx Licenses
151 Other assets 6xx Agency and intercompany
211 Accounts payable 7xx Associated companies
212 Accrued liabilities 8xx Other companies
213 Statutory obligations
221 Notes payable 115 Investments and marketable
222 Debentures securities
223 Dividends payable 1xx Wholly controlled subsidiaries
231 Other liabilities 2xx Controlled companies
311 Capital stock 3xx U. S. government
321 Surplus 4xx State, city, county, municipal
322 Profit and loss 5xx Foreign government
411 Sales 6xx Other corporates
412 Cost of sales 7xx Own - reacquired
421 Selling expense 8xx Miscellaneous
422 Research
423 Sales administrative expense 116 Inventories
424 Warehouse and transportation 1xx Raw materials
425 Service, maintenance and installation 2xx Manufacturing supplies
511 Dividends from partly owned companies 3xx Work in process
512 Rents received 4xx Parts and subassemblies finished
521 Discounts allowed 5xx Finished goods
911 Factory burden, labor 6xx Miscellaneous - unclassified
912 Factory burden, supplies
121 Land
921 Factory labor
1xx Operating property
931 Materials and parts used
2xx Idle property
This completes the cQding of the three digits of the
3xx Outside property
major account code. The minor account code is in two
4xx Land held in fee
sections: ( 1) the first digit and (2) the two remaining
5xx Operated for other corporations
digits. The first digit would stand for:
and individuals
MAJOR MINOR TITLE
111 Cash on hand and in banks 123 100 Reserve for depreciation-buildings
lxx Demand deposits in domestic banks
2xx Demand deposits in foreign banks 124 Equipment and machinery
3xx Special bank accounts lxx Machinery
4xx Cash on hand 2xx Tools, dies, jigs, fixtures
5xx Redeemable items 3xx Rental and royalty machines-leased
124--cont. 5xx 6xx 7xx 8xx
125 100
Other operating equipment Non-operating
Building equipment
Construction and betterment order in process
Reserve for depreciation -equipment and machines
Now two digits remain in the minor account code to be used for detailed identification of the item:
MAJOR MINOR TITLE
t
11 Cash on hand and in bankst
11 lxx Demand deposits in domestic banks 1t
1 101 Bank of America102 First National 103 U. S. Bank 104 Republic Bank 105 American National 106 First Trust Co.
Thus, applying the coding system, money on deposit in the Republic Bank is identified by the account num-ber 111-104.
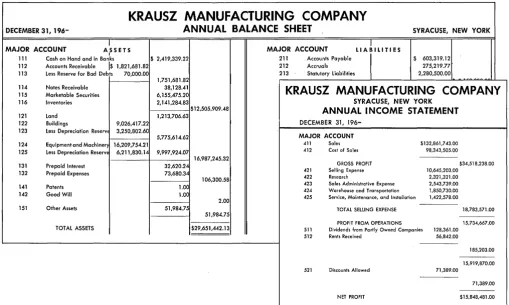
Let's pause for a moment to note that assigned major account codes have been arranged in the order used for preparing financial and operating statements. Figure 2 shows a typical balance sheet and an income statement. In assigning these code numbers to the various ac-counts, provision was made for the detailed descriptions; yet whole blocks of possible code classifications were deliberately left unused.
These blocks of numbers provide room for expansion in the chart of accounts. Some of the possible causes of expansion would be:
1. New companies coming into the organization as affiliates or subsidiaries.
2. Major products or activity classes being established as company divisions.
3. Company expansion by acquisition of plants or es-tablishment of branch offices.
4. Formation of new operating departments.
You now have a workable and flexible chart of ac-counts. As transactions occur within the company, they are recorded in the subsidiary ledgers and summarized. These summaries-totals of the various activities of your company-are the source data for the general ledger.
DECEMBER 31,
196-KRAUSZ MANUFACTURING COMPANY
ANNUAL BALANCE SHEET SYRACUSE, NEW YORK
I MAJOR ACCOUNT A,S SET S
III Cash on Hand and in Banks $ 2,419,339.22 112 Accounts Receivable 1$ 1,821,681.82
113 Less Reserve for Bad Debts 70,000.00
114 115 116
Notes Receivable Marketable Securities Inventories
1,751,681.82 38,128.41 6,155,475.20 2,141,284.83
1 _ _ _ _ -1$12,505,909.48 121
122 123
Land
Buildings 9,026,417.22 Less Depreciation Reserv 3,250,802.60
124 Equipment and Machiner 16,209,754.21
1,213,706.63
5,775,614.62
125 Less Depreciation ReserVE 6,211,830.14 9,997,924.07
1 - - - + - - - 1 16,987,245.32 131
132
l41 142
151
Prepaid Interest Prepaid Expenses
Patents Good Will
Other Assets
TOTAL ASSETS
32,620.24
73,680.3~
1.0C 1.0C
[image:9.615.44.554.344.649.2]51,984.7t
Figure 2. This is the company's net worth.
4
106,300.58
2.00
51,984.75
$29,651,442.13
MAJOR ACCOUNT L I A
~
I LIT I E S211 Accounts Payable
I
~~~
~t~;uUt:~~
Liabilities$ 603,319.12 275,219.77 2,280,500.00
KRAUSZ MANUFACTURING COMPANY
SYRACUS~ NEW YORKANNUAL INCOME STATEMENT
DECEMBER 31, 196-MAJOR ACCOUNT
411 Sales $132,861,743.00
412 Cost of Sales 98,343,505.00
GROSS PROFIT
421 Selling Expense 10,645,203.00
422 Research 2,321,321.00
423 Sales Administrative Expense 2,543,739.00 424 Warehouse and Transportation 1,850,730.00 425 Service, Maintenance, and Installation 1,422,578.00
TOTAL SELLING EXPENSE
PROFIT FROM OPERATIONS
511 Dividends from Partly Owned Companies 128,361.00 512 Rents Received 56,842.00
521 Discounts Allowed 71,389.00
NET PROFIT
Source Records
The method of preparing the source information for general ledger entries depends directly upon the method used in posting and maintaining the various journals and subsidiary ledgers.
SUMMARY CARDS
In many cases, the mM data processing method of
accounting is used for applications and procedures such as accounts payable, accounts receivable, payroll and labor, inventory and material. This method of process-ing accountprocess-ing data includes the preparation of general ledger information as one of the final steps in the sub-sidiary ledger application.
The information is prepared in the form of a punched summary card. At the end of the accounting period, the accounting machine prints the final reports for each subsidiary ledger.
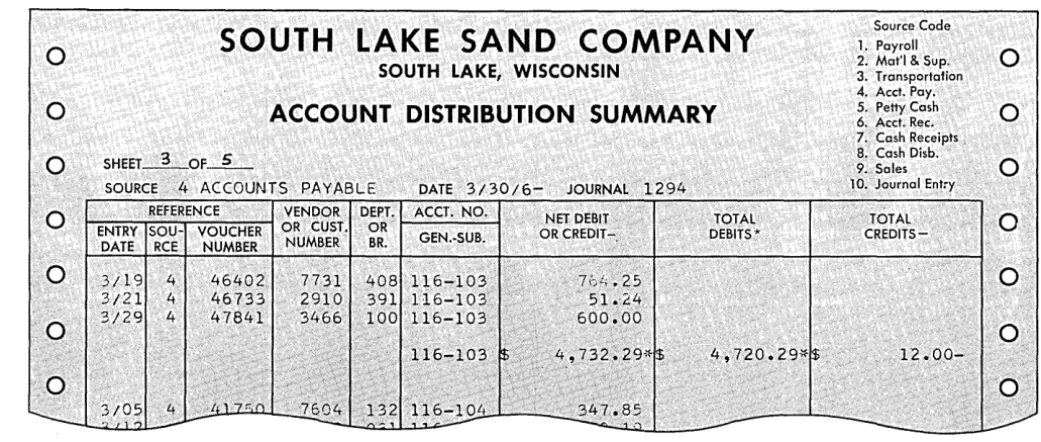
The cards for each individual, accounting application are arranged in account-number sequence, mechani-cally and at high speed. Then an account distribution summary (Figure 3) is prepared for each application. As the accounting machine prints the distribution mary, cards with totals by account number are sum-mary-punched. Summary cards so obtained are filed for
use as general ledger entries at the end of the account-ing period.
JOURNAL VOUCHERS
Some of the accounting operations may be performed in another way, and summary-punched cards will not be available. Journal vouchers are prepared to handle this kind of transaction, and general ledger entry cards are punched from these vouchers. A good example transaction is a contribution to a charity. One of your officers writes a check request. When the check is pre-pared, the cashier prepares a voucher, and the infor-mation appearing on the voucher is punched in an entry card.
Journal vouchers result from correction or adjustment entries too. At the end of an accounting period in ac-counts payable, for instance, a number of invoices have been received on the last day or two. They may not be processed in time to appear in the accounts payable distribution summary, but they are legal liabilities, and they affect both balance sheet and income statement. These unprocessed items of payables are manually entered on a journal voucher. The distribution is shown on the voucher and general ledger entry cards are punched.
SOUTH LAKE SAND COMPANY
Source Code0
1. Payroll0
SOUTH LAKE, WISCONSIN 2. Mat'I & Sup. 3. Transportation
4. Acct. Pay.
a
ACCOUNT DISTRIBUTION SUMMARY
5. Petty Casha
6. Acct. Rec. 7. Cash Receipts,
0
SHEET_3_0F_5_ 8. Cash Disb. 9~ Sales0
SOURCE 4 ACCOUNTS PAYABLE DATE 3/30/6- JOURNAL 1294 10. Journal Entry
0
REFERENCE VENDOR DEPT. ACCT. NO. NET DEBIT, TOTAL TOTALa
ENTRY SOU- VOUCHER OR CUST. OR OR CREDIT- DEBITS*CREDITS-DATE RCE NUMBER NUMBER BR. GEN.-SUB.
0
3/19 4 46402 7731 76Li.250
3/21 4 46733 2910 51.~24
a
3/29 4 47841 3466 600.000,'
[image:10.618.47.568.453.674.2]
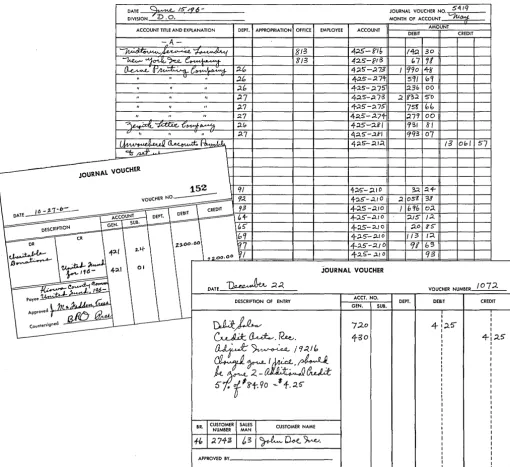
Similarly, correction entries are made by wrItmg a voucher. Vouchers vary greatly in form, even within a given organization, but the information can be punched into a general ledger accounting card and thus standard-ized (Figure 4) .
PREPUNCHED JOURNALS
Some subsidiary ledgers may be for the same amount each period, for example, depreciation, rents, mortgage redemption, interest payable, and insurance. Cards rep-resenting these journals are pre punched with all the significant information that will remain constant. Then
DATE ~ 15"""1 6
-DIVISION D . o.
they are retained in a file until the end of the account-ing period.
When the final reports are being prepared for trial balance, the current card for each prepunched journal is removed from the file and completed. This may in-volve punching date or amount. These cards are merged with the other general ledger cards and are ready for processing the final reports and the general ledger.
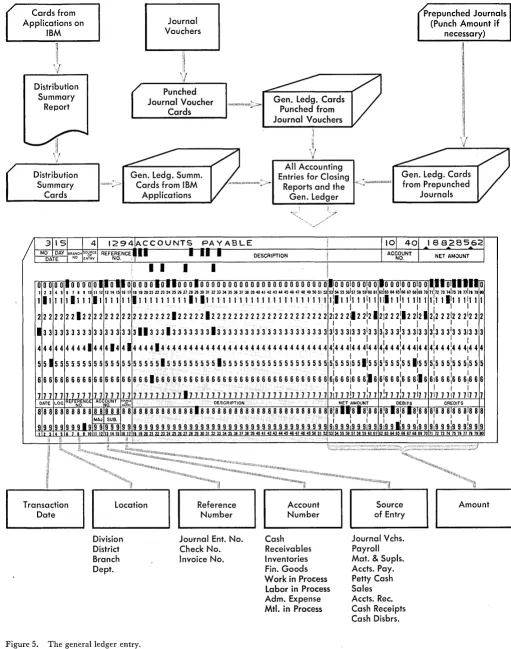
The source information has been collected and pre-pared. Results of all the company's transactions have been recorded and summarized. You are ready to write final reports and to make general ledger entries by ma-chine-processing the general ledger accounting cards
(Figure 5).
JOURNAL VOUCHER NO. 54,Q
MONTH OF ACCOUNT '-1u,()A./..
ACCOUNT TITlE AND EXPLANATION AMOUNT
DEBIT CREDIT DEPT. APPROPRIATION OFFICE EMPLOYEE ACCOUNT
"A
-'"4. :A~ '~V '." '-f .lJ. 813 4;25 ?Ib 14~ 30
~,."'1~ "}u. ~, 813 425 f/3 "7 ~g
0-<.-<-.(.; ~J;t.<~... f:, .1 v :tC" 4;2.5-;<73 I 990
+S-" .. " ;lC" 4-:l.s-.:nt 5'11 101
" ., ;t(, 4-2s-;2.iS :231, 00
" " " ;1.7 4.:l.S-...<73 ..2 ~3.2. 50
" " " ~? 4-:2.5'-;2.75" 7S!
""
" " " :1.7 4:tS'-..:2.7't- ;1.7'1 00
~~".. '11 ;:u" 4:2.5-:2.81 9?>I 8'1
C/
..
" v " "'" ~7 4;2.5'-.2.8'1 qq3 07
1 I .0 .n ~ (~l-+--+---l--+---+":"---1It----+--I---lI--~I---t-~
~ ~--- \~--4---+---+---~---~--~~--+-~--~--1
\
4;l.5'-;U~ ,B obI 57
JOURNAL VOUCHER
\
152 \ (II 4;15-;2.10 ~ :2.+
VOUCHER N O . - ---=l\t--:9:-:~--f---+--I---+-'4-:-:l.-5"-_-=-.:2..-,-:0-tt--;J,+-OS""'8:'+:3::-:3:--t1---t--+---t \
~..::-- \ \ CREDit 93 4-::t5-..:2./O 1 b'fb 0;2.
VOUCHER NUMBER 107;2.
ACCT. NO.
DEPT. DEBIT CREDIT GEN. SUB.
:
I 4 :;l.$'"I
720 I
I I
43
0 I 4-:~5I
I I
I I
I I I I I
BR
I
CUSTOMERI
SALESI
CUSTOMER NAME • NUMBER MAN [image:11.617.45.556.220.687.2]APPROVED BY' _ _ _ _ _ _ _ _ _ _ _
Cards from Applications on
IBM
~
'I
1 "
,
\]
Distribution Summary
Report
Distribution Summary
Cards
Transaction Date
Journal Vouchers
Punched Journal Voucher
Cards
Gen. Ledg. Summ.
.;
Cards from IBM Applications
c::J
Reference NumberDivision District Branch Dept.
[image:12.613.54.565.47.696.2]Journal Ent. No. Check No. Invoice No.
Figure 5. The general ledger entry.
Gen. Ledg. Cards Punched from Journal Vouchers
All Accounting Entries for Closing
Reports and the Gen. Ledger
DESCRIPTION
Account Number
Cash Receivables Inventories Fin. Goods Work in Process Labor in Process Adm. Expense Mtl. in Process
Prepunched Journals (Punch Amount if
necessary)
Gen. Ledg. Cards from Prepunched
Journals
Source of Entry
Journal Vchs. Payroll Mat. & Supls. Accts. Pay. Petty Cash Sales Accts. Rec. Cash Receipts Cash Disbrs.
18828562 NET AMOUNT
Trial Balance
At the end of each accounting period, a listing of all the general ledger accounts is prepared. This trial bal-ance will establish the accuracy of the entries to the general ledger and provide the opportunity to make adjusting and dosing entries.
The general ledger cards, in account-number sequence, are removed from the file. Then they are merged with the account balance cards from the last accounting pe-riod. These cards are processed in the accounting ma-chine, and the trial balance is written (Figure 6). The trial balance shows each account balance, current month entries both "debit and credit, and the new account bal-ance.
Your accounting department will examine this work-ing trial balance for deviations, evidence of error, or
variance from complete balance. Then they will make the adjusting and closing entries. They prepare a jour-nal voucher for these entries, and punch the necessary cards. The cards are listed by account number, and the listing becomes a supplement to the trial balance.
Sometimes information is not available until the trial balance has been prepared. For instance, you must have the total cost of a service department before final dis-tribution of charges to other departments can be made. Data of this type, handled as closing entries, completes the entries for the current accounting period.
So this completes the trial balance-a complete, accu-rate accounting of your company's operations up to date. Management reports can now be prepared. Usually the first of these is the income statement.
ODIN
BROCKTON PLANT GENERAL LEDGER0 TRIAL BALANCE 0
0 SHEET _L_OF_-±- ACCOUNTING PERIOD ENDING JUN 30 196- 0
u"" w zw
CURRENT MONTH'S ENTRIES BALANCE FORWARD
~ ~~ ACCOUNT
0 DATE ;;> W;;>
NUMBER DESCRIPTION OF ENTRY 0
~ ~z DEBITS CREDITS NET CHANGE NEW BALANCE'
0 5/31/6- 111 CASH BAL FWC 'Ii 1,727,436.65 0
6/15/6- 7 1296 111 CASH RECEIPT $ 189,318.24
0 6/15/6-6/29/6- 8 7 1299 1305 111 III CASH DISBURSEMENT CASH RECEIPT $ 693,747.22 :Ii 274,726.62 0
6/29/6- 10 1321 III JOURNAL ENTRY $ 191,634.71
0 6/29/6- 8 1332 111 CASH DISBURSEMENT $ 516,726.50 0
6/29/6- III BALANCE $ 883,065.46~$ 983,087.83*~ 100,022.37- $ 1,627,414.28
0 0
5/31/6- 112 ACCOUNTS RECEIVABLE BAL FWC $ 1,312,676.24
0 6/15/6-6/29/6- 9 7 1295 1317 112 112 SALES CASH RECEIPT $ 551,189.75 $ 923,550.11 0
6/29/6- 9 1304 ll2 SALES $ 684,733.59
0 6/29/6- 112 BALANCE $ 1,235,923.34*$ 923,550.11*~ 312,373.23* $ 1,625,049.47* 0
0 5/31/6- ll3 RESERVE FOR BAD DEBTS BAL FWC $ 15,821.40 0
6/29/6- 10 1324 ll3 JOURNAL ENTRY :b 3,162.15
0 6/29/6- 113 BALANCE $ 3,162.15*$ 3,162.15- $ 18,983.55* 0
0 5/31/6- 114 NOTES RECEIVABLE BAL FWC $ 267,155.22 0
6/29/6- 10 1297 114 JOURNAL ENTRY $ 5,139.45
0 6/29/6- 114 BALANCE $ 5,139.45* $ 5,139.45* $ 272,294.67* 0
L----
---<--
-
--
'---Figure 6. A check of all transactions this accounting period.
[image:13.615.48.547.340.670.2]Income Statement
Corporations whose securities are sold on the open mar-ket must file their income statements with the Securities and Exchange Commission. The Commission's rigid re-quirements result in a standardization of detail and completeness of these income statements.
However, other businesses vary considerably, especially if their statements are not subject to regular examina-tion by outside agencies. This is not due to intent to limit the information presented, but because of the time and expense involved in maintaining detailed accounts and the resulting detailed income statements.
The IBM method of processing data makes it possible
to handle large amounts of detail quickly and at low cost. When the trial balance has been Icompleted and proved, the cards that were used to prepare the trial balance and the closing entries are separated-income items from balance sheet items. You can separate them quickly by sorting on the account-code digit that desig-nates each type of item.
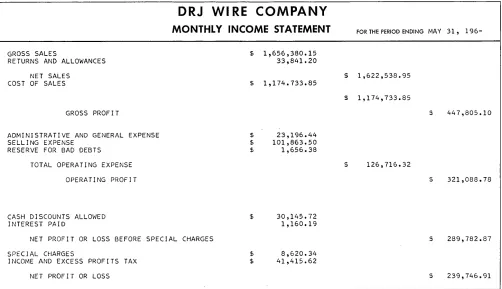
A satisfactory income statement (Figure 7) contains three broad sections:
1. Gross Profits 2. Operating Profits 3. Profit and Loss
GROSS PROFITS
When the income cards were separated from the other general ledger cards by the high speed sorter, they re-tained account-number sequence.
The accounting machine accumulates, adds, subtracts and prints the totals for the income statement in one operation. Now the income statement is ready for analy-sis by management.
The gross profit section points out volume of sales, ratio of returns and allowances to gross sales, cost of the product sold, and the relationship of profit to dollar volume of sales.
DRJ WI RE COMPANY
MONTHLY INCOME STATEMENT
FOR THE PERIOD ENDING MAY 31, 196-GROSS SALESRETURNS AND ALLOWANCES
NET SALES COST OF SALES
GROSS PROFIT
ADMINISTRATIVE AND GENERAL EXPENSE SELLING EXPENSE
RESERVE FOR BAD DEBTS
TOTAL OPERATING EXPENSE
OPERATING PROFIT
CASH DISCOUNTS ALLOWED INTEREST PAID
NET PROFIT OR LOSS BEFORE SPECIAL CHARGES
SPECIAL CHARGES
INCOME AND EXCESS PROFITS TAX
[image:14.612.63.565.372.661.2]NET PROFIT OR LOSS
Figure 7. The three basic sections.
$ 1,656,380.15 33,841.20
$ 1,174.733.85
$ $
$
$
$
$
23,196.44 101,863.50 1,656.38
30,145.72 1,160.19
8,620.34 41,415.62
$ 1,622,538.95
$ 1,174,733.85
$ 447,805.10
$ 126,716.32
$ 321,088.78
$ 289,782.87
OPERATING PROFITS
The items in this section are shown here in condensed form. To the executive reading the income statement, these items are significant as trends in the company's operations. Excessive amounts in any of these items affect the profitable operation of the company. When this is apparent, you will want a complete breakdown of all the items that made up the questionable total for ex-planation or correction of an undesirable situation. The
flexibility of the IBM method of processing data makes
such detailed supplementary reports quickly available.
PROFIT AND LOSS
This is one of the most important aspects of a business -and the test frequently applied to determine efficiency in operation. That is why extreme care must be used to insure that every factor affecting profit and loss has been included in the income statement. Management decisions are vitally affected by the statement of profit and loss; it must be accurate and up to date.
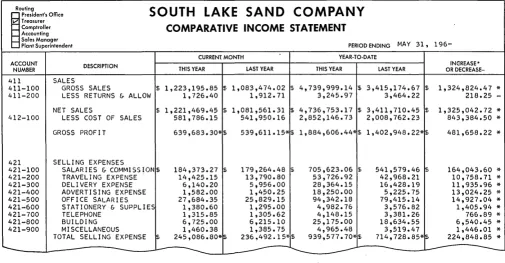
COMPARATIVE STATEMENTS
In addition to showing total income less expenses, income statements can show comparisons between the current period and a similar period the previous year,
or the previous accounting period; year-to-date figures can be shown, and variations between the comparisons printed for easy analysis. Furthermore, a comparative income statement (Figure 8) can show any combination of these analytical aids to management.
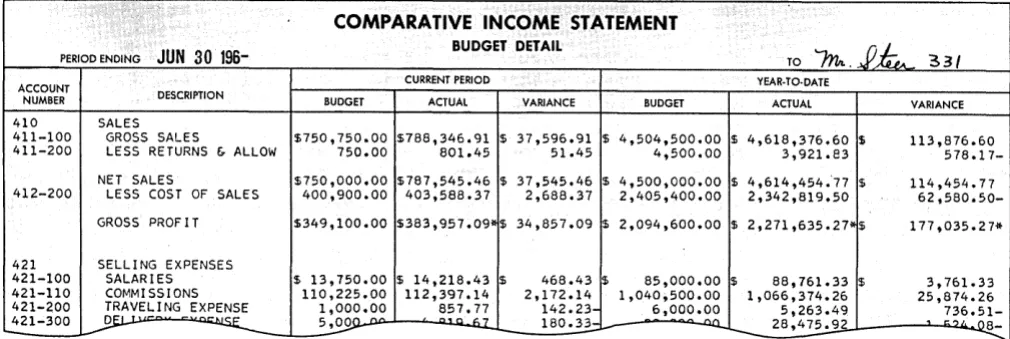
BUDGET DETAIL
Another significant advantage of the IBM method of
preparing income statements appears in budgeting. Your organization may operate under a careful planning and budgeting system. At the end of each accounting period, you will want to know your budget status.
If your original budget was punched in IBM cards,
these cards are merged with the general ledger income cards for the first accounting period. Then the income statement can be prepared with a comparison between actual figures and budget figures. The variance is shown, and management retains firm control over the company's operations (Figure 9) .
While the cards are processed and the accounting machine prints the statement, the summary punch pre-pares summary cards. These cards will then be used in the preparation of the statement for the next accounting period; budget and year-to-date figures will be current on every statement thereafter.
Routing
~
President's OfficeV Treasurer Comptroller Accounting
SOUTH LAKE SAND COMPANY
COMPARATIVE INCOME STATEMENT
Sales Manager
PERIOD ENDING MAY 31,
196-Plant Superintendent ACCOUNT NUMBER 411 411-100 411-200 412-100 421 421-100 421-200 421-300 421-400 421-500 421-600 421-700 421-800 421-900 CURRENT MONTH DESCRIPTION THIS YEAR LAST YEAR
SALES
YEAR-TO-DATE
THIS YEAR LAST YEAR OR DECREASE-INGREASE*
GROSS SALES $ 1,223,195.85 $ 1,083,474.02 $ 4,739,999.14 $ 3,415,174.67 $ 1,324,824.47 *
LESS RETURNS & ALLOW 1,726.40 1,912.71 3,245.97 3,464.22 218.25
-NET SALES $ 1,221,469.45 $ 1,081,561.31 $ 4,736,753.17 $ 3,411,710.45 $ 1,325,042.72 *
LESS COST OF SALES 581,786.15 541,950.16 2,852,146.73 2,008,762.23 843,384.50 *
GROSS PROFIT
SELLING EXPENSES
SALARIES & COMMISSION$ TRAVELING EXPENSE DELIVERY EXPENSE ADVERTISING EXPENSE OFFICE SALARIES STATIONERY & SUPPLIES TELEPHONE
BUILDING MISCELLANEOUS
TOTAL SELLING EXPENSE \$
-639,683.30'" $ 539,611.15i1$ 1,884,606.44'" $ 1 ,402,948. 22i1$
184,373.27 j$ 179,264.48 $ 705,623.06 $ 541,579.46 ~
14,425.15 13,790.80 53,726.92 42,968.21
6,140.20 5,956.00 28,364.15 16,428.19
1,582.00 1,450.25 18,250.00 5,225.75
27,684.35 25,829.15 94,342.18 79,415.14
1,380.60 1,295.00 4,982.76 3,576.82
1,315.85 1,305.62 4,148.15 3,381.26
6,725.00 6,215.10 25,175.00 18,634.55
1,460.38 1,385.75 4,965.48 3,519.47
245,086.80*~ 236,492. 15~ $ 939,577.70i1$ 714,728.85*\$
-
-
-
-481,658.22 *
164,043.60 * 10,758.71 * 11,935.96 * 13,024.25 * 14,927.04 * 1,405.94 * 766.89 * 6,540.45 * 1,446.01 * 224,848.85 *
[image:15.613.42.547.411.674.2]COMPARATIVE INCOME STATEMENT
JUN 30 196- BUDGET DETAIL
m.jJ~
PERIOD ENDING TO 331
ACCOUNT CURRENT PERIOD YEAR·TO·DATE
NUMBER DESCRIPTION BUDGET ACTUAL VARIANCE BUDGET ACTUAL VARIANCE
410 SALES
411-100 GROSS SALES $750,750.00 $788,346.91 $ 37,596.91 $ 4,504,500.00 $ 4,618,376.60 $ 113,876.60 411-200 LESS RETURNS & ALLOW 750.00 801.45
NET SALES $750,000.00 $787,545.46 $
412-200 LESS COST OF SALES 400,900.00 403,588.37
GROSS PROFIT $349,100.00 $383,957.09~$
421 SELLING EXPENSES
421-100 SALARIES $ 13,750.00 $ 14,218.43 $ 421-110 COMMISSIONS 110,225.00 112,397.14 421-200 TRAVELING EXPENSE 1,000.00 857.77 421-300 ~ 5,00n n . "l....6..l.. ....
[image:16.613.60.565.52.221.2]....
Figure 9. Budget operations at a glance.
BRANCH INCOME
After your consolidated income statement has been processed, you can prepare individual income statements for branches, divisions, departments, or any subclassifica-tion punched in the cards.
The general ledger income-item cards can be sorted for the breakdown being studied, and individual income statements prepared (Figure 10).
In addition to showing comparative and year-to-date figures, the illustration includes a percentage column. The figure appearing in this column is the percentage of gross sales represented by each expense item.
Arranged in sequence for income-statement wrItmg, the general ledger cards are processed in a calculating punch to compute the percentages.
51.45 4,500.00 3,921.83
578.17-37,545.46 $ 4,500,000.00 $ 4,614,454;77 $ 114,454.77 2,688.37 2,405,400.00 2,342,819.50
62,580.50-34,857.09 $ 2,094,600.00 $ 2,271,635.27*$ 177,035.27*
468.43 $ 85,000.00 $ 88,761.33 $ 3,761.33 2,172.14 1,040,500.00 1,066,374.26 25,874.26
142.23- 6,000.00 5,263.49
736.51-180.3~L-- "" 28,475.92 ' "',.,
~
---This type of report provides the basis for a rapid and discerning analysis of the operations of each unit of your business. Comparisons are drawn between similar periods and between various units. Furthermore, each unit becomes aware of its achievements compared with those of the other units. This awareness is an added factor contributing to successful operation. With the income statements prepared, you have established the result of your company's operations for the current pe-riod-profit or loss.
This amount of net profit or net loss will affect the net worth of the business at the close of this accounting period. So a card is punched with the amount of profit or loss, and included with the cards that you use to prepare the statement of all assets, liabilities and net worth-the balance sheet.
STORE LOCATION 'RICHMOND
D
&
R
ECONOMY STORES
STORE
INCOME
.ANDEXPENSE
MONTH JULYACCT. INCOME AND EXPENSE
500 SALES. .. . 501 BEGINNING .INVENTORY 505 PURCHASES
506 ENDING<INVENTORY
[image:16.613.56.562.514.674.2]CURRENT MONTH
Figure 10. Unit operations highlighted.
%
$140t200.07~
'2tt;, 334. 00:
:'92,015;57
·,2P;507.70-SAME MONTH
LAST YEAR
$19,500.00-'24,500.00 9,:315.00 22,375.00"';
Balance Sheet
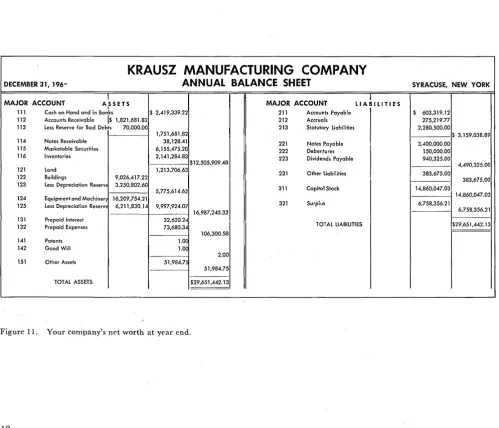
The net worth of a business on any given date is the difference between its assets and liabilities. The balance sheet summarizes all the assets; then it summarizes all the liabilities, plus surplus. (Figure 11.)
Monthly or annual balance sheets are written with the same ease of operation that characterizes all other reports prepared by the IBM data processing method. After we had prepared the trial balance for the current accounting period, we separated the general ledger income-item cards from the balance sheet items simply
~y sorting the account code.
Now we merge the account name cards with the balance sheet cards in a high speed collator. Then this file of cards is processed in the accounting machine to write the balance sheet.
Balance sheets, like income statements, can be written
several ways: increase or decrease can be shown by comparison with a similar period last year; percentages over or under can be shown in comparison; or varying degrees of detail can be used (Figure 12) .
If you want comparisons, account summary cards from the same period of the previous year can be merged with the balance sheet cards at the same time as the account name cards. Further, if you would like to show percentages, the calculations can be done on a calculating punch before the cards are processed in the accounting machine. Then, while the balance sheet is being written by the accounting machine, a summary-punching operation prepares new summary cards for the current totals by account number. These new summary cards are filed and used to write the comparative bal-ance sheet for the same period next year.
KRAUSZ MANUFACTURING COMPANY
DECEMBER 31,196- ANNUAL BALANCE SHEET SYRACUSE, NEW YORK
I I
MAJOR ACCOUNT ASSETS MAJOR ACCOUNT LIABILITIES
I
211 Accounts Payable $ 603,319.12 111 Cash on Hand and in Banks $ 2,419,339.22
112 Accounts Receivable 1$ 1,821,6B1.82 212 Accruals 275,219.77
113 less Reserve for Bad Debts 70,000.00 213 Statutory liabilities 2,280,500.00
1,751,681.82 $ 3,159,038.89
114 Notes Receivable 38,128.41 221 Notes Payable 3,400,000.00
115 Marketable Securities 6,155,475.20 222 Debentures 150,000.00
116 Inventories 2,141,284.83 223 Dividends Payable 940,325.00
$12,505,909.48 4,490,325.00
121 land 1,213,706.63
231 Other liabilities 383,675.00
122 Buildings 9,026,417.22 383,675.00
123 less Depreciation Reserv 3,250,802.60
311 Capital Stock 14,860,047.03 5,775,614.62
14,860,047.03 124 Equipment and Machiner 16,209,754.21
321 Surplus 6,758,356.21
125 less Depreciation Reserv 6,211 ,830.14 9,997,924.07
6,758,356.21 16,987,245.32
131 Prepaid Interest 32,620.24
TOTAL LIABILITIES $29,651,442.13 132 Prepaid Expenses 73,680.34
106,300.58
141 Patents 1.0C
142 Good Will 1.0C
2.00
151 Other Assets 51,984.7!
51,984.75
TOTAL ASSETS $29,651,442.13
Figure 11. Your company's net worth at year end.
[image:17.615.44.544.289.717.2]111 112 113 114 115
HASTING-WHITE TOOL COMPANY
COMPARATIVE BALANCE SHEET
PERIOD ENDING! JUNE 30.
196-DESCRIPTION
ASSETS CASH AND RECEIVABLES
CASH $
ACCOUNTS RECE1VABLE RESERVE FOR BAD DEBTS NOTES RECEIVABLE MARKETABLE SECURITIES
INVENTORIES
~OT$
PREVIOUS MONTH THIS YEAR
15,673.3B $
32,967.21 329.57-1,000.00 2,164.30 51,475.22* s
CURRENT MONTH
THIS nAR LAST YEAR
16,739.73 $
33,291.18
332.91-5,898.l3 55,596.13* $
15,248.61 :[, 32,968.32
329.68-1,500.00 3,673.21 53,060.46* $
OVER" OR
UNDER-1,'191.12 * 322.86
i:-3.23 *
1,500.00 -2,224.92 -;} 2,535.67*-**
% OVER" OR
UNDER-9.8 *
.9 *
.9
-:f-100.0 --60.6 *
116 INVENTORIES $ 183,621.83 $
01$ 183,621.83* $
161,298.67 $ 149,238.61 $ 12,060.06 * B.1 *
161,298.67* $ 149,238.61* $ 12,060.06i!-**
LAND AND BUILDINGS
121 LAND
122 BUILDINGS
123 RES. FOR DEPREC.
EQUIP. AND MACHINERY
124 EQUIP. AND MACHINERY
125 RES. FOR DEPREC.
DEFERRED CHARGES
131 PRE-PAID INTEREST
132 PRE-PAID EXPENSE
133 CONTRACT EXPENSE
INTANGIBLE ASSETS
141 PATS.,COPYRIGHTS,ETC
142 OTHER INTANGIBLES
143 RES.TO AMORT.INTANG.
OTHER ASS
151 MISCEL
$ OT$ $ on $ OT$ $ 2,116.45-2,116.45- $
10,873.9B $
3,245.67-7,628.31* $
1,231.19 $
1,231.19* $
1,333.9B $
OT$ 1,333.98* $
50,238.96
2,363.74- $
47,875.22,1- $
8,339.61 $
3,469.22-4,870.39* $
1,348.16 $
1,348.16* $
1,026.93 $
1,026.93* $
$ 50,238.96
-:f-1,767.88- 595.86 *
1,767.88- $
49,643.10*H-16,298.38 $ 7,958.77
-2,975.12- 494.10 *
13,323.26* $ 8,452.87*--"
1,741.93 $ 393.77
-1,741.93* a: 393.7711--*
1,238.97 $ 212.04
-1,238.97* $ 212.04*-*
COMPARATIVE BALANCE SHEET
* 33.7
il48.8 -16.6 *
22.6
-17.1
-PERIOD ENDING
NOV 3 0
196-TOTAr---,,---~---~----_.---._---~---~
ACCOUNT
DESCRIPTION END OF DECEMBER 31 INCREASE*
N.UMBER CURRENT MONTH LAST YEAR OR
DECREASE-LIAB 11 CURRENT ASSETS
CURRENT L 111 CASH $1,219,884.07 $1,304,176.42
211 ACCOUN
$1,219,884.07* $1,304,176.42* $ 84,292.35
-~~
112 ACCOUNTS RECEIVABLE $1,623,246.12 $1,510,132.15
113 LESS RESERVE 18,163.20 17,115.23
$1,605,082. 92-l.~ $1,493,016.92* $ 112,066.00 -:~
114 NOTES RECEIVABLE $ 271,332.20 $ 269,473.42
$ 271,332.20* $ 269,473.L;2* $ 1,858.78
*
116 MERCHANDISE INVENTORY $2,902,170.32 $2,810,278.90
117 LESS RESERVE 32,695.15 29,146.45
$2,869,475.17~.l- $2,781,132.45-:t- $ 88,342.72
*
TOTAL CURRENT ASSETS $5,965,774.36* $5,847,799.21';:- $ 117,975.15
~(-12 FIXED ASSETS
121 LAND $ 312,469.43 $ 312,469.43
$ 312,469.43>:' $ 312,469.43-*
*
'.'--:-- 122 BUILDINGS $2,149,939.67 $2,140,961.80
,,:.~ I ~~~ ,
.'
-
986,225.05 978 7The General Ledger
The final statements have been prepared. The general ledger account cards were used to prepare the trial balance. Adjustment and correction cards were punched and a supplement was prepared to prove and update the accounts for the current accounting period. The cards were separated into two groups: income-item cards and balance sheet cards. The income statement and the balance sheet are finished, and now you are ready to process the general ledger.
All the cards-income items, balance sheet items, ac-count balance summaries, adjustment and correction cards-are part of general ledger processing. Your
op-erator merges all these cards into a single group arranged
in account-number sequence. Then the accounting ma-chine writes the general ledger in one operating process. As the machine prints each new account balance, a summary punch prepares a new account balance card to be used for the next period's trial balance, income statement, balance sheet and general ledger.
Actual form of the general ledger varies according to the needs of each individual business. Some of the more common (Figure 13) are shown here:
1. A separate sheet each month for each major account.
2. A continuous listing of all ledger entries each month. 3. A facsimile-posted ledger card for each major
ac-count.
KRAUSZ MANUFACTURING COMPANY GENERAL LEDGER
MAJOR ACCOUNT 421
ACCOUNT TITLE
GENERAL AND AMINISTRATIVE EXP SALARIES
GENERAL AND OVERTIME TEMPORARY
TRAVELING EXPENSE
NATIONAL PRODUCTS COMPANY GENERAL ACCOUNTING REGISTER
IES
SHEET L OF /1
ACCOUNT NUMBER
GENERAL SUB.
111 111 111 111 112 113 113 113 113 113 113 651
OPENING BALANCE
IP 134,033.34
~ 3,989.76
~ 62,205.91
REPORTNO.~ tkh al /96
CURRENT MONTH REFERENCE
YOU ACCOUNT REP. NUMBER
i
802113: 802511: 10~211: ,
, , 1 , 702311: 7103121 802000' 710313: 710174:
DEBIT OR CREDIT
$ 166,685.71 850.00
188,694.45-21,158.74- $
*
$ 175,506.15 1,492.59- 168,990.89- 401.83-184.51 4,805.35* 1$
CLOSING BALANCE
112,874.60* 3,989.76* PLIES
-MINOR ACCT. CODE179 $ 195 300 400 410 507 508 510 740 770 771 781 $
SEPTEMBER
196-CURRENT MONTH
BEGINNING BALANCE CLOSING BALANCE DEBIT CREDIT
277,001.71 $ 26,126.20 ~ 1,974.93 $ 301,152.98
5,939.59 389.24 6,328.83
41,644.32 5,156.81 259.58 46,541.55 96,039,31 13,186.59 10.14 109,215.76
4,962.00 564.36 2.70 5,523.74
10,601.82 2,326.57 362.41 12,565.98
891.70 265.74 1,157.44
852.76 908.75 3.24 1,758.27
-
~~J VJ~
4 . ; -
-10,719.16 861.03 11 ,575.48
24,153.35 3,900.75 1,649.68 26,404.42
3,409.63 353.96 3,763.59
469.26 34.58 10.51 493.33
660,659.57* $ 82,436.91* ~ 6,364.95* $ 736,731.53*
114 114
$ 101.25
, , ,
121423: $ 872.50- A~t6~~T i i i 1111
I
CASHGENERAL LEDGER MAJOR ACCOUNT i i i
116 $ 5,850.00 , , 1 , , 1 121 $ 158,950.49 ,
872.50- [$
* Il 12/31 1115 1/15
$ 1,1~ 1/31
' f i b ~
1/31 ~---,~ ____ ~71~0_3~_21_' __ ~~~~
1/31 1/31 2/15 2/15 2/28 2/28 2/28 2/28 --2..Ll5
Figure 13. General ledger forms to fill every need.
14
III 7 1210 111 8 1215 III 10 1232 III 7 1239 III 8 1242 III III 7 1259 III 8 1262 III 7 1276 111 8 1278 III 10 1281 III
III 7 ~.,a,"L....:...1
BALANCE FORWARD CASH RECEIPT CASH DI SBURSEMENT JOURNAL ENTRY CASH RECEIPT CASH DISBURSEMENT
BALANCE FORWARD CASH RECE I PT CASH DISBURSEMENT CASH RECEIPT CASH DISBURSEMENT JOURNAL ENTRY
BALANCE FORWARD Y.S ~CD"T
CURRENT MONTH ENTRIES
CREDIT DEBIT
$296,820.32
$298,615.45 40,132.60 601,248.73
598,122.15 $898,069.05* $936,870.20*
$290,124.32
$295,463.10 625,195.20
620,163.25 49,256.04 $915,319.52* $964,882.39*
...:l.£() 420.13
[image:19.617.43.554.248.666.2]-A TYPIC-AL GENER-AL LEDGER OPER-ATION
Trial Balance
Acct. Mach.
Journal Vouchers
Acct. Mach.
IncomewState. Items
Balance Sheets
Financial Control
Basic accounting documents like the income statement, balance sheet and general ledger are very important to your organization. But just as important are the operat-ing and administrative reports that can help manage-ment get clearer insight into the factors that affect profit and loss.
It is true that compiling detailed and varied operating and administrative reports takes time and money. Yet these contain the data that may mean the difference between profit and loss. And the IBM method of process-ing this data removes the objections of time and money. The needed information is already in your files in the form of punched cards and the facts can be tabulated, rearranged by any classification, and used to produce valuable and significant reports.
/
501 500 CLEVELANDACCOUNT NO.
I I I I I
316-1
12I'IIUN I HI YEAR BRANCH
I
BRA~R ACCOUNT NAMEDAlE NUMBER
At the end of each accounting period, the detail and expense cards used in the general ledger procedure are filed. Periodically, all this material can be summarized by account, subaccount, division, department, branch, or any other classification.
If the summarized data is coded into punched cards, these operating report cards (Figure 15) result in re-duced card volume, faster report processing, and greater economy of time and money. Furthermore, we can now calculate income and expense ratios and percentages quickly and accurately in a calculating punch.
The operating report card shows current and year-to-date expense and revenue. It also shows the ratio of ex-pense to revenue. And the entire process is an automatic machine operation.
CURRENT 348226 3081642 .113
MONTH ... ... ... ...
....
YEAR
TO I O~75 ... 89
-<Il1o. 93 .... 470 ... 49 .1 , I
DATE
....
EXPENSE AMOUNT REVENUE AMOUNT % "Yo"N,t
REVENU.
1100000000000
IQ
0II
000 100000000000000000001110:00 0:0 0l~ 0 ,,000,00000 11:101000,00 I~:~ 0 OiD 0 01
0 0 000 1 2 3 4 5 6 7 8 9 10 11 12 13 14 15 16 17 18 19 2021 22232425262728293031 323334 35 36 37 38 39 40 41 4243144 45 411147 411 495051,525354,55 56 57 58 59 601616263164656616768 69\707672173747517677 7879800
W 11 1 111 1 1 1 1 1 1 111 1 1 1 1 11 1 1 111 1 1 1 11 1 1 111 1 1 1 1 1 1 1
P
11'1 1 1 1 1111111 1111 11111111111 1,1 1 111 1 111 1III
-u...I I I I
2:2 2 2:2 2 2:2 2
IT!
0 I : I I ::0
U 2 2 2 2 212 2 2 2 2 2 2 2 2 2 2 2 2 2 2 2 2 2 2 2 2 2 2 2 2 2 2 2 2 2 2 2 2 2 2 2 212 21,12 2 2 212 2 2 :212 2 2 2:222:22 2122 222 ~
0 I I I I I I I I I Z
z
313 3 3 3 3 3 3 3 3 3 3 3 3 3 3113 3 313 3 3 3 3 3 3 3 3 3 3 3 3 3 3 3 3 3 3113 3 313 3 313i3 3 3:3 3 3 31 3133311 33 :3 3 31331133313 3 3 3 3 G>
«
I I I I I I I
I
;u0::
4444444444444444444444444144444444444444444:144:444 4 414 4 414 444 4:444:444144 4144411444 444 IT!
W -u
~
I I ,- 0
« I I I I I I I ;u
m
55 5 55555555155155551115515555555555555 5 5 5 5 5:5 551555 551555:55555 51555,551,55 5
'5551555 155 5 5 5 --l
0::"
I I I I I I I I I (")
w
6:666:661:66 6 6 6 l> ~ 6616666666666666666666666666666666666666666,666'616 6 6\6 61,6 6 666 616661666166 ::0
« 0
m I I I I I I I
I I
I
I 7 7 7 7 7 7 7 7 7 7 7 7 7 7 7 7 7 7 7 7 7 7 7 7 7 7 7 ~ 7 7 7 7 7 7 7 7 7 7 7 7 7 7 717 7 717 7 7 7 717 7 717 7 7 7 7 7177 7h 17 177 717 7 717 717 7 7 7 7DATE BR. NO. REF~~~NCE . AC~~~NT BRANCH OR ACCOUNT NAME _.C.WRRENT MONTH YEAR TO DATE
88 8l8. 8i8 818 8 81. 8 818 8 888 818 8 818 8 8118 818 8 818 8 818 8 8 8 8 18888 18 8 188 8 8 8 888888 88888888888888888888888
MAJ. SUB. Ef:6a~f 'AEJJ~~TE % ~*lo1JNNSTE ~1loEUNN~E % 9999 99 99999 999999 99999999999999999999999 99 9i9 9 9!9 9 9 9 9'9 9 919 9 9 9 9 9'999 199 919& 919~919 9 9!91i 9 9 9
[image:21.613.39.549.310.531.2]1 2 3 4 5 6 7 8 9 1011 1213 1415 16 17 18 1920 2 22 232425262728 2U!!.1l 323334 3536 37 3i39 40 41 42~45 41i14L~~5:I54i55 56 57 58 59 60'61 6263 64 65666768 6WO 71 72,73 74 75 76 77 78 79 80
Figure 15. Complete flexibility for use of data.
Expense and Revenue
Comparisons of expenses and revenue are reliable indi-cators of the soundness of a business. So expense-to-revenue reports of all kinds have significance to the policy-making executives of your company. These re-ports are available on the basis of any category or classi-fication punched in the card. Let's look at some of the more common uses.
Corporate officers are interested in an expense-to-revenue analysis on a company-wide basis. All the gen-eral ledger cards, processed in a calculating punch for ratio computations, affect this study (Figure 16).
0 HARKNESS,
By comparing branch or division expense-to-revenue percentages, top management and branch managers keep informed about efficiency or lack of efficiency. The na-tional average is quickly established during the calculat-ing punch operation and becomes a standard for evalu-ating the individual company units.
If the listing of the expense-to-revenue figures is
ar-ranged by low-to-high sequence, the national average card clearly marks the dividing line between above-average and below-above-average offices. This makes it possible to devote careful attention primarily to those units that are experiencing substandard operations (Figure 17).
HOLLOWITH & CO.
0
EXPENSE-TO-REVENUE STATEMENT
0 0
PERIOD ENDING DECEMBER 31,
196-0 CURRENT YEAR LAST YEAR 0
ACCOUNT DESCRIPTION % O~ ",,0 OF INCREASE' % INC.'
0 AMOUNT .~~~~ AMOUNT S~~~ OR DECREASE- OR DEC.- 0
1.11 NET SALES $ 673,906.B6 100.( $ 625,818.04 00.( $ 48,08B.82* 7.7*
0 412 COST OF SALES $ 468,929.58 69.' $ 441,134.22 70.' $ 27,795.36* 6.3* 0
0 GROSS PROFITS $ 204,977.28 30.~ $ 184,683.82 29. ~ $ 20,293.46* 19.9* 0
0 423 SELL! NG EXPENSES $ 32,863.65 4.S$ 31,627.43 5.1$ 1,236.22* 4.0* 0 ~ 424 GENERAL EXPENSES $ 29,743.18 4.~$ 30,814.39 4.Y$ 1,071.21-
3.5-~
_ _ _
~L----Figure 16. The company's progress at a glance.
0
BAKER, BAKER AND COLE INC. BRANCH OFFICE ANAL YSIS EXPENSE RATIO ST ATEMENT0
0
EXPENSE CLASS PERIOD ENDING MARCH TOTAL 31, 196-0
CURRENT MONTH YEAR·TO-DATE
0
BRANCH DESCRIPTION % EXP. % EXP.0
TOTAL REVENUE EXPENSES TO REV. TOTAL REVENUE EXPENSES TO REV.0
41 35 WASHINGTON ST. LOUIS 20,663.09 24,160.48 6,860.15 8,238.72 33.2 34.1 62,293.68 75,176.25 20,183.15 24,732.99 32.9 32.40
24 MI NNEAPOLI S 15,923.70 5,652.91 35.5 46,833.41 15,548.69 33.20
17 2 ALBANY DETROI T 48,234.52 26,784.90 15,627.98 10,281.85 32.4 35.4 149,145.73 73,422.16 49,814.67 24,596.42 33~4 33.50
18 GRAND RAPIDS 11,810.14 3,755.62 31.8 34,961.72 11,782.10 33.7
0
22 20 LOS ANGELES INDIANAPOLIS 59,312.88 19,777.25 19,336.00 6,744.04 32.6 34.1 160,175.26 56,712.44 19,395.65 5,445.96 34.0 34.20
13 DALLAS 14,145.86 4,866.18 34.4 38,550.19 13,184.16 34.2
0
36 27 SALT LAKE CITY NE\1 YORK 147,791.10 9,640.27 45,076.29 3,181.29 33.0 30.5 376,297.62 29,119.52 129,822.68 9,988.00 34.3 34.50
37 SAN FRANCISCO 66,844.75 20,922.41 31.3 184,571.14 63,861.16 34.6
0
32 PI TTSBLJRGH NATIONAL AVERAGE 33,526.19 11 ,264.80 32.8 33.6 96,349.27 33,625.90 34.8 34.90
"----,-- !9
OMAHA 8,731.41 3,117.11 35.7 2L~'~~~·~~ 7,609.80 35.1 [image:22.612.137.510.246.399.2]"""
-
---...:. , [image:22.612.62.567.457.666.2]Many companies with branch office or division opera-tion use comparative expense-to-revenue studies for each operational unit. Some others prepare these reports only for those subdivisions that are operating above the na-tional average. In any case, the desired reports are quickly available. The general ledger cards are selected by the branch or division code, and the appropriate cards processed in the accounting machine (Figure 18).
for expansion, relocation of facilities, and personnel programs.
Your machine accounting department can separate ex-pense-item cards from revenue cards simply by sorting group codes. Reports such as distribution expense, administrative expense, cost-of-production summaries, rents, furniture and fixtures, can be written (Figure 19). As -these reports are written by the accounting machine, the summary punch prepares current summary cards to be used in the comparative figures for the next report. The cards will also supply year-to-date figures as they accumulate and are in turn summary-punched.
Financial officers have individual preferences for anal-ysis reports. And these preferences can be satisfied if the
data involved has been processed by the IBM method.
F or instance, a study of office expenses on a company-wide basis will be of significance and will affect planning
----;--- - I- - -
-o
I BAKER, BAKER AND COLE INC.NEWARK BRANCH
COMPARATIVE REPORT OF REVENUE AND EXPENSES
o
o
0
PERIOD ENDING rl\ARCH 31,
196-o
I CURRENT MONTH YEAR-TO-DATE,
0
'BRANCH ACCOUNT NUMBER DESCRIPTION % INC.* % INC.* ,
THIS YEAR LAST YEAR ORDEC.- THIS YEAR LAST YEAR OR DEC.-I
25 411 SALES I
o
0
25 411-100 NET SALES $ 30,816.42 $ 29,790.65 3.4-11 :5 93,476.49 $ 88,132.17 6.1*
25 411-100 LESS COST OF SALES 15,175.15 16,050.40 5.5- 46,104.26 44,196.40
6.3-:1-GROSS REVENUE $ 15,641.27-11$ 13,740.25-11 v(3.
ro1
o 47,372.23*$ 43,935.77-11s10
y
1·
-
Io
0
o
0
25 423 BRANCH OFFICE EXPENSE
25 423-100 SALARIES-SALESMEN $ 1,595.36 $ 1,481.46 7.7*~ 4,510.50 $ 4,672.90
3.5-25 423-110 COMMISSIONS-SALESM 3,116.20 3,276.04 4.9- 9,473.17 10,040.25
5.7-o
0
25 423-200 TRAVELING EXPENSES 105.15 92.40 3.7* 409.26 560.24
27.9-25 423-300 DELIVERY EXPENSES 412.75 441.70 6.6- 1,403.05 1,501.36
6.6-25 423-310 FREIGHT OUT 96.10 106.32 9.6- 306.72 336.44
8.9-o
0
25 423-400 ADVERT! SING 175.90 83.10 111.1-11 640.11 701.10
9.2-25 423-500 SALARIES-OFFICE 3,482.26 3,261.44 7.9i( 10,375.89 8,704.15 19.1*
25 423-510 SALARIES-BLDG.SERV 250 .l~5 238.75 5.<Y 760.24 720.04 ~ .6~;'
o
0
25 423-600 STATIONERY 184.60 160.32 15.1i( 540.20 543.15
.5-25 423-610 MISCELLANEOUS 73.25 80.40 8.9- 205.98 245.47
16.9-25 423-700 TELEPHONE SERV.LOC 176.88 180.16 1.8- 490.10 524.42
6.5-o
0
25 423-710 TELEPHONE SERV. TOll 90.17 86.73 4.0-11 200.63 237.01
15.4-25 423-720 TELEGRAMS 85.15 70.10 21.5i( 180.19 195.46
7.8-25 423-730 POSTAGE 97.30 92.15 5.6i! 205.84 296.75
36.3-o
0
25 423-810 RENT 1,244.31 1,250.00 .5>'l 3,750.00 3,750.00
*
25 423-820 LIGHT AND POWER 165.00 159.26 3.6-11 410.67 498.01
17.5-25 423-830 OFFICE REPAIRS 64 .l~9 56.17 14.8i! 205.32 256.73
20.2-o
0
25 423-840 DEPR.-FURN.AND FIX 79.20 70.16 12.9* 207.60 210.48
1.4-TOTAL BRANCH E ;<PENSES ~ 11,494.52-11$ 11 ,186.66*
fr~:~1o
.
~ 34,275.47-li$ 33,993.96* -\-.q10
$ 4,146.75-11$ 2,553.59;:-~.Ar1o
~ 13,096. 76{l $ 9,941.8J.*11
0
BRANCH NET INCOME ,?\ .
-\ -\-'".
o
0
o
0
o
0
- - - - . . J I - - - - -- --~--- --- --- --- --- - --- --- ---+
Figure 18. Pointing out reasons for operational improvement-or its lack.
[image:23.620.47.542.248.621.2]BAKER, BAKER AND COLE INC.
COMPARATIVE
A~
OF OPERATING EX
ACCOUNT BR. DESCRIPTION JANUARY FEBRUARY
MARCH
~
JUNE YEAR· TO·DATE NUMBER NO.421-600 ~TATIONERY
421-600 1 AKRON $ 40.20 $ 35.15 $ 33.01 $ 108.36
421-600 2 ALBANY 18.60 22.10 20.80 61.50
'421-600 :3 ATLANTA 50.25 5:3.15 56.15 159.55 421-600 4 BALTIMORE 101.2:3 105.96 96.20 303.39 421-600
BRANCH OFFICE
421-600
BAKER, BAKER AND COLE INC.
421-600
EXPENSE RATIO STAT
421-600
421-600 OFFICE SALARIES
421-600 RATIO OF Ef ~'iE
421-600 BRANCH OR BRANCH OFFICE OR ACCOUNT
421-600 ACCOUNT NO. JAN. FEB. MARCH APRIL ' MA OCT. NOV. DEC.
421-600 NATIONAL AVERAGE 11.9 11.5 11.0
421-600 1 AKRON 11.5 12.1 12.3
421-600 2 ALBANY 10.4 10.0 9.8
421-600 3 ATLANTA 12.5 12.3 12.6
\
421-600 4 BALTIMORE 14.1 13.8 14.6
BAKER, BAKER AND COLE INC.
BRANCH OFFICE
OFFICE SALARIES
PERIOD ENDING MARCH 31,
196-CURRENT MONTH BRANCH BRANCH. NAME
NO. REVENUE EXPENSES
36 SALT LAKE ClTY $ 4,299.34 $ 415.73
I: 35 ST. LOUIS 24,160.48 2,464.37
2 ALBANY 3,906.93 375.07
[, 17 DETROIT 48,234.52 4,437.58
13 DALLAS 8,547.34 820.54
18 GRAND RAPIDS 4,842.92 537.56 , 27 NEW YORK 225,499.95 25,255.99 24 MINNEAPOLIS 15,923.70 1,592·.37 32 PITTSBURGH 20,716.59 2,133.81 10 CHICAGO 99,968.03 11 ,396.36 37 SAN FRANCISCO 19,345.36 2,282.75 I, 12 CLEVELAND NATIONAL AVERAGE 30,816.42 3,482.26
~1 WASHINGTON ,,..
...
'" 20',663.09 2,252.28- t f l
...:a.--Figure 19. Flexible reporting to fill any need.
All General Ledger Cards
EXPENSE RATIO ST ATEMENT
YEAR·TO·DATE
%
E TO' R REVENUE EXPENSES
g.'I ~ 12,047.89 $ 1,144.55 10. ~ 75,176.25 7,216.92 9. E 12,924.73 1,266.62
9. ~ 149,145.73 15,063.72 9.E 25,330.95 2,583.76 11.1 14,486.41 1,506.59 11.2 683,988.76 73,870.79 10.( 46,833.41 5,104.84 10. ~ 62,714.30 6,835.86
ll.i! 300,432.16 32,747.11
11.8 60,346.25 6,577.74 11.1
11.3 93~476.49 10,375.89 10.9 62,293.68 7,039.19
..,,.. Q''::l. lJ. () ?.2
.;::u::.--Figure 20.
History
Records
______ :=-
___
~J ---l!iii.-~i% E TO R
9.5 9.6 ,9.8 10.1 10.2 10.4 10.8 10.9 10.9 10.9 10.9 11.0 11.1
1..L...2 ...
Operating Reports
Branch Office Reports
Expense to Revenue
Revenue Reports
Expense Reports
[image:24.617.60.566.46.451.2] [image:24.617.65.568.505.714.2]Budgets and Budgetary Control
Management planning is one of the most vital functions of your company's executive team. Business transactions are planned before they happen. Sales management sets a goal for next year's sales accomplishment-not a guess, but a calculated and attainable goal.
Production management plans an entire production program. Personnel anticipates your needs and plans for them. Equipment, buildings, furniture, office supplies, maintenance supplies, raw materials-an endless list of
planned requirements - are all studied, evaluated,
planned and budgeted.
PLANNING THE BUDGET
Your accounting department must mold all these varied plans and estimates into a single, workable man-agement tool called the master budget. In many cases
this can be an extremely difficult job. However, the IBM
method of data processing can reduce budget prepara-tion to a systematic and routine operaprepara-tion because of the flexibility of the basic unit of data-the punched card.
Let us examine a typical procedure for preparing a budget. Actual procedures vary greatly, but their basic idea is the same. Expense information is available in the general ledger files for every department or division in the organization. These cards are separated by
what-eVer classification determines a budget unit, and the
cards are processed in an accounting machine or a calcu-lating .punch to accumulate expense totals by classifica-tion, for the previous twelve months. At the same time, the machine prepares a summary card showing depart-mental identification, account name and number, present weekly budget, weekly expense during the last accounting period, and average weekly expense during the last twelve months.
You can see that now it is easy to prepare
standard-ized estimate sheets (Figure 21) for each department budget planner. With the data available to them, budget planners then post their requirements on the estimate sheets and return the sheets to accounting.
--
-'-- -- -
- -- -
- -- - - -
- - - --
- -- -
-- --
--- -
- --
- -- - -
- - - --
-- - -
-- -
- --- -
-- - -
--
- --'
----0 12 MONTHS ENDING SEPT 30 EXPENSE BUDGET ESTIMATE PURCHASING DEPT 210 0
0 ACCOUNT NAME ACCT. ESTIM. BUDGET 196- CURRENT BUDGET EXPENSE AVERAGE EXPENSE 0 NO. -WEEKLY----MONTHLY- PER WEEK 196- PER WEEK SEPT. PER WK. PAST YR
0 0
ADMIN & TECHNICAL ASST 204 69
0 CLERK BUYER & INTERVIEWER 222 233 I, 0 J':t. P7 /0,/.2"'1' 3,081 78 2,505 91 3,000 1,031 0
SECTY STENO & TYPIST 237 /5"(, 150 87 343
0 MACHINE & EQUIP MAINT 252 5 4 5 5
CLEANER & GARDENER 260 1 0
REWORK LABOR PRODUCT 280 S7'f 400 433 579
0 OTHER INDIRECT LABOR EXPEDITER 281 292 r 3 50 9 3 0
OVERT! ME PREMIUM 302 2- 15
0 OTHER SUPPLI ES MACH & EQUIP MAINT 409 455 . (
,
6 1 4 6 0DRAWING SUPPLIES 462 25 3
0 STATIONERY SUPPLIES PARTS SCRAPPED 468 472 .2,;1(, $ 1,300 1,349 131- 2,268 230 0
PARTS USED 473 .2 1 2
0 MACHINE MANUFACTURING & EQUIP MAINT 513 516 l·p! I 337 754 1 0
DUES & SUBSCRIPTIONS 523 r 5 9
0 OTHER FEES TRAVELING & SUBSIST 53·9 588 /60 .7 100 76 165 3 0
CASH DISCOUNTS 613 7
0 ACCTG MACHINE SERVICE REWORKING EXPENSE 671 846 "<7(J s c ... 225- 5 270-2 0
EMPLOYEE BENEFITS 881 448 48
OCCUPANCY 882 166 17
0 SERVICE OVERHEAD REDIS 895 .5" 1 5 0
[image:25.615.41.553.355.607.2]4. 6'65 /oJ /.2-1 4,905 5,653 8,306
Figure 21. Department managers estimate budgets on standard forms,
N ow high level management has standardized, read-able documents for review, comment and adjustment. Plans are beginning to crystallize on the basis of factual information. The figures are entered into the cards, and the preliminary budget can be prepared and distributed in a short time.
All people concerned with the budget have an addi-tional opportunity to suggest changes and adjustments in this preliminary budget. Any changes that are approved are entered into the budget cards. Then these cards are merged with the expense cards by means of a high speed collator operation.
Now a proposed budget can be written. It is listed by account number and shows the proposed weekly, monthly and total budget, the totals for the last twelve months, and the variance and percent-of-variance between recent experience and proposed budget.
-This is distributed once more. Your budget supervisor is especially interested in accounts showing significant variance from past experience. He has the opportunity, before the company has committed itself, to look for justification of any unusual situations. Furthermore, he can be aware of such unusual circumstances without spending time unnecessarily on accounts that are normal. This is a basic concept of management by exception, as it has developed from management's rapidly increasing workload.
Now all the reviews of the budget are completed, and corrections made. The final budget figures have been de-cided on and approved. Now the budget can be written on the accounting machine, and each department given copies of the section affecting its operations.
This budget can show the authorized weekly and monthly budget, and special monthly variations, and the total for the year (Figure 22).
;::t::: - - :.- - - -.- ---,
-0
PURCHASING DEPT 2100
0
ACCT. NAME ACCT. APPROVED BUDGET SPEC. MO. PROPOSED0
NO. WEEKLY MONTHLY VARIATIONS 196- TOTAL
0
BUYER & INTERVIEWER 222 1,097 10,124 175,2410
CLERK 233 82 4,018
0
SECTY STENO MACHINE&
EQUIP MAINT&
TYPIST 237 252 156 5 7,644 2450
REWORK LABOR PRODUCT 280 579 28,371
0
OTHER INDIRECT LABOR OTHER SUPPLIES 409 281 9 4 441 1960
MACH
&
EQUIP MAINT 455 6 2940
PARTS SCRAPPED PARTS USED 472 473 2,268 2 111,132 980
REARRANGEMENT 510 100 2,420- 2,480
0
MACHINE MANUFACTURING&
EQUIP MAINT 513 516 754 1 36,946 490
DUES
&
SUBSCRIPTIONS 523 9 4410
OTHER FEES TRAVELING&
SUBSIST 539 588 150 3 7,350 1470
ACCTG MACHINE SERVICE 671 5 245
0
REWORKING EXPENSE SERVICE OVERHEAD REDIS 846 270- 13,230-0
895