R E S E A R C H
Open Access
Who could benefit the most from using a
computer-aided detection system in full-field
digital mammography?
Na Young Jung
1, Bong Joo Kang
2*, Hyeon Sook Kim
3, Eun Suk Cha
4, Jae Hee Lee
5, Chang Suk Park
6,
In Young Whang
7, Sung Hun Kim
2, Yeong Yi An
8and Jae Jeong Choi
9Abstract
Background:The computer-aided detection (CAD) system on mammography has the potential to assist
radiologists in breast cancer screening. The purpose of this study is to evaluate the diagnostic performance of the CAD system in full-field digital mammography for detecting breast cancer when used by dedicated breast radiologist (BR) and radiology resident (RR), and to reveal who could benefit the most from a CAD application. Methods:We retrospectively chose 100 image sets from mammographies performed with CAD between June 2008 and June 2010. Thirty masses (15 benign and 15 malignant), 30 microcalcifications (15 benign and 15 malignant), and 40 normal mammography images were included. The participating radiologists consisted of 7 BRs and 13 RRs. We calculated the sensitivity, specificity, positive predictive value (PPV) and negative predictive value (NPV) for total, normal plus microcalcification and normal plus mass both with and without CAD use for each reader. We compared the diagnostic performance values obtained with and without CAD use for the BR and RR groups, respectively. The reading time reviewing one set of 100 images and time reduction with CAD use for the BR and RR groups were also evaluated.
Results:The diagnostic performance was generally higher in the BR group than in the RR group. Sensitivity improved with CAD use in the BR and RR groups (from 81.10 to 84.29% for BR; 75.38 to 77.95% for RR). A tendency for improvement in all diagnostic performance values was observed in the BR group, whereas in the RR group, sensitivity improved but specificity, PPV, and NPV did not. None of the diagnostic performance parameters were significantly different. The mean reading time was shortened with CAD use in both the BR and RR groups
(111.6 minutes to 94.3 minutes for BR; 135.5 minutes to 109.8 minutes for RR). The mean time reduction was higher for the RR than that in the BR group.
Conclusions:CAD was helpful for dedicated BRs to improve their diagnostic performance and for RRs to improve the sensitivity in a screening setting. CAD could be essential for radiologists by decreasing reading time without decreasing diagnostic performance.
Keywords:Computer-aided detection (CAD), Mammography, Screening
* Correspondence:[email protected]
2Department of Radiology, Seoul St. Mary’s Hospital, College of Medicine,
The Catholic University of Korea, 222 Banpo-daero, Seocho-gu, Seoul 137-701, South Korea
Full list of author information is available at the end of the article
Background
The mammography is the single most effective method for screening breast cancer and can reduce breast cancer mortality [1,2]. However, the interpretation of screening mammography is challenging. The most significant limita-tion of screening mammography may be the false negative rate of between 10 and 25%. Many false negative interpre-tations are due to the interpretation of a large volume of images in order to detect a small number of cancers, the complex radiographic structure of the breast, the subtle mammographic findings of early breast cancer, and radiologist fatigue or distraction [2,3]. A large portion of breast cancers might be missed by the interpreting radiologist, even if they are experienced, but are frequently visible on previous mammograms [4,5].
To overcome the limitations of human observers and reduce the false negative rate of screening mammo-grams, double reading by another radiologist has been implemented at many hospitals. The results of studies indicate a potential 4 to 15% increase in the number of cancers detected as a result of double reading [6,7]. However, double reading cannot be widely adopted due to cost-effectiveness and practicality in most countries [8]. Thus, computer-aided detection (CAD) is widely used as a good alternative to double reading [2]. Many studies have revealed that CAD can reduce the false negative rate and increase the detection of breast cancer, particularly early breast cancer [2,3,8-10] without a sig-nificant increase in recall rate [2,8] and false positive rate for biopsy [8,10]. More recent studies have reported that CAD systems for full-field digital mammograms can also improve the diagnostic performance of mam-mograms [11,12]. Yanget al.reported that the CAD sys-tem can correctly mark most asymptomatic breast cancers detected with digital mammographic screening [11], and Bolivar et al. demonstrated that improved CAD sensitivity was maintained for small lesions and invasive lobular carcinomas, which have lower mammo-graphic sensitivity [12].
CAD systems have the potential to assist both expert breast radiologists and community radiologists in the interpretation of mammograms, with larger improve-ments observed in community radiologists [13]. Several studies have demonstrated that the CAD application improves the diagnostic performance of non-expert ra-diologists [13-15]. The main advantage of CAD lies in the decreased false negative rate and improved sensitiv-ity, regardless of radiologist experience. Therefore, the purpose of this study was to evaluate the diagnostic performance of a CAD system in full-field digital mam-mography for breast cancer detection when used by dedicated breast radiologist (BR) and radiology resident (RR), and to reveal who could benefit the most from CAD application.
Methods
Institutional review board approval was received and informed consent was waived for this study. We retro-spectively chose 100 image sets among mammogra-phies performed between June 2008 and June 2010. All mammography examinations were performed with a digital mammography system (Selenia, Hologic: Bedford, Massachusetts, United States). Thirty masses (15 benign and 15 malignant), 30 microcalcifications (15 benign and 15 malignant), and 40 normal mammography im-ages were included. A normal mammography was de-fined as images without initial significant findings and negative follow-up for at least two years. The exclusion criteria were: patients without biopsy results despite suspicious malignant findings, and patients without bi-opsy results who did not get a two-year follow-up mam-mography or sonography.
These mammography image sets consisted of a stand-ard two view mammography, including craniocaudal and mediolateral oblique views. We obtained the compressed CAD images for review by Image Checker (R2, software; Los Altos, California, United States). The CAD informa-tion was presented to the radiologists as a low-resoluinforma-tion image embedded with marks. The mark for a mass was an asterisk, the mark for a microcalcification was a triangle, and the mark for a mass with microcalcification was a cross.
The participating radiologists consisted of 7 attending radiologists specializing in breast imaging (dedicated BRs), and 13 second- and third-year RRs. All BRs were board-certified radiologists who worked in a university-based breast imaging center. The mean experience period for BRs involving breast imaging was 9.9 years (between 4 and 16 years). Five radiologists in the BR group had previ-ous experience with clinical CAD, but the remaining two did not. The second-year RRs had no previous experience with breast imaging, whereas the third-year RRs had at least four weeks of training experience in breast imaging. Before the first review we performed an educational lecture about CAD including CAD algorithms and various false positive marks for all radiologists involved in this study.
We arranged two different image sets with rando-mization. One set consisted of mammography images with CAD information for some cases and mammog-raphy images without CAD information for the others. The other set consisted of images with inversion of CAD assistance.
or microcalcification), and final assessment category were recorded by the reviewers for each case. Categorization was performed according to established guidelines [16]. The categories were: 1 for negative, 2 for benign, 3 for probably benign, 4 for suspicious lesion requiring biopsy and 5 for highly suggestive of malignancy. The 0 category was not used in this study. If there was more than one le-sion in a patient, the reviewers chose the highest category for the most suspicious lesion. We checked the reading time during the two sets of categorization for each reviewer.
Sensitivity, specificity, positive predictive value (PPV) and negative predictive value (NPV) for total (n = 100), normal plus microcalcification (n = 70), and normal plus mass (n = 70), both with and without CAD use were cal-culated for each reviewer. We calcal-culated and compared the mean and standard deviation of these diagnostic per-formance values with and without CAD use for the BR and RR groups. We also compared the mean diagnostic performance values in the BR group, according to the year of experience with breast imaging and previous clinical experience with CAD. We compared the diag-nostic performance values for the RR group according to the training experience in breast imaging. The mean and standard deviation of reading time and time reduction for the BR and RR groups were obtained. Statistical ana-lyses were performed with the chi-square test and Fisher’s exact test using SAS System for Windows V 9.1 (SAS Institute, Cary, North Carolina, United States).P <0.05 was considered significant.
Results
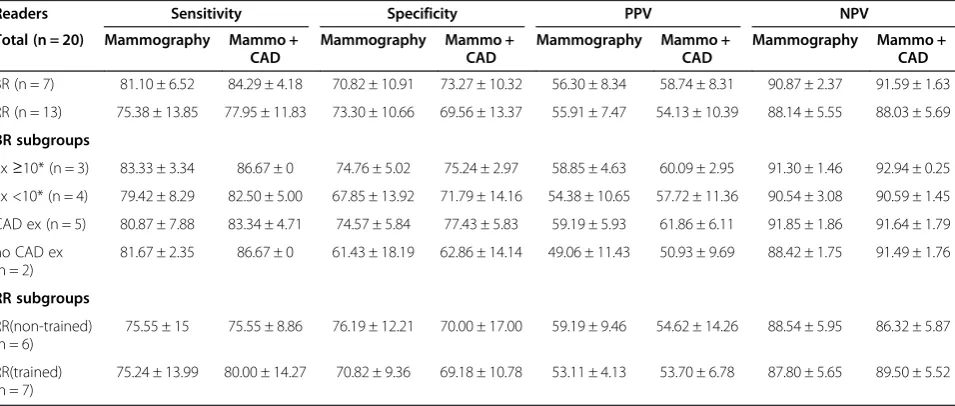
Table 1 showed the mean and standard deviation of the diagnostic performance values with and without CAD use for the BR group, RR group, subgroups of the BR group according to the years of experience with breast imaging and previous clinical experience with CAD, and subgroups of the RR group according to training experi-ence in breast imaging. Diagnostic performance was generally higher in the BR group than that in the RR group. Sensitivity improved with CAD use in both the BR and RR groups (81.10 ± 6.52 to 84.29 ± 4.18% for BR; 75.38 ± 13.8 to 77.95 ± 11.83% for RR). A tendency for CAD to improve all diagnostic performance values was observed in the BR group, whereas in the RR group sen-sitivity improved but specificity, PPV, and NPV did not. None of the diagnostic performance values showed sig-nificant differences.
The diagnostic performance was generally higher in the radiologists with more than 10 years’ experience than those with less than 10 years’experience. The diagnostic performance showed a tendency to improve with the use of CAD in both experience groups. The diagnostic per-formance also improved with the use of CAD in groups with prior clinical CAD experience and those without CAD experience.
Diagnostic performance was not significantly different be-tween the non-trained and one- month-trained RR groups. However, a sensitivity-improving tendency with CAD assistance was demonstrated only for the one-month-trained RR group and not for the non-one-month-trained RR group.
Table 1 Diagnostic performance of mammography and mammography with computer-aided detection (CAD) for all cases (n = 100)
Readers Sensitivity Specificity PPV NPV
Total (n = 20) Mammography Mammo + CAD
Note.―All data are the percentages.
*Ex≥10 means that the reviewer’s experience with breast imaging equal to or more than 10 years, while Ex <10 means less than 10 years.
When the data were evaluated separately for the two case groups (normal plus microcalcification versus normal plus mass), diagnostic performance was generally higher for the microcalcification cases than that for the mass cases (Figures 1 and 2). Tables 2 and 3 show the mean and standard deviation of the diagnostic performance values with and without CAD use in the normal plus microcalci-fication case group (Table 2) and the normal plus mass case group (Table 3) for each BR and RR group and sub-group. Sensitivity, specificity, PPV, and NPV in the BR group for the normal plus microcalcification cases in-creased slightly but not significantly with the use of CAD, however all these parameters remained unchanged or even slightly decreased in the RR group though it was not sig-nificant (Table 2). The results of masses varied in the BR and RR groups (Table 3).
The mean reading time decreased with the use of CAD in the BR and RR groups (127.1 ± 40.0 to 104.3 ± 34.2 minutes per image set for all; 111.6 ± 36.0 to 94.3 ± 26.1 minutes per image set for BR; 135.5 ± 40.2 to 109.8 ± 37.8 minutes per image set for RR) (Table 4). The mean time reduction was higher for the RR group than that in the BR group (−17.2 ± 19.7% versus −12.6 ± 19.6%) and was more noticeable in the one-month-trained RR group (−24.0 ± 21.0%).
Discussion
Improved breast cancer detection has been demonstrated using the CAD system in many studies [2,3,8-10]. Some
prospective studies have shown that CAD improves can-cer detection rate by between 4.7 and 19.5% [3,8,10,17]. Previous studies have also shown that CAD increases diagnostic performance, particularly sensitivity [12,18]. In our study, sensitivity tended to improve with the use of CAD for the BR and RR groups.
CAD systems were initially designed to detect potential malignancies in the breast, so the detection algorithms were heavily biased towards sensitivity, thereby sacrificing the specificity of any mark [8]. Few studies have evaluated the specificity of the CAD system and the reported spe-cificity after applying CAD either decreases or remain un-changed [10,19]. Singh et al. [20] reported that both sensitivity and specificity improved for expert radiologists and residents using their CAD model, the so-called linear discriminant analysis. However this model included not only mammographic, but also ultrasonographic features, which improved specificity in that study. In our study, it was promising that specificity in the BR group increased for total and normal plus microcalcification cases without a decrease in sensitivity.
Several studies have shown that CAD improves the diag-nostic performance of non-expert radiologists [13-15] or even students [15]. CAD systems assist both expert breast radiologists and community radiologists in interpreting mammograms, with a larger improvement in community radiologists [13]. A study by Queket al.[14] demonstrated that the CAD system significantly improves the detection of
suspicious mammographic abnormalities by inexperienced radiologists. In another study, Sohns et al. performed a receiver-operating characteristics analysis and showed that the greatest benefit after the use of CAD was observed for students, followed by residents and mammography fellows [15]. This outcome showed that the maximal CAD effect was even greater if the readers’experience was lower. In our study, sensitivity, specificity, PPV, and NPV tended to increase with CAD use in the BR group, whereas only sensi-tivity increased slightly in the RR group. The experienced dedicated breast radiologist can take advantage of CAD more efficiently than radiology residents with less experi-ence in breast imaging. Experiexperi-ence with breast imaging had a more important effect on the improvement of diagnostic performance with CAD application than previous CAD experience. The previous one-month training experience of radiology residents had a favorable effect on im-proved sensitivity with CAD use. The improvement in specificity with CAD assistance was not demonstrated for the non-experienced or less-experienced radiologist in our study, therefore it can have limited value and even be harmful for a non-expert radiologist to use the CAD system for a correct diagnosis. However, the
improvement in the sensitivity of mammograms is the more important purpose of CAD, particularly for less experienced readers.
The sensitivity of CAD for microcalcifications is gener-ally higher than that for masses [12,18]. In our study, the diagnostic performance for microcalcifications was gen-erally higher than that for masses in both the BR and RR groups. No significant difference in diagnostic perform-ance was observed in either the BR or RR groups when CAD was applied, but the results showed a tendency for an improvement in sensitivity, specificity, PPV, and NPV in the BR group when the radiologists evaluated calcifications but not masses. The sensitivity for micro-calcification improved slightly with CAD use for the one-month-trained RR subgroup, but not for the non-trained RR subgroup. Figure 1 demonstrates the malig-nant microcalcification case with a true positive CAD marker, which turned out to be ductal carcinomain situ. The CAD marker was helpful for some of the BRs and RRs to make a correct evaluation.
The CAD marker for masses was also helpful for some radiologists to make the correct evaluation confidently. Figure 2 shows that the mass marker was of a benefit in
detecting and diagnosing the invasive ductal carcinoma in the right breast.
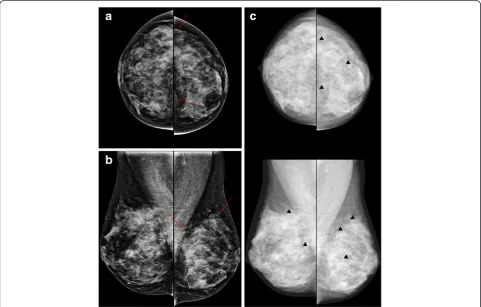
One of the main disadvantages of CAD is the high rate of false positive marks. Figure 3 shows several false posi-tive microcalcification marks in the left breast, resulting in a misdiagnosis of benign microcalcifications related to fibrocystic changes, which were read as malignant micro-calcifications by some readers. The false positive marks distracted the radiologists and potentially elongated read-ing time. Sohnset al.reported a significant elongation of
reading time with CAD use [15]. However, interpretation time increased slightly in another study about CAD use-fulness [21] but was not significantly higher after an inter-active CAD system was used (84.7 ± 61.5 seconds per case in an unaided session to 85.9 ± 57.8 seconds per case in a CAD-aided session, P= 0.13). In our study, a reduc-tion of reading time was demonstrated for both groups. The mean time reduction was higher for the RR than the BR group. Approximately 71% (5 out of 7) of BRs and 46% (6 out of 13) of RRs participating in our study
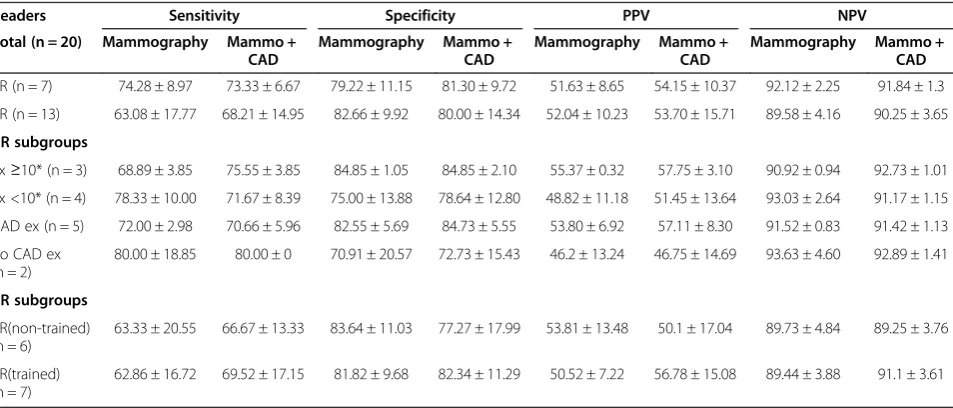
Table 3 Diagnostic performance of mammography and mammography with computer-aided detection (CAD) for normal plus mass cases (n = 70)
Readers Sensitivity Specificity PPV NPV
Total (n = 20) Mammography Mammo + CAD
Note.―All data are the percentages.
*Ex≥10 means that the reviewer’s experience with breast imaging equal to or more than 10 years, while Ex <10 less than 10 years.
BR, dedicated breast radiologists; ex, experience; mammo, mammography; NPV, negative predictive value; PPV, positive predictive value; RR, radiology residents.
Table 2 Diagnostic performance of mammography and mammography with computer-aided detection (CAD) for normal plus microcalcification cases (n = 70)
Readers Sensitivity Specificity PPV NPV
Total (n = 20) Mammography Mammo + CAD
Note.―All data are the percentages.
*Ex≥10 means that the reviewer’s experience with breast imaging equal to or more than 10 years, while Ex <10 less than 10 years.
had previous experience with a clinical CAD system. We also conducted an educational lecture about CAD. The direct and indirect experience using CAD enabled the radiologists to discard most of false positive marks confidently without consuming time. The current CAD software versions were upgraded toward the acceptable
false positive marks, which could also be helpful for re-ducing readers’interpretation time.
There were some limitations to our study. First, only 100 randomly selected test cases were used for evalu-ation. The small number of cases may have prevented any significant differences in diagnostic performances
Figure 3A 50-year-old woman with fibrocystic changes in the left breast.Mammography craniocaudal(a)and mediolateal oblique(b)views show regional punctate or milk-of-calcium microcalcifications (arrows) in the left upper outer and inner quadrant.(c)The computer-aided detection (CAD) system indicated several false-positive microcalcification marks (triangles) in the left breast.
Table 4 Reading time for mammography and mammography with computer-aided detection (CAD)
Readers Method Reading time Time reduction
Mean ± SD Median (min-max) Mean ± SD (%) Median (min-max) (%)
BR + RR (n = 20) mammo 127.1 ± 40.0 120.0(68.0-210.0) -
-mammo + CAD 104.3 ± 34.2 101.5(64.0-210.0) −15.6 ± 19.2 −16.0(−46.7-29.4)
BR (n = 7) mammo 111.6 ± 36.0 103.0(68.0-160.0) -
-mammo + CAD 94.3 ± 26.1 88.0(64.0-140.0) −12.6 ± 19.6 −15.4(−30.0-29.4)
RR (n = 13) mammo 135.5 ± 40.2 120.0(70.0-210.0) -
-mammo + CAD 109.8 ± 37.8 103.0(66.0-210.0) −17.2 ± 19.7 −16.7(−46.7-13.0)
Non-trained RR (n = 6) mammo 145.8 ± 36.4 145.0(100.0-200.0) -
-mammo + CAD 132.7 ± 41.9 116.5(100.0-210.0) −8.8 ± 15.4 −11.1(−28.6-13.0)
Trained RR (n = 7) mammo 126.6 ± 43.9 120.0(70.0-210.0) -
-mammo + CAD 90.1 ± 20.4 85.0(66.0-120.0) −24.4 ± 21.0 −26.1(−46.7-8.9)
with or without CAD use. Secondly, we included various sizes of microcalcifications and masses. Each reader could evaluate the different lesion with the highest sus-picion. We tried to include just one lesion in each case, excluding the possibility of each reader evaluating differ-ent lesions. Finally, only 20 radiologists participated in this study as readers. However we included many radiol-ogists with various amounts of experience and we evalu-ated which group of radiologists would benefit from using a CAD system.
Conclusions
In conclusion, our results demonstrate that CAD was helpful for dedicated breast radiologists to improve diag-nostic performance and for non-expert radiologists to improve sensitivity in a screening setting. A CAD system can contribute to shortening the reading time in both breast-dedicated radiologists and residents without de-creasing diagnostic performance. However, CAD systems are especially useful for dedicated breast radiologists, therefore CAD systems used by non-expert radiologists can even be harmful when they reduce the time of detec-tion but do not improve the specificity of the diagnosis. CAD could provide essential assistance to radiologists, es-pecially dedicated breast radiologists, by decreasing read-ing time without decreasread-ing diagnostic performance.
Abbreviations
BR:Breast radiologists; CAD: Computer-aided detection; NPV: Negative predictive value; PPV: Positive predictive value; RR: Radiology residents.
Competing interests
The authors declare that they have no competing interests.
Authors’contributions
NYJ and BJK participated in conception of the study, data collection and analysis, and drafted the manuscript. HSK, ESC, JHL, CSP, IYW, SHK, YYA and JJC participated in data collection and analysis. All authors read and approved the final manuscript.
Acknowledgements
The statistical consultation was supported by Catholic Research Coordinating Center of the Korea Health 21 R&D Project (A070001), Ministry of Health & Welfare, South Korea.
Author details
1Department of Radiology, Bucheon St. Mary’s Hospital, College of Medicine,
The Catholic University of Korea, 327 Sosa-ro, Wonmi-gu, Bucheon-si, Gyeonggi-do 420-717, South Korea.2Department of Radiology, Seoul St. Mary’s Hospital, College of Medicine, The Catholic University of Korea, 222 Banpo-daero, Seocho-gu, Seoul 137-701, South Korea.3Department of Radiology, St. Paul’s Hospital, College of Medicine, The Catholic University of Korea, 180 Wangsan-ro, Dongdaemun-gu, Seoul 130-709, Korea.4Department of Radiology, Ewha Womans Mokdong Hospital, School of Medicine, Ewha Womans University, 1071 Anyangcheon-ro, Yangcheon-gu, Seoul 158-710, South Korea.5Department of Radiology, Human Medical Imaging and Intervention Center, 621 Gangnam-daero, Seocho-gu, Seoul 137-902, South Korea.6Department of Radiology, Incheon St. Mary’s Hospital, College of Medicine, The Catholic University of Korea, 56 Dongsu-ro, Bupyeong-gu, Incheon 403-720, South Korea.7Department of Radiology, Uijongbu St. Mary’s Hospital, College of Medicine, The Catholic University of Korea, 271 Cheonbo-ro, Uijeongbu-si, Gyeonggi-do 480-717, South Korea.8Department of Radiology, St. Vincent’s Hospital, College of Medicine, The Catholic
University of Korea, 93 Jungbu-daero, Paldal-gu, Suwon-si, Gyeonggi-do 442-723, South Korea.9Department of Radiology, School of Medicine, Hallym University Medical Center, 7 Keunjaebong-gil, Hwaseong-si, Gyeonggi-do 445-170, South Korea.
Received: 12 December 2013 Accepted: 29 April 2014 Published: 29 May 2014
References
1. Fletcher SW, Elmore JG:Mammographic screening for breast cancer.
N Engl J Med2003,348:1672–1680.
2. Warren Burhenne LJ, Wood SA, D’Orsi CJ, Feig SA, Kopans DB,
O’Shaughnessy KF, Sickles EA, Tabar L, Vyborny CJ, Castellino RA:Potential contribution of computer-aided detection to the sensitivity of screening mammography.Radiology2000,215:554–562.
3. Birdwell RL, Bandodkar P, Ikeda DM:Computer-aided detection with screening mammography in a university hospital setting.Radiology2005,
236:451–457.
4. Harvey J:Previous mammograms in patients with impalpable breast carcinoma: retrospective vs blinded interpretation. 1993 ARRS President’s Award.AJR Am J Roentgenol1993,1993(161):1167–1172. 5. Birdwell RL, Ikeda DM, O’Shaughnessy KF, Sickles EA:Mammographic
characteristics of 115 missed cancers later detected with screening mammography and the potential utility of computer-aided detection.
Radiology2001,219:192–202.
6. Beam CA, Sullivan DC, Layde PM:Effect of human variability on independent double reading in screening mammography.Acad Radiol
1996,3:891–897.
7. Thurfjell EL, Lernevall KA, Taube AA:Benefit of independent double reading in a population-based mammography screening program.
Radiology1994,191:241–244.
8. Freer TW, Ulissey MJ:Screening mammography with computer-aided detection: prospective study of 12,860 patients in a community breast center.Radiology2001,220:781–786.
9. Destounis SV, DiNitto P, Logan-Young W, Bonaccio E, Zuley ML, Willison KM:
Can computer-aided detection with double reading of screening mammograms help decrease the false-negative rate? Initial experience.
Radiology2004,232:578–584.
10. Ko JM, Nicholas MJ, Mendel JB, Slanetz PJ:Prospective assessment of computer-aided detection in interpretation of screening mammography.
AJR Am J Roentgenol2006,187:1483–1491.
11. Yang SK, Moon WK, Cho N, Park JS, Cha JH, Kim SM, Kim SJ, Im JG:
Screening mammography-detected cancers: sensitivity of a computer-aided detection system applied to full-field digital mammograms.
Radiology2007,244:104–111.
12. Bolivar AV, Gomez SS, Merino P, Alonso-Bartolome P, Garcia EO, Cacho PM, Hoffmeister JW:Computer-aided detection system applied to full-field digital mammograms.Acta Radiol2010,51:1086–1092.
13. Huo Z, Giger ML, Vyborny CJ, Metz CE:Breast cancer: effectiveness of computer-aided diagnosis—observer study with independent database of mammograms.Radiology2002,224:560–568.
14. Quek ST, Thng CH, Khoo JB, Koh WL:Radiologists’detection of mammographic abnormalities with and without a computer-aided detection system.Australas Radiol2003,47:257–260.
15. Sohns C, Angic BC, Sossalla S, Konietschke F, Obenauer S:CAD in full-field digital mammography—influence of reader experience and application of CAD on interpretation of time.Clin Imaging2010,
34:418–424.
16. American College of Radiology:Breast Imaging Reporting and Data System: BI-RADS atlas.4th edition. Reston, Va: American College of Radiology; 2003. 17. Morton MJ, Whaley DH, Brandt KR, Amrami KK:Screening mammograms:
interpretation with computer-aided detection—prospective evaluation.
Radiology2006,239:375–383.
18. Kim SJ, Moon WK, Cho N, Cha JH, Kim SM, Im JG:Computer-aided detection in full-field digital mammography: sensitivity and reproducibility in serial examinations.Radiology2008,246:71–80.
19. Fenton JJ, Taplin SH, Carney PA, Abraham L, Sickles EA, D’Orsi C, Berns EA, Cutter G, Hendrick RE, Barlow WE, Elmore JG:Influence of computer-aided detection on performance of screening mammography.N Engl J Med
20. Singh S, Maxwell J, Baker JA, Nicholas JL, Lo JY:Computer-aided classification of breast masses: performance and interobserver variability of expert radiologists versus residents.Radiology2011,258:73–80. 21. Samulski M, Hupse R, Boetes C, Mus RD, den Heeten GJ, Karssemeijer N:
Using computer-aided detection in mammography as a decision support.Eur Radiol2010,20:2323–2330.
doi:10.1186/1477-7819-12-168
Cite this article as:Junget al.:Who could benefit the most from using a computer-aided detection system in full-field digital mammography? World Journal of Surgical Oncology201412:168.
Submit your next manuscript to BioMed Central and take full advantage of:
• Convenient online submission
• Thorough peer review
• No space constraints or color figure charges
• Immediate publication on acceptance
• Inclusion in PubMed, CAS, Scopus and Google Scholar
• Research which is freely available for redistribution