FULL PAPER
Data processing in Software-type Wave–
Particle Interaction Analyzer onboard the Arase
satellite
Mitsuru Hikishima
1*, Hirotsugu Kojima
2, Yuto Katoh
3, Yoshiya Kasahara
4, Satoshi Kasahara
5, Takefumi Mitani
1,
Nana Higashio
6, Ayako Matsuoka
1, Yoshizumi Miyoshi
7, Kazushi Asamura
1, Takeshi Takashima
1,
Shoichiro Yokota
8, Masahiro Kitahara
3and Shoya Matsuda
7Abstract
The software-type wave–particle interaction analyzer (S-WPIA) is an instrument package onboard the Arase satel-lite, which studies the magnetosphere. The S-WPIA represents a new method for directly observing wave–particle interactions onboard a spacecraft in a space plasma environment. The main objective of the S-WPIA is to quantita-tively detect wave–particle interactions associated with whistler-mode chorus emissions and electrons over a wide energy range (from several keV to several MeV). The quantity of energy exchanges between waves and particles can be represented as the inner product of the wave electric-field vector and the particle velocity vector. The S-WPIA requires accurate measurement of the phase difference between wave and particle gyration. The leading edge of the S-WPIA system allows us to collect comprehensive information, including the detection time, energy, and incoming direction of individual particles and instantaneous-wave electric and magnetic fields, at a high sampling rate. All the collected particle and waveform data are stored in the onboard large-volume data storage. The S-WPIA executes cal-culations asynchronously using the collected electric and magnetic wave data, data acquired from multiple particle instruments, and ambient magnetic-field data. The S-WPIA has the role of handling large amounts of raw data that are dedicated to calculations of the S-WPIA. Then, the results are transferred to the ground station. This paper describes the design of the S-WPIA and its calculations in detail, as implemented onboard Arase.
Keywords: Wave–particle interaction, Onboard processing, Inner magnetosphere
© The Author(s) 2018. This article is distributed under the terms of the Creative Commons Attribution 4.0 International License (http://creat iveco mmons .org/licen ses/by/4.0/), which permits unrestricted use, distribution, and reproduction in any medium, provided you give appropriate credit to the original author(s) and the source, provide a link to the Creative Commons license, and indicate if changes were made.
Introduction
Radiation belts are composed of inner and outer belts, and highly relativistic electrons are trapped in the outer belt. The structure of the inner belt is relatively sta-ble, while in the outer belt, the electron flux drastically changes during magnetic storms. These fluxes show sudden increases and decreases during the main and recovery phases of storms (Baker et al. 1986; Blake et al.
2001; Reeves et al. 2003). Two sources of particle accel-eration have been proposed (Green and Kivelson 2004).
Adiabatic acceleration, which involves the process of radial diffusion, is referred to as an external-source accel-eration (Hudson et al. 2001; Elkington et al. 2003; Shprits et al. 2008), and local acceleration, which involves wave– particle interactions, is known as an internal-source acceleration (Miyoshi et al. 2003; Thorne et al. 2013; Reeves et al. 2013). Whistler-mode chorus waves, which are frequently observed outside the plasmasphere (e.g., Santolik et al. 2003; Li et al. 2009), are considered pos-sible causes of particle acceleration to relativistic ener-gies in the inner magnetosphere during magnetic storms (Summers et al. 1998; Meredith et al. 2002). The energy of particles trapped in the wave potential of coherent whistler-mode waves could be efficiently increased to relativistic energies in the order of magnitude of several MeV (Omura et al. 2007; Summers and Omura 2007).
Open Access
*Correspondence: [email protected]
1 Institute of Space and Astronautical Science, Japan Aerospace
Exploration Agency, 3-1-1 Yoshinodai, Chuo-ku, Sagamihara, Kanagawa 252-5210, Japan
The Arase (ERG: Exploration of Energization and Radia-tion in Geospace) satellite was launched by the Japan Aerospace Exploration Agency on December 20, 2016. Its primary mission is to study particle acceleration pro-cesses in geospace (Miyoshi et al. 2013; Miyoshi et al. submitted to Earth, Planets, and Space). The Arase car-ries the software-type wave–particle interaction analyzer (S-WPIA) instrument package and processing applica-tion. The S-WPIA directly measures the local energy exchange through resonant interactions between the plasma waves and electrons in the inner magnetosphere. The fundamental concept of the WPIA is described by Fukuhara et al. (2009). They designed the method as a One-chip WPIA (O-WPIA), using an onboard field-programmable gate array (FPGA). The WPIA computes the kinetic energy variation of a plasma particle over time, using the physical quantities of waves and particles acquired by onboard instruments. To validate the calcu-lation method of the WPIA, plasma-particle simucalcu-lations were performed to verify the resonant interaction of whistler-mode chorus waves and energetic electrons. The pseudo-measurement of the WPIA statistically indicated that there was a significant transfer of energy, exceeding the standard deviation (Katoh et al. 2013; Hikishima et al.
2014). In the Arase satellite, the calculation method of the WPIA is implemented through the S-WPIA, which functions using software. The S-WPIA approach pro-vides flexibility for the calculations, including alternative calculation modes, variable parameter settings, calcula-tions for other wave modes, and software updates. In this study, we present the functional design and specifications of the S-WPIA implemented onboard the Arase satellite.
Principle of Wave–Particle Interaction Analyzer
The fundamental concept of the WPIA is described by Fukuhara et al. (2009) and Katoh et al. (2013). The WPIA requires instantaneous-wave field vectors and velocity vectors of incoming plasma particles. The quantity W, the time variation of the kinetic energy K of a charged particle, is represented by the inner product of the wave electric field E and particle velocity v as follows:
where K=m0c2(γ −1) , m0 is the particle rest mass, c is
the speed of light, γ is the Lorentz factor represented by
1−(v/c)2−1/2
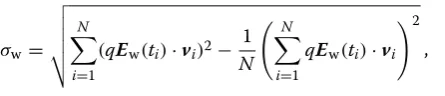
, and q is the particle charge. The sign of W indicates wave damping/particle acceleration (posi-tive) or wave growth/particle deceleration (nega(posi-tive). We statistically evaluate the magnitude of the energy transfer by summing W over a given time interval. The statistical significance is evaluated using the standard deviation σw
(Katoh et al. 2013) as follows:
(1)
S‑WPIA in the Arase satellite system
Mission network and components associated with S‑WPIA The Arase’s mission system has two sets of Mission Data Processor (MDP)/Recorder (MDR) units. Both MDP/ MDR#1 and #2 are completely identical with respect to their designs and functions. They are interchangeable and provide redundancy for data processing and stor-age (Takashima et al. 2018). The S-WPIA runs on the MDR, which is an onboard digital processing unit with a flash memory of 32 GB. The flash memory is used as a data recorder dedicated to data storage for the S-WPIA. The S-WPIA processes data stored on the flash memory of the MDR from the following instruments (hereafter referred to as “cooperative instruments”) for measuring waves, particles, and the ambient magnetic field:
• PWE: WaveForm Capture (WFC) receivers of Plasma Wave Experiment (Kasahara et al. 2018b)
• MEP-e: Medium-Energy Particle Experiment—Elec-tron Analyzer (Kasahara et al. 2018a)
• HEP-L and HEP-H: High-Energy Electron Experi-ments with low- and high-energy measureExperi-ments, respectively (Mitani et al. submitted to Earth, Plan-ets, and Space)
• XEP: Extremely High-Energy Electron Experiment (Higashio et al. submitted to Earth, Planets, and Space)
• MGF: Magnetic Field Experiment (Matsuoka et al.
2018).
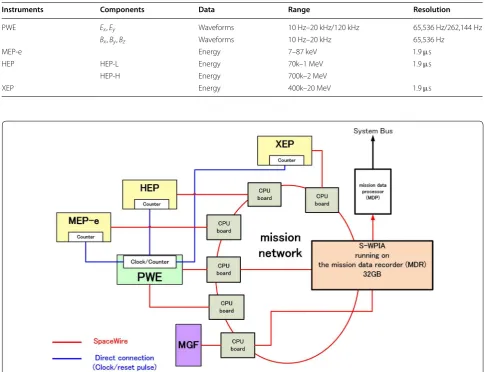
Figure 1 shows the configuration of the mission network. Note that the figure covers only the cooperative instru-ments and other components that are related to the oper-ation of the S-WPIA. Table 1 gives the specifications for the above cooperative instruments. The observation data are transferred from the instruments to the flash memory of the MDR via the mission network (Takashima et al.
2018). The S-WPIA executes calculations using the data stored in the flash memory of the MDR.
1 Issuing directives to the cooperative instruments to control the starting and stopping of data generation. 2 Executing calculations in the S-WPIA calculations
and writing both calculation results and raw data to flash memory.
3 Transferring PWE burst data (Kasahara et al. 2018b; Matsuda et al. 2018) from the MDR to the System Data Recorder (SDR) of the satellite bus system.
Data recorder for S‑WPIA
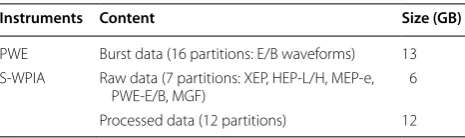
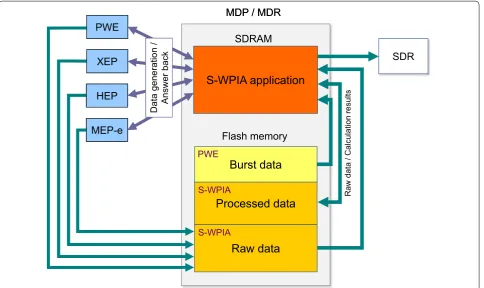
Figure 2 shows the configuration of the MDR and the cooperative instruments. The MDR flash memory is par-titioned into two broad areas, one for storing data for the S-WPIA (both raw and processed data) and the other for storing PWE burst data, as shown in Table 2. The raw data are unprocessed data that are recorded directly by the cooperative instruments. The processed data are
the output of the S-WPIA. The S-WPIA reads the raw data from the flash memory and performs calculations according to the algorithm of the S-WPIA. The pro-cessed data are losslessly compressed by a range encod-ing method (Martin 1979), and the compressed data are written back to the flash memory.
The PWE burst data are the five components of con-tinuous electric-field and magnetic-field waveform data written into the flash memory of the MDR during a spe-cific observation time period via the mission network under the control of the PWE. The burst data allow us to perform detailed data analyses, such as determin-ing polarizations and Poyntdetermin-ing fluxes. Details pertaindetermin-ing to the PWE burst data are reported by Kasahara et al. (2018b).
Table 1 Data specifications for the S‑WPIA
Instruments Components Data Range Resolution
PWE Ex , Ey Waveforms 10 Hz–20 kHz/120 kHz 65,536 Hz/262,144 Hz
Bx , By , Bz Waveforms 10 Hz–20 kHz 65,536 Hz
MEP-e Energy 7–87 keV 1.9µs
HEP HEP-L Energy 70k–1 MeV 1.9µs
HEP-H Energy 700k–2 MeV
XEP Energy 400k–20 MeV 1.9µs
Time tag in S‑WPIA system
To meet the scientific objectives of the S-WPIA, the rela-tive time precision between the plasma wave data and particle data must be less than 10µs (Katoh et al. 2018).
This precision is maintained by two time-keeping sys-tems: (1) the 64 Hz time index (TI) distributed by the onboard satellite system and (2) the 524,288 Hz S-WPIA clock distributed by the PWE (Fig. 1). Each cooperative instrument has a 24 bit S-WPIA clock counter, which incrementally advances the distributed S-WPIA clock. As a result, the S-WPIA clock counter has a time preci-sion of 1.9µs . The S-WPIA clock counter is reset by the
reset pulse distributed by the PWE. Because the S-WPIA clock is generated by the same source clock as that used to sample waveforms in the PWE, the S-WPIA clock counter is synchronized to the sampling of plasma wave data. Regarding the particle instruments, the detec-tion time for each particle is not synchronized with the S-WPIA clock counter, so each instrument applies a time tag with the latest S-WPIA clock counter to each particle detection. The precision of the relative time between data acquisitions for plasma waves and particles is 1.9µs . The
observation time of the S-WPIA is defined by combining the TI and S-WPIA clock counters.
Data sharing through the mission network
The instruments that are connected through the mis-sion network communicate with each other using spe-cial communication packets called “relay packets.” The S-WPIA also uses relay packets to communicate with each cooperative instrument. The relay packet circulates through the network at a cycle of 1 s. With respect to the operation of the S-WPIA, the relay packet contains control flags that are used for activating or deactivating the data generation in each cooperative instrument. In addition, the relay packet contains the magnitudes of the ambient magnetic field observed by the MGF, and inte-grated wave-spectrum intensities are used for the trigger-mode operation of the S-WPIA and the electron plasma density data (Kumamoto et al. 2018) from the PWE. Data from the MGF are used for coordinate conversion in the S-WPIA.
Data generation mode of S‑WPIA
With the exception of the MGF, each cooperative instru-ment adds a flag to the relay packet when it is ready to transmit its own data, while the MGF is constantly trans-mitting its data via the relay packet. The S-WPIA has two independent observation modes:
Nominal mode
The nominal mode is a simple data generation operation. When the S-WPIA receives a command from the ground or a satellite system (scheduled at a specified time), it transmits a generation flag via the relay packet. The flag identifies the cooperative instruments that should be activated for data generation (any combination of wave and particle instruments can be selected). Each coopera-tive instrument looks for its own flag in the relay packet. Once an instrument receives its data generation flag, it adds an “answer back” flag to the relay packet and begins to generate raw data, which are stored in the MDR par-tition (Fig. 2). During data transmission, the instrument adds a flag indicating the state of the data transmission.
Trigger mode
The trigger mode is prepared for acquiring targeted data effectively. In the trigger mode, the cooperative instru-ments continue to write their observation data into the MDR until they receive the command to stop the data generation. Each partition of the MDR is formed as a kind of a ring buffer, and the stored data are automatically overwritten. The PWE computes the spectral intensities of the wave magnetic field at four different frequency bands. The frequency bands correspond to the band for the upper-band chorus, lower-band chorus, hiss, and magnetosonic wave. The PWE computes spectral inten-sities in each band with respect to the magnitude of the ambient magnetic field that is distributed onboard and includes them on the relay packet. They are used by the S-WPIA as the trigger signal. Once the spectral intensity that is selected from among the four frequency bands exceeds the threshold level, the S-WPIA records the TI and the status of other necessary flags, and deactivates the cooperative instruments at a specific time after the trigger detection. The start time for the data to be pro-cessed by the S-WPIA is determined by referring to the observed spectral intensities provided by the PWE.
Data processing algorithm
In this section, the onboard processing of the S-WPIA is described in detail. The S-WPIA has two main func-tions: perform calculations according to the algorithm of the S-WPIA and perform a data dump from the MDR to the SDR. During the data dump, the S-WPIA transfers the raw data generated by the cooperative instruments, Table 2 Partition assignments in the MDR
Instruments Content Size (GB)
PWE Burst data (16 partitions: E/B waveforms) 13 S-WPIA Raw data (7 partitions: XEP, HEP-L/H, MEP-e,
PWE-E/B, MGF) 6
stored in the raw data partition, to the SDR. The compu-tational results of the S-WPIA stored in the processed partition and the PWE burst data stored in the PWE par-tition of the MDR are also transferred to the SDR. Since the S-WPIA processing requires considerable computa-tion time, the S-WPIA prioritizes the data dump process over the calculation process. Once the data dump starts, the calculation process of the S-WPIA is interrupted, resuming automatically after the data dump ends.
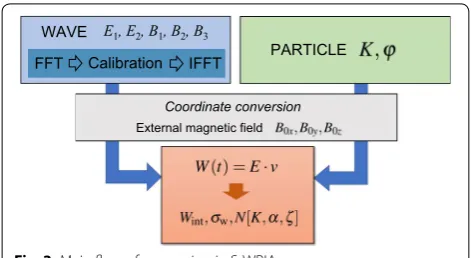
Overview of processing in S‑WPIA
Figure 3 shows the main flow of S-WPIA processing. The S-WPIA computes physical quantities that express the energy exchange between waves and particles. As described in the previous section, the energy exchange is represented as the inner product of the electric-wave field vector E and the individual particle velocity vector v. The integrated quantities Wint during time interval t are computed as follows:
(3)
Wint= N
i=1
qEw(ti)·vi,
where Ew denotes the wave electric field and ti is the detection time for each particle. In addition, the S-WPIA computes Bw·v related to the frequency variation of
chorus emissions (Omura and Nunn 2011). The result for Wint is output in the form of three-dimensional (3D) arrays of Wint , comprising components of kinetic energy K, pitch angle α , and phase difference ζ , which denotes
the phase difference between the wave magnetic-field vector and the velocity vector of the particle on the per-pendicular plane with respect to the ambient magnetic field.
The S-WPIA requires the input of waveforms: two components of electric fields, detected by two pairs of wire probe antennae, which are extended on the spin plane of the spacecraft (Kasahara et al. 2018b), and three components of magnetic fields, detected by triaxial search-coil magnetometers (Kasahara et al. 2018b; Ozaki et al. 2018). The signals that are detected by these sensors are passed through several bandpass filters and variable-gain amplifiers. The observed waveform data contain the effects of phase distortion as well as the effects of the gain of the PWE receiver. The calibration process for the plasma wave observation is crucial because precise phase
S-WPIA application
SDRAMFlash memory
Raw data
Processed data
SDR
Raw
data
/ Calculation
result
s
MDP / MDR PWE
XEP
HEP
MEP-e
Burst data
PWE
S-WPIA
S-WPIA
Data generatio
n/
Answer bac
k
S-WPIA application
SDRAMFlash memory
Raw data
Processed data
SDR
Raw
data
/ Calculation
result
s
MDP / MDR PWE
XEP
HEP
MEP-e
Burst data
PWE
S-WPIA
S-WPIA
Data generatio
n/
Answer bac
k
and amplitude data are essential for quantitative analyses of the S-WPIA data.
To obtain the amplitudes and phases of plasma waves detected by the sensors, the calibration process is per-formed in the frequency domain. After applying a fast Fourier transform (FFT) to the output signals of the PWE receivers, the wave amplitudes and phases are calibrated according to the transfer functions of the PWE receivers. After the correction of the amplitude and phase, time-series waveforms are obtained through an inverse FFT (IFFT). Since the S-WPIA independently evaluates physi-cal quantities in the parallel and perpendicular directions relative to the ambient magnetic field, the acquired elec-tric and magnetic waveforms and particle data are con-verted to vectors with respect to the ambient magnetic field. The calculations of the S-WPIA are applied to the above converted physical values.
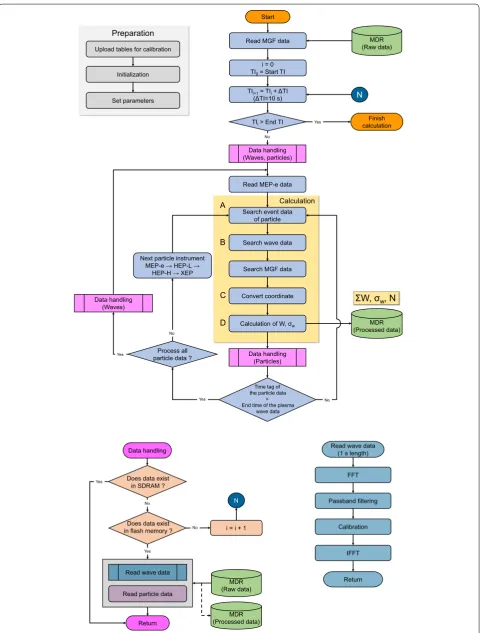
S‑WPIA processing
Figure 4 shows the calculation flow of the S-WPIA. Before starting the calculation, the tables needed to cali-brate the data of the cooperative instruments are loaded in advance from the ground by specific commands. The functions of the S-WPIA are flexible. The commands from the ground control the initial settings of the calcu-lations, such as the number of data points used in FFT and the frequency bandwidth of plasma wave data. The S-WPIA can also choose various combinations from among the cooperative instruments that are dedicated to the calculations.
The time period of the raw data used in the S-WPIA calculations is specified by the TI, which is also sent from the ground. Since the buffer size of the onboard syn-chronous dynamic random-access memory (SDRAM) should be smaller than the size of the specified raw data, the S-WPIA reads the data from the raw data partition for time periods that are shorter than the targeted time period. The duration of the read time is 10 s for parti-cle data and 1 s for wave data. Since the MGF provides data that are sampled at a lower rate, all of its data are
read from the raw data partition to the onboard SDRAM memory before the calculations.
Processing of wave data
One record of waveform data for the S-WPIA contains the TI, S-WPIA clock counter, data status, and 512 points of electric-field and magnetic-field waveform data. The time interval for one record corresponds to 7.8 ms in the nominal mode for a sampling frequency equal to 65,536 Hz. The S-WPIA clock counter represents the timing of the first data point. The data status contains informa-tion about the operainforma-tion mode of the PWE, such as the receiver gain and observation frequency bands.
Transfer functions for wave calibration
The S-WPIA requires end-to-end transfer functions for the WFC receivers, including the sensors needed to cali-brate the observed data. The transfer function for the magnetic-field data of the WFC is provided by the PWE team, based on the results of testing on the ground. With respect to the transfer functions of the electric-field data of the WFC, the antenna impedance needs to be consid-ered in addition to the calibration of the WFC receiver. The impedance of the electric-field antennae depends on plasma density and temperatures, which means that the antenna impedance varies along the path of the satel-lite’s orbit. Depending on the location of the satellite, the S-WPIA can select the antenna impedance to be used in the calibration from among the typical impedance values that are registered in advance. The PWE has the function of measuring the antenna impedance by the onboard cal-ibration system (Kasahara et al. 2018b). The results of the antenna impedance measurements provide the registered values in the S-WPIA.
The PWE has various operation modes. The gains and observation frequency ranges of the receivers are control-lable by the telemetry commands and the onboard PWE software. The S-WPIA needs to perform the onboard cali-bration in consideration of the PWE operation modes. Onboard preparation of the calibration tables for every PWE operation mode is not realistic; therefore, the S-WPIA reproduces the transfer function for each PWE operation mode using a cubic spline interpolation in Eq. (4).
where Sj(x) is the transfer function as a function of the
fre-quency x on an interval [xj,xj+1],xj is the jth frequency at
which the calibration data are available, aj,bj,cj , and dj are the coefficients of the polynomials obtained by the cubic spline interpolation, and M is the number of data points of the calibration table.
(4)
Sj(x)=aj(x−xj)3+bj(x−xj)2+cj(x−xj) +dj(j=0, 1, ...,M−1;xj<x<xj+1). External magnetic field
Coordinate conversion WAVE
PARTICLE FFT Calibration IFFT
E1, E2, B1, B2, B3
Start
Data handling (Waves, particles)
Calculation
MDR (Processed data)
ΣW, σw, N Upload tables for calibration
Set parameters Initialization
Read MGF data
Read MEP-e data
Search event data of particle
Search wave data
Search MGF data
Calculation of W, σw i = 0 TI0= Start TI
Finish calculation TIi> End TI
TIi+1= TIi+ ΔTI (ΔTI=10 s)
Data handling (Particles) Convert coordinate
Yes Next particle instrument MEP-e → HEP-L →
HEP-H → XEP
Process all particle data ?
No Data handling
(Waves)
N
Yes
No
No
MDR (Raw data)
Data handling
Read wave data
Read particle data
Return
i = i + 1 N
MDR (Raw data)
MDR (Processed data)
Read wave data (1 s length)
Return FFT
Passband filtering
Calibration
IFFT Preparation
Yes
Yes
Yes No
No
A
B
C
D
Time tag of the particle data
> End time of the plasma
wave data
Does data exist in flash memory ?
Does data exist in SDRAM ?
Calibration
The S-WPIA requires the onboard calibration of wave-form data. The calibration of both wave amplitudes and phases is carried out in the frequency domain. First, the S-WPIA converts the five components of observed wave-forms (two components of the wave electric field and three components of the wave magnetic field) to com-plex spectra in the frequency domain using the comcom-plex FFT. The S-WPIA calibrates the obtained complex spec-tra with respect to the reproduced spec-transfer functions and converts the calibrated complex spectra to waveforms in the time domain using the inverse FFT. The FFT cal-culation is conducted for a frame containing a specific number of data points of the waveform. Its default num-ber is 512, which can be changed using telemetry com-mands. The calibration process is repeated in the frame of the FFT calculation. Since the continuity of the cali-brated waveforms in consecutive FFT frames is crucial to the S-WPIA, the S-WPIA applies window functions and frame overlapping to waveform data in the time domain. A detailed description is reported in Hikishima et al. (2014).
Processing of particle data
At the start of the calculations of the S-WPIA, data from the specified particle instruments are transferred to the SDRAM from each instrument’s assigned partition on the MDR. The sizes of the particle buffers in the SDRAM are decided based on the assigned network bandwidth of each particle instrument. A packet of particle data com-monly consists of a TI packet, event packet, and coun-ter-event packet. The TI packet is produced each time the S-WPIA clock counter is reset. The event packet is produced every time a single particle is detected and includes information on the S-WPIA clock counter at the time of particle detection, such as the energy and arrival direction of a particle. The counter-event packet is produced every 250 ms and includes the number of particle detections that are not transferred to the MDR, due to high particle count rates. The S-WPIA identifies the observation time of each particle using both TI and the S-WPIA clock counter that is included in the event packet. Furthermore, the correction of the known time delay between each sensor and its electronic circuit is considered. Each instrument has a quality flag in the event packet. The S-WPIA ignores the event packet when the quality flag shows bad-quality data.
Data handling
The use of multiple instruments increases the complex-ity of data handling. First of all, the data sizes between waves and particles are largely different. (The wave data size is approximately 10 times larger than that of the
particle data.) In addition, for wave processing such as FFT and calibration, large-size buffers are required on the SDRAM. Since the data size of the MGF is relatively small, all of the data generated during the calculation are stored into the SDRAM.
The wave data size that the PWE produces per unit time is constant and is determined by the sampling fre-quency, while the particle data vary depending on the intensity of the electron flux in the magnetosphere. The maximum production size of the particle data is limited by the data transmission bandwidth of the internal net-work. During the processing of the S-WPIA, while read-ing from the flash memory, the wave data are allocated on the SDRAM for each 1 s of data, while the particle data are allocated for each 10 s of data. The algorithm always checks the start/end time (given by the set of containing the TI and S-WPIA clock) of WFC data allocated on the SDRAM buffer. During the S-WPIA processing, when the time tag of a particle-event data exceeds the end time of a wave dataset, it then shifts to the processing of the next particle instrument dataset. When there are no par-ticle datasets in the buffer, a new dataset is transferred from the MDR partition to the SDRAM buffer. The raw data used in the calculations are compressed and sent to the flash memory of the MDR as processed data to vali-date the calculation results on the ground. The handling of this data is managed using a flag set by the perform-ing calculations. When there are no data in the MDR, the calculations for the instrument are excluded from the calculation sequence (controlled by the flag). When there are no more particle data on the SDRAM within the time range of the allocated wave data of SDRAM, then new wave data are transferred into the SDRAM from the MDR.
Computation of W
The S-WPIA calculates Ew·v , Bw·v , and σw using the
wave and particle datasets for the specified time span. The calculation procedure of the S-WPIA is as follows:
1. The S-WPIA extracts the S-WPIA clock counter, energy, and arrival direction of a particle from each event packet. Then, the observation time of each particle is determined by combining the TI in the TI packet with the S-WPIA clock counter in the event packet. The S-WPIA processes the particle data in the following order: MEP-e, HEP-L, HEP-H, and XEP. (process A in Fig. 4)
at the time tag of the particle. The interpolation is also applied to the MGF data to obtain an instantane-ous background magnetic-field vector. (process B) 3. Since the electric-field sensor along the spin axis
is not equipped in the Arase satellite (see Kasahara et al. 2018b), the S-WPIA computes the third com-ponent of the wave electric-field vector oriented to the spin axis ( Ez ), using the relation Ew·Bw=0
under the assumption that the electromagnetic wave arrives from one direction. (process C)
4. The W =Ew·v , Bw·v , pitch angle α , and phase
dif-ference ζ are calculated for each individual particle.
Details of the calculations are described below. (pro-cess D).
The S-WPIA calculates the quantities of the parallel and perpendicular wave components with respect to the ambient magnetic field B0 by the following procedure. The parallel and perpendicular components of the wave electric-field vector ( Ew , Ew⊥ ) can be expressed by
where eB0 is the unit vector of B0 . The parallel and per-pendicular components of both the wave magnetic-field vector ( Bw , Bw⊥ ) and velocity vector ( v , v⊥ ) are obtained
by the same procedure. The pitch angle α is given by
The arccosine is obtained by referring to a conversion table, without the use of mathematical operations. The phase difference ζ between v⊥ and Bw⊥ is obtained by
Since ζ is defined from 0◦ to 360◦ , we refer to the sign of
to determine the corresponding quadrant. The S-WPIA collects the integrated data described above for each particle instrument, stores the data with an embedded header describing the integration and compression, and then transfers the data to the processed data partition of the MDR.
These quantities are integrated over a specific time interval (10 ms) in the form of 3D arrays Wint(K,α,ζ ) ,
The time interval can be set arbitrarily using commands and is typically shorter than the time scale (typically 100 ms) of the frequency variation of a chorus element. This improves the signal-to-noise ratio of the S-WPIA because the frequency variation changes the energy and pitch angle ranges of electrons, satisfying the cyclotron resonance condition.
Verification of W calculation algorithm
Katoh et al. (2013) demonstrated the validity of the cal-culation method in the WPIA by conducting pseudo-calculations of the WPIA using the data obtained by the particle simulations that represent the resonance between whistler-mode chorus waves and energetic trons. The simulation was a one-dimensional (1D) elec-tron-hybrid code with a dipole magnetic field near the magnetic equator. The times for the wave fields and parti-cle velocities were represented as discrete time steps. The accumulated Wint (Eq. 3) showed a negative value
exceed-ing the standard deviation σw (Eq. 2) during the
genera-tion of whistle-mode chorus elements. The variagenera-tion in
Wint represented the energy transfer from particles to
waves.
To verify the validity of the S-WPIA implemented onboard the Arase, we calculated Wint and σw through
the onboard S-WPIA software, using the simulation data obtained by Katoh et al. (2013) instead of the observation data acquired by the Arase. The time resolution of a time tag in the simulation is constant because the simulation advances waves and particles in each discretized time step. The algorithm of the S-WPIA is executed by refer-ring the time tag. With respect to the time tag of indi-vidual particles in the simulation data, we calculated and accumulated W using wave fields with corresponding timing. The calculation results generated by the onboard S-WPIA and by Katoh et al. (2013) are shown in Fig. 5. In the same manner as the simulation, particles with a pitch angle of 100◦–110◦ and energy values ranging from 200
to 400 keV were used in the S-WPIA. The resolution of ζ
was 15◦ in the simulation, whereas the minimum
resolu-tion of ζ in the onboard S-WPIA is 30◦ . The results of the
time variation Wint of integrated Ew·v and the ζ
distribu-tion obtained by the S-WPIA show good agreement with those from the simulation obtained by Katoh et al. (2013). This agreement denotes that the onboard S-WPIA soft-ware correctly works on the Arase.
Optional processing
The S-WPIA is equipped with some optional processing modes to improve the statistical significance of its output.
Other emissions (e.g., electron cyclotron harmonic waves, MSWs) appear with the chorus waves. When this happens, the waveform of chorus elements to be ana-lyzed by the S-WPIA is contaminated. Since the contami-nation reduces the statistical significance of the S-WPIA output, a spectral extraction method is applied to remove the other emissions. During the calibration procedure for wave electromagnetic fields, after passband processing with fixed frequencies, the most intense spectral compo-nent and the adjacent two compocompo-nents are used to recon-struct the calibrated waveform. The other frequency components are set to zero. An appropriate frequency resolution and a window function are selected for the spectral extraction.
To improve the signal-to-noise ratio of the S-WPIA output, we can focus on particles with kinetic energies and pitch angles that satisfy the cyclotron resonance con-dition in chorus emissions. The resonance velocity VR for waves propagating purely parallel to the background magnetic field is given by
(11) VR=
ω−�e/γ k�
,
where ω is the wave frequency, e is the local electron
gyrofrequency, and k is the parallel component of the wave number of whistler-mode waves, given by
where ωpe is the electron plasma frequency. During the computation of resonance velocity, the wave frequency of the dominant mode is used, which is obtained in the FFT analysis for a time interval during which the cho-rus frequency does not vary largely over time. Since ωpe is needed to compute the resonance velocity, we refer to the upper hybrid resonance frequency ( ωUHR ) provided by the PWE high-frequency analyzer (Kumamoto et al.
2018) every second via the relay packet. The plasma fre-quency can be obtained from
With respect to the computed resonance velocity, we can select particles that satisfy the resonant condition with
(12) k�2=
ω
c
2
1+ ω
2 pe
ω(�e−ω)
,
(13)
ωUHR2 =ωpe2 +�2e.
a
b
Fig. 5 Calculation results of Wint and ζ distribution. (top) Time variation of Wint . The solid line indicates the Wint and the dashed lines indicate
the observed chorus elements for the calculations of the S-WPIA.
In the nominal observation mode, the PWE captures waveforms at a sampling frequency of 65 kHz. A higher sampling frequency of 120 kHz is available only for the wave electric field to obtain the amplitude and phase of the waveform with better time resolution. At this higher sampling rate, the waveform is intermittently transferred to the MDR due to the assignment of the transmission band. The frequency resolution of the spectra is deter-mined by the number of data points used in the S-WPIA calculation, and this number is automatically adjusted to match the frequency resolution of the 65 kHz sampling mode.
Conclusions
In this paper, a detailed design of the application of the S-WPIA onboard the Arase satellite to the exploration of wave–particle interactions in the magnetosphere is described. The basic purpose of the WPIA is to measure the energy transfer between plasma waves and charged particles. The application is installed in the onboard MDP/MDR#1 and #2, which have a large memory of 32 GB for storing high-resolution data. The application col-lects the wave electric- and magnetic-field waveforms that are sampled at 65 kHz using the PWE; raw data of individual detected particles are provided by MEP-e, HEP-L/H, and XEP, and the background magnetic-field data are measured by the MGF. Each instrument moni-tors the relay packet traveling through the system net-work and generates a dataset dedicated to the S-WPIA when the appropriate flag generated by the S-WPIA is detected. Data for the S-WPIA are stored on the MDR, and data processing begins when the S-WPIA receives a command specifying the time interval of the subject to be applied to the calculations of the S-WPIA. The cal-culation process includes FFT, IFFT, bandpass-filtering, data search, interpolation, and coordinate conversion. The large amount of raw data from multiple instruments makes data handling complicated. The algorithm of the S-WPIA contains certain techniques that are suitable for reducing the computation time to conserve onboard spacecraft resources. To the best of our knowledge, this is the first study that describes the computation techniques of the WPIA implemented onboard the spacecraft. The S-WPIA is a sophisticated tool for studying wave–parti-cle phenomena at the frontier of space exploration.
Authors’ contributions
MH designed and implemented the software and was mainly responsible for writing the paper. HK supervised the overall development of the S-WPIA system. YK and MK contributed to theoretical considerations. HK and YK contributed to the preparation of the manuscript. YM managed the science data acquisition. YK, SK, TM, NH, AM, SY, and SM provided scientific data to
implement the S-WPIA. KA and TT managed the overall mission system to acquire the data. All authors read and approved the final manuscript.
Author details
1 Institute of Space and Astronautical Science, Japan Aerospace
Explora-tion Agency, 3-1-1 Yoshinodai, Chuo-ku, Sagamihara, Kanagawa 252-5210, Japan. 2 Research Institute for Sustainable Humanosphere, Kyoto University,
Gokasho, Uji, Kyoto 611-0011, Japan. 3 Department of Geophysics, Graduate
School of Science, Tohoku University, 6-3 Aramaki-aza-aoba, Aoba, Sendai, Miyagi 980-8578, Japan. 4 Graduate School of Natural Science and Technology,
Kanazawa University, Kakuma, Kanazawa, Ishikawa 920-1192, Japan. 5 School
of Science, The University of Tokyo, 7-3-1 Hongo, Bunkyo-ku, Tokyo 113-0033, Japan. 6 Japan Aerospace Exploration Agency, 2-1-1 Sengen, Tsukuba, Ibaraki
305-8505, Japan. 7 Institute for Space-Earth Environmental Research, Nagoya
University, Furo-cho, Chikusa-ku, Nagoya, Aichi 464-8601, Japan. 8 Osaka
University, Toyonaka, Osaka 560-0043, Japan.
Acknowledgements
The authors express their sincere gratitude for the significant contributions made by all members of the ERG project. This study is supported by Grants-in-Aid for Scientific Research (17H06140, 16H06286, 15H05815, 15H05747, and 15K17771) of the Japan Society for the Promotion of Science. This work was carried out as a joint research program with the Institute for Space-Earth Environmental Research (ISEE), Nagoya University. The authors wish to thank the late Professor Takayuki Ono for his valuable discussions and continuous encouragement during this study.
Competing interests
The authors declare that they have no competing interests.
Availability of data and materials
Not applicable.
Ethics approval and consent to participate
Not applicable.
Publisher’s note
Springer Nature remains neutral with regard to jurisdictional claims in pub-lished maps and institutional affiliations.
Received: 7 September 2017 Accepted: 1 May 2018
References
Baker DN, Blake JB, Klebesadel RW, Higbie PR (1986) Highly relativistic electrons in the Earths outer magnetosphere: 1. Lifetimes and temporal history 1979–1984. J Geophys Res 91(A4):4265–4276. https ://doi. org/10.1029/JA091 iA04p 04265
Blake JB, Selesnick RS, Baker DN, Kanekal S (2001) Studies of relativistic electron injection events in 1997 and 1998. J Geophys Res 106(A9):19157–19168. https ://doi.org/10.1029/2000J A0030 39
Elkington SR, Hudson MK, Chan AA (2003) Resonant acceleration and diffusion of outer zone electrons in an asymmetric geomagnetic field. J Geophys Res 108(A3):1116. https ://doi.org/10.1029/2001J A0092 02
Fukuhara H, Kojima H, Ueda Y, Omura Y, Katoh Y, Yamakawa H (2009) A new instrument for the study of waveparticle interactions in space: one-chip waveparticle interaction analyzer. Earth Planets Space 61:765. https ://doi. org/10.1186/BF033 53183
Green JC, Kivelson MG (2004) Relativistic electrons in the outer radiation belt: differentiating between acceleration mechanisms. J Geophys Res 109:A03213. https ://doi.org/10.1029/2003J A0101 53
Hikishima M, Katoh Y, Kojima H (2014) Evaluation of waveform data processing in Wave--Particle Interaction Analyzer. Earth Planets Space. https ://doi. org/10.1186/1880-5981-66-63
Space weather. American Geophysical Union, Washington. https ://doi. org/10.1029/GM125 p0289
Kasahara S, Yokota S, Mitani T, Hirahara M, Shibano Y, Takashima T (2018a) Medium-energy particle experiments—electron analyzer (MEP-e) for the Exploration of energization and radiation in geospace (ERG) mission. Earth Planets Space. https ://doi.org/10.1186/s4062 3-018-0847-z Kasahara Y, Kasaba Y, Kojima H, Yagitani S, Ishisaka K, Kumamoto A, Tsuchiya
F, Ozaki M, Matsuda S, Imachi T, Miyoshi Y, Hikishima M, Katoh Y, Ota M, Matsuoka A, Shinohara I (2018b) The plasma wave experiment (PWE) on board the Arase spacecraft. Earth Planets Space. https ://doi.org/10.1186/ s4062 3-018-0842-4
Katoh Y, Kitahara M, Kojima H, Omura Y, Kasahara S, Hirahara M, Miyoshi Y, Seki K, Asamura K, Takashima T, Ono T (2013) Significance of waveparticle interaction analyzer for direct measurements of nonlinear waveparticle interactions. Ann Geophys 31:503–512
Katoh Y, Kojima H, Hikishima M, Takashima T, Asamura K, Miyoshi Y, Kasahara Y, Kasahara S, Mitani T, Higashio N, Matsuoka A, Ozaki M, Yagitani S, Yokota S, Matsuda S, Kitahara M, Shinohara I (2018) Software-type Wave--Particle Interaction Analyzer on board the Arase satellite. Earth Planets Space. https ://doi.org/10.1186/s4062 3-017-0771-7
Kumamoto A, Tsuchiya F, Kasahara Y, Kasaba Y, Kojima H, Yagitani S, Ishisaka K, Imachi T, Ozaki M, Matsuda S, Shoji M, Matsuoka S, Katoh Y, Miyoshi Y, Obara T (2018) High frequency analyzer (HFA) of plasma wave experi-ment (PWE) onboard the Arase spacecraft. Earth Planets Space. https :// doi.org/10.1186/s4062 3-018-0854-0
Li W, Thorne RM, Angelopoulos V, Bortnik J, Cully CM, Ni B, LeContel O, Roux S, Auster U, Magnes W (2009) Global distribution of whistler-mode chorus waves observed on the THEMIS spacecraft. Geophys Res Lett 36:L09104. https ://doi.org/10.1029/2009G L0375 95
Martin GNN (1979) Range encoding: an algorithm for removing redundancy from a digitized message presented in video and data recording confer-ence, Southampton, July 24–27
Matsuda S, Kasahara Y, Kojima H, Kasaba Y, Yagitani S, Ozaki M, Imachi T, Ishi-saka K, Kumamoto A, Tsuchiya F, Ota M, Kurita S, Miyoshi Y, Hikishima M, Matsuoka A, Shinohara I (2018) Onboard software of plasma wave experi-ment aboard Arase: instruexperi-ment manageexperi-ment and signal processing of waveform capture/onboard frequency analyzer. Earth Planets Space. https ://doi.org/10.1186/s4062 3-018-0838-0
Matsuoka A, Teramoto M, Nomura R, Nose M, Fujimoto A, Tanaka Y, Shinohara M, Nagatsuma T, Shiokawa K, Obana Y, Miyoshi Y, Mita M, Takashima T, Shinohara I (2018) The ARASE (ERG) magnetic field investigation. Earth Planets Space. https ://doi.org/10.1186/s4062 3-018-0800-1
Meredith NP, Horne RB, Iles RHA, Thorne RM, Heynderickx D, Anderson RR (2002) Outer zone relativistic electron acceleration associated with substorm-enhanced whistler mode chorus. J Geophys Res. https ://doi. org/10.1029/2001J A9001 46
Miyoshi Y, Morioka A, Obara T, Misawa H, Nagai T, Kasahara Y (2003) Rebuilding process of the outer radiation belt during the 3 November 1993 mag-netic storm: NOAA and Exos-D observations. J Geophys Res 108(A1):1004. https ://doi.org/10.1029/2001J A0075 42
Miyoshi Y, Ono T, Takashima T, Asamura K, Hirahara M, Kasaba Y, Matsuoka A, Kojima H, Shiokawa K, Seki K, Fujimoto M, Nagatsuma T, Cheng CZ, Kazama Y, Kasahara S, Mitani T, Matsumoto H, Higashio N, Kumamoto A, Yagitani S, Kasahara Y, Ishisaka K, Blomberg L, Fujimoto A, Katoh Y, Ebihara Y, Omura Y, Nose M, Hori T, Miyashita Y et al (2013) The energization and radiation in geospace (ERG) project. In: Summers D, Mann IR, Baker DN, Schulz M (eds) Dynamics of the earths radiation belts and inner magne-tosphere. American Geophysical Union, Washington
Omura Y, Nunn D (2011) Triggering process of whistler mode chorus emissions in the sphere. J Geophys Res 116:A05205. https ://doi.org/10.1029/2010J A0162 80
Omura Y, Furuya N, Summers D (2007) Relativistic turning acceleration of reso-nant electrons by coherent whistler mode waves in a dipole magnetic field. J Geophys Res 112:A06236. https ://doi.org/10.1029/2006J A0122 43 Ozaki M, Yagitani S, Kasahara Y, Kojima H, Kasaba Y, Kumamoto A, Tsuchiya F,
Matsuda S, Matsuoka A, Sasaki T, Yumoto T (2018) Magnetic search coil (MSC) of plasma wave experiment (PWE) aboard the Arase (ERG) satellite. Earth Planets Space. https ://doi.org/10.1186/s4062 3-018-0837-1 Reeves GD, McAdams KL, Friedel RHW, OBrien TP (2003) Acceleration and loss
of relativistic electrons during geomagnetic storms. Geophys Res Lett 30(10):1529. https ://doi.org/10.1029/2002G L0165 13
Reeves GD, Spence HE, Henderson MG, Morley SK, Friedel RHW, Funsten HO, Baker DN, Kanekal SG, Blake JB, Fennell JF, Claudepierre SG, Thorne RM, Turner DL, Kletzing CA, Kurth WS, Larsen BA, Niehof JT (2013) Elec-tron acceleration in the heart of the Van Allen radiation belts. Science 341(6149):991–994. https ://doi.org/10.1126/scien ce.12377 43
Santolik O, Gurnett DA, Pickett JS, Parrot M, Cornilleau-Wehrlin N (2003) Spatio-temporal structure of storm-time chorus. J Geophys Res 108(A7):1278. https ://doi.org/10.1029/2002J A0097 91
Shprits YY, Elkington SR, Meredith NP, Subbotin DA (2008) Review of modeling of losses and sources of relativistic electrons in the outer radiation belt I: radial transport. J Atmos Sol Terr Phys 70(14):1679–1693
Summers D, Omura Y (2007) Ultra-relativistic acceleration of electrons in planetary magnetospheres. Geophys Res Lett 34:L24205. https ://doi. org/10.1029/2007G L0322 26
Summers D, Thorne RM, Xiao F (1998) Relativistic theory of waveparticle reso-nant diffusion with application to electron acceleration in the magneto-sphere. J Geophys Res 103(A9):20487–20500
Takashima T, Ogawa E, Asamura K, Hikishima M (2018) Design of a mission network system using SpaceWire for scientific payloads onboard the Arase spacecraft. Earth Planets Space. https ://doi.org/10.1186/s4062 3-018-0839-z