FRONTIER LETTER
Volcanic activity on Io and its influence
on the dynamics of the Jovian magnetosphere
observed by EXCEED/Hisaki in 2015
Ichiro Yoshikawa
1*, Fumiharu Suzuki
1, Reina Hikida
1, Kazuo Yoshioka
1, Go Murakami
2, Fuminori Tsuchiya
3,
Chihiro Tao
4, Atsushi Yamazaki
2, Tomoki Kimura
5, Hajime Kita
3, Hiromasa Nozawa
6and Masaki Fujimoto
2Abstract
Jupiter’s moon Io, which orbits deep inside the magnetosphere, is the most geologically active object in the solar system. Kurdalagon Patera, a volcano on Io, erupted in 2015 and became a substantial source of Jovian magneto-spheric plasma. Based on Earth-orbiting spacecraft observations, Io plasma torus (IPT) exhibited the peak intensity (nearly double) of ionic sulfur emissions roughly 2 month later, followed by a decay phase. This environmental change provides a unique opportunity to determine how the more heavily loaded magnetosphere behaves. Indeed, the extreme ultraviolet spectroscope for exospheric dynamics onboard the Earth-orbiting spacecraft Hisaki witnessed the whole interval via aurora and IPT observations. A simple-minded idea would be that the centrifugal force acting on fast co-rotating magnetic flux tubes loaded with heavier contents intensifies their outward transport. At the same time, there must be increased inward convection to conserve the magnetic flux. The latter could be accompanied by (1) increased inward velocity of field lines, (2) increased frequency of inward transport events, (3) increased inward flux carried per event, or (4) combinations of them. The Hisaki observations showed that the densities of major ions in the IPT increased and roughly doubled compared with pre-eruption values. The hot electron fraction, which sustains the EUV radiation from the IPT, gradually increased on a timescale of days. Pairs of intensified aurora and IPT brighten-ing due to the enhanced supply of hot electrons from the mid-magnetosphere to the IPT upon aurora explosions observed during both quiet and active times, enabled the study of the mid-magnetosphere/IPT relationship. Hisaki observations under active Io conditions showed that: (1) the hot electron fraction in the torus gradually increased; (2) brightening pairs were more intense; (3) the energy supplied by the largest event maintained enhanced torus emission for less than a day; (4) the time delay of a torus brightening from a corresponding aurora intensification was roughly 11 h, that is, the same as during quiet times, suggesting that the inward convection speed of high-energy electrons does not change significantly.
Keywords: Jupiter, Io plasma torus, Extreme ultraviolet, Planetary plasma, Jovian magnetosphere, EXCEED, Hisaki spacecraft, Kurdalagon, Galilean moons, Injection
© The Author(s) 2017. This article is distributed under the terms of the Creative Commons Attribution 4.0 International License (http://creativecommons.org/licenses/by/4.0/), which permits unrestricted use, distribution, and reproduction in any medium, provided you give appropriate credit to the original author(s) and the source, provide a link to the Creative Commons license, and indicate if changes were made.
Introduction
Jupiter is a fast rotation planet that has Galilean moons, one of which is Io, the most volcanically active body in the solar system. Jupiter’s magnetosphere is the largest in size and the most powerful in energy among those of solar system planets. The solar wind (SW) stretches the
planetary magnetic field lines on the anti-solar side and creates a long magnetotail. The Jovian magnetosphere is traditionally divided into three regions: inner (equa-torial distance closer than 10 RJ, where RJ is the Jovian
radius = 71,492 km), middle (10–40 RJ), and outer (>40 RJ) magnetospheres, respectively. The magnetic field in
the inner magnetosphere remains approximately dipole-like, while neither the dipole shape of the middle nor that of the outer magnetospheric field lines are sub-stantially deformed. The geologically active Io, orbiting
Open Access
*Correspondence: yoshikawa@k.u-tokyo.ac.jp
at the jovicentric radial distance of ~6 RJ, releases up to
~1000 kg s−1 of volcanic gases (mainly SO
2 and its
frag-ments S and SO) into the inner part of the magneto-sphere (Thomas et al. 2004). The volcanic ejecta are break into their constituent atoms and orbit along the Io orbit. Neutral atoms are ionized dominantly by the reaction with ambient electrons and subsequently are accelerated to co-rotation speed (equals to Jovian System-III rota-tion period: 10 h) to move together with the magnetic field lines that are rooted in Jupiter (e.g., 540 eV for S+
ions). These magnetically picked-up ions form the torus-shaped distribution centered at 6 RJ, called Io plasma
torus (IPT). The kinetic energy of the ions then heats the electrons. Most of the energy radiates in the UV spectral range to the space. The radiation energy from the IPT is therefore supplied ultimately from the rotational energy of Jupiter. This basic idea was first introduced during the Voyager era (Broadfoot et al. 1979).
However, the energy source for IPT emissions still remains unclear. The energy picked up by ions can only fuel 34–74% of the IPT radiation (Delamere and Bage-nal 2003). Sophisticated models require an additional source of energy (Barbosa et al. 1985; Shemansky 1988; Delamere and Bagenal 2003; Delamere et al. 2005; Steffl et al. 2006). One of the feasible physical processes sup-plying additional energy is the inflow of hot electrons from the mid-magnetosphere. Indeed, the centrifugally driven interchange mode in the magnetosphere is consid-ered to sustain the inflow of hot electrons (Thorne et al.
1997). Two magnetic tubes should exchange their posi-tions, with the flux tube loaded with Io-origin ions out-ward and the buoyant flux filled with tenuous hot plasma inward (Cap 1976). The mass density radial profile in the Jovian magnetosphere is favorable for the operation of this interchange mode because Io fills the magnetic flux tube located inside with dense and heavy ions. The dis-covery of small-scale buoyant flux tubes by in situ meas-urements on the Galileo orbiter supports this scenario (Thorne et al. 1997). Sharply bounded buoyant magnetic flux tubes were very rarely encountered (0.2% per total measurement time), implying a small volume-filling fac-tor of the buoyant tubes.
The hot electron inflow to the IPT might be enhanced by events that are manifested as aurora brightenings. The energy stored in the magnetosphere with a stressed mag-netic field is transiently released. Spacecraft observations showed that high-energy electrons and ions of Jovian magnetospheres are sometimes accelerated toward Jupi-ter (Mauk et al. 2002), as seen in the Earth’s magneto-sphere (Kivelson and Russell 1995).
In the beginning of 2014, the Earth-orbiting spacecraft Hisaki observed unique phenomena; the Jovian aurora and IPT suddenly brightened and the time of the bright-enings correlated (see Fig. 1). This behavior suggests that hot electrons arrive at IPT from the mid-magnetosphere and fuel it (Yoshikawa et al. 2016). Yoshikawa et al. (2016) studied the hot electron transport between the two radial distances by treating the brightenings as markers. The
electrons responsible for the aurora and IPT emission have different energy ranges; however, it is considered that both populations are enhanced by the same ener-gized magnetic flux tubes convecting toward the planet. The travel time between two locations (aurora source region and IPT) was estimated from Hisaki observations to be approximately 11 h given the dynamic pressure of the SW is low (less than 0.1 nPa) and that the IPT radia-tion power remained stable at ~400 GW in the spectral range of 65–78 nm (Yoshikawa et al. 2016).
The geological conditions changed in the beginning of 2015. The Keck and Gemini N ground-based tel-escopes imaged Io over hundred nights in 2015. De Kleer and de Pater (2016a, b) conducted near-infrared (NIR) observations with adaptive optics to resolve the emission from individual volcanic hot spots. On Janu-ary 26, 2015, they detected an unusual eruption up to 68 GW µm−1 sr−1 classified as a “mini-outburst”, at
Kurdalagon Patera (48.8°N, 221.3°W), although the NIR brightness was below the detection limit (lower than a few GW µm−1 sr−1) on January 16. On March 27, the NIR
radiation level dropped to ~10 GW µm−1 sr−1. No
meas-urement was reported between January 26 and March 27, 2015 (see Fig. 8 in de Kleer and de Pater 2016a). The time evolution, that is, sudden appearance of emission, rapid decay, and high peak brightness, resembled that of the “mini-outburst”, but the peak brightness was a factor of ~5 lower. This 2-month outburst was expected to release substantial ejecta to the IPT; the density and composition of the IPT might change accordingly.
Continuous observations by Hisaki covering this whole period are unique and facilitate the study of the dynamics in the Jovian magnetosphere under active Io conditions. It is expected that volcanic ejecta filled the magnetic flux in the vicinity of Io after the volcanic gases arrived, the brightness of the IPT increased, and the outward trans-port of magnetic fluxes was enhanced due to the increase of centrifugal force acting on the heavy flux tubes. The corresponding inward convection of flux tubes must have been elevated to maintain flux conservation. This enhanced inflow could be realized by: (1) increased inward velocity of field lines, (2) increased frequency of inward transport events, (3) increased size of inward flux events, or (4) the combination of these characteristics.
Here, we present remote sensing observations of the Jovian aurorae and the IPT by Hisaki during the active period of the Kurdalagon volcano. The pairwise bright-ening events that were detected during the active period enabled us to study the mid-magnetosphere/IPT connec-tion under different condiconnec-tions. The aim is to determine whether the enhanced transport of magnetic flux of the IPT, outward and inward, affects mid-magnetospheric dynamics.
Instrumentation
The data were provided by EXCEED onboard the Earth-orbiting satellite Hisaki, which has produced quasi-con-tinuous extreme ultraviolet (EUV) spectral images of solar planetary exospheres since its launch in 2013 (Yosh-ioka et al. 2014; Masunaga et al. 2015). The EXCEED/ Hisaki observes a preselected target that satisfies the cri-terion that its elongation angle from the Sun exceeds 90° for outer planets or 25° for Venus and Mercury. In this study, we analyzed the dataset collected between Novem-ber 27, 2014, and May 14, 2015 (total of 168 days, obser-vation coverage time of ~50%). The obserobser-vation of Jupiter began when the elongation angle of the planet was 102° on November 27 (it reached opposition on February 6) and continued until the elongation angle reached 82° on May 14.
Figure 2a shows a typical EUV spectrum. A unique, narrow entrance slit in the center and broad widths on the sides, resembling a dumbbell shape, have been used
Fig. 2 a A typical EUV spectrum (53–147 nm) measured by the Hisaki spacecraft before the volcanic eruption. The spectrograph mixes spatial and spectral information on the X-axis, whereas the spatial information on the equatorial plane is represented on the Y-axis. Three types of origins are observed: Jupiter’s aurora, IPT, and geo-corona. b The slit shape of Hisaki and its position relative to Jupiter. The uniquely shaped slit is superimposed on the real, visible image of Jupiter taken by the Field-of-View guidance camera on Hisaki. The
since December 18, 2013 (except for some periods of high-resolution observations; Yoshioka et al. submit-ted). Quasi-continuous observations of the IPT simul-taneous with Jovian aurorae in the EUV spectral range (52–148 nm) were initiated. The central part of the slit was placed in the northern part of Jupiter; the sides were placed in the IPT position to enable simultaneous moni-toring of IPT and aurora by Hisaki.
The spectra show the emission features of three sources, Jupiter’s aurora, IPT, and geocorona. The aurora is observed on the disk of Jupiter and from 90 to 145 nm in the spectral range covering parts of the H2 Lyman
(B-X) and Werner band (C-X) emissions. The IPT is observed on both sides of Jupiter. Terrestrial emissions, called geocorona, are identified as slit-shaped illumina-tions at well-established wavelengths such as 121.6 nm (Lyman-alpha), 83.4 nm (ionic oxygen), and 58.4 nm (helium). The temporal resolution of the data is 1 min. Every orbital period of the spacecraft (104 min) was con-tinuously monitored for 40 min (Yoshikawa et al. 2014). The apparent position of the slit relative to Jupiter is presented in Fig. 2b. This position is monitored by an onboard Field-of-View guiding camera, and possible slip-page is corrected by an onboard attitude control system; therefore, continuous monitoring of the two key targets within 5 arcseconds is ensured (Yamazaki et al. 2014).
Io environment during this period
As stated previously, the geological conditions on Io started to change in the beginning of 2015. Ground-based observations in the NIR spectral range indicated an unusual eruption of Kurdalagon Patera, classified as a “mini-outburst”, on January 26, 2015. Because of sparse of observations, the exact start date of the erup-tion is unknown. Based on the informaerup-tion that the NIR brightness was below the detection limit on January 16, increased to 68 GW µm−1 sr−1 on January 26, and
dropped to ~10 GW µm−1 sr−1 on March 27 (see Fig. 8
in de Kleer and de Pater 2016a), the eruption might have started between January 16 and 26.
The SW affects the environment of the IPT and the Jovian magnetosphere. Murakami et al. (2016) investi-gated the contribution of the dynamic SW pressure to the IPT environment. They detected occasions when the dusk/dawn brightness ratio of the IPT was enhanced in response to rapid increase of the dynamic SW pressure. These observations indicated that the dawn-to-dusk electric field over the inner magnetosphere is enhanced under compressed SW conditions. To remove the effect of the SW on the IPT, the SW conditions around Jupi-ter that correspond to Hisaki’s observation period must be determined. Because of the lack of SW measurements in the vicinity of Jupiter, we extrapolated the SW data
measured on Earth using the simulation of the magneto-hydrodynamic propagation (Fig. 3e). The uncertainty of the arrival time of SW at Jupiter is expected to be ≤24 h at the elongation angle of the observation conditions (Tao et al. 2005).
The SW conditions from November 2014 to March 2015 were less quiet than that in a previous study (Yoshi-kawa et al. 2016). The dynamic SW pressure increased suddenly on day-of-year (DOY) −10, 11, 47, 66, and 74 in 2015. Discontinuous increase of the dynamic SW pres-sure, which is typical for forward shocks, might influence the IPT environment.
What did Hisaki observe during this period?
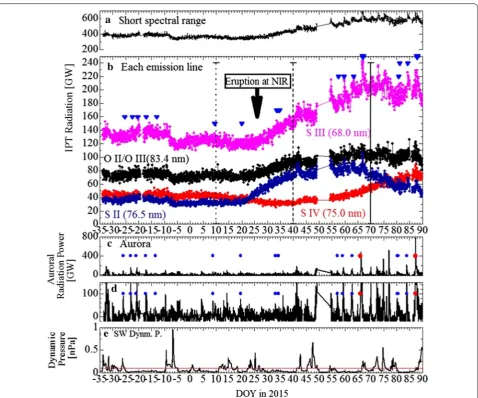
Figure 3a–d shows the long-term light curves of the IPT and aurorae observed by Hisaki. The curve in Fig. 3a pre-sents the IPT radiation power based on binning over a shorter EUV range (65–78 nm) and shows that the inten-sity started to increase near DOY 21 and had doubled (~750 GW) by DOY 70. The IPT emission at 83.4 nm (ionic oxygen) is important for studying the composition of the IPT. The contamination due to the geocorona was relatively low during midnight observations by Hisaki. However, we excluded this emission from the spectral bin-ning to increase the signal-to-noise ratio. Figure 3b pre-sents each emission light curve; it shows that singly ionized sulfur emission (S II) was the first to become brighter (at ~DOY 21) and that the enhancement of doubly ionized (S III) emission followed (at ~DOY 24). The radiation power of S II and S III emissions increased at approximately the same rate, 2.1 and 2.2 GW day−1, respectively, whereas the
rise of S III was delayed by 3 days. Sharp IPT brightenings (short timescale brightenings) were apparent for S II and S III, especially after DOY 40.
Despite of the sparse observations in the NIR range, the Kurdalagon eruption must have occurred between DOY 16 and 26. The gradual increase of the IPT radiation power detected by Hisaki beginning on DOY 21 is consist-ent with the eruption date implied by NIR observations.
Based on the available information and simulation, we conclude that the eruption of Kurdalagon Patera very likely contributed to the gradual enhancement and sub-sequent variation of the IPT radiation power observed by Hisaki.
The time lag between the material eruption from Io and the time when it ionized and joined the IPT should be considered; however, presently, it can be only concluded that this lag was shorter than 5 days.
Data analysis
Figure 4a–c presents examples of EUV spectra in the shorter spectral range, showing S II (64.2 nm), S IV (65.7 nm) S III (68.0 nm), S III (70.3 nm), S III (72.9 nm), S IV (75.0 nm), and S II (76.5 nm). These spectra were
obtained on DOY 10 (before the eruption, quiet phase), DOY 40 (rising phase of the eruption), and DOY 70 (at peak radiation). These DOYs are marked by lines in Fig. 3b.
Figure 4d shows the spectra after the spatial binning on both ansae. It is apparent that the brightness increased over time at most wavelengths, although there are excep-tions such as S II (65.7 nm) and S IV (75.0 nm). The non-uniform evolution of spectral features indicates changes of the ionic composition and hot electron fraction in the IPT.
A spectral diagnosis method can be adapted to deduce the column densities of the ionic components. The basis of this method was introduced in detail by Shemansky (1980) and Steffl et al. (2004); it has been used for our Hisaki data analysis (Yoshioka et al. 2014; Tsuchiya et al. 2015). We applied the spectral diagnosis method to the spectra obtained on DOY 10, 40, and 70; the plasma densities of ions and two electron energies (<10 eV, cold; ~100 eV, hot) were used as parameters. Energetic electrons, responsible for aurora brightenings, are insensitive to spectral diagno-sis in the EUV range and therefore were not included in this study. The calculation scheme and related assumptions
were previously described in Yoshioka et al. (2011); how-ever, in this study, the latest atomic database (CHIANTI Version 7.1.3) was employed. The deduced parameters, ion densities and hot electron fractions (Fh), are displayed
in Fig. 4d. Here, we assumed constant densities along the line-of-sight, which intersects with the torus (length: ~9
RJ).
Next, we examined the time lag between the IPT and internally driven aurora brightenings using the same methods and criteria that were previously employed (Yoshikawa et al. 2016). To remove the influence of SW variation and to examine the influence of volcanic activ-ity alone on the IPT, we excluded the dataset obtained when the dynamic SW pressure was higher than 0.1 nPa, as studied by Kimura et al. (2015) and Yoshikawa et al. (2016).
Figure 5 shows enlarged plots of Fig. 3a, d, e to focus on the event that occurred on DOY 59 when the aurora and IPT were brightened and correlated. The bright-ening durations of the IPT and aurora were not longer than 10 h. The nature of the IPT response to the aurora was reported in Yoshikawa et al. (2016) who analyzed a
dataset recorded under quiet SW conditions and volcanic activity on Io.
The dataset of the previous Jupiter observation cam-paign from December 2013 to January 2014 includes short-term (not longer than one Jovian planetary rota-tion) aurora intensifications under quiet SW conditions (Kimura et al. 2015; Badman et al. 2016). These short-duration events were regarded as internally driven com-pared with intensifications lasting for more than 2 days
under high SW pressure conditions, which were defined as externally driven (Kimura et al. 2015).
We defined the transient aurora event on DOY 59 as internally driven based on the same criteria for data selection used in previous studies: (1) the dynamic SW pressure was lower than 0.1 nPa 24 h before and after transient events were observed and (2) the transient aurora lasted less than one planetary rotation (10 h). Here, we defined the beginning of the upward deviation as the brightening time, as indicated by a vertical line in Fig. 5. The error bars are also indicated.
On DOY 59, the IPT brightening lagged ~13 h behind the auroral brightening. In the same manner as described for DOY 59, we identified 21 brightening pairs, that is, 21 major elevated features of the IPT light curve accom-panied precursory transient enhancements of aurorae. Figure 6b shows the time lag measured during the vol-canically active period, whereas Fig. 6a represents the quiet period of the volcano in 2014 (Yoshikawa et al.
2016).
Discussion
The ionic composition of the IPT changed during Io’s volcanically active period. In the beginning phase of the eruption (DOY 10–40), the density of singly and doubly ionized sulfur increased (S+: 80–200 cm−3, S2+: 200–
300 cm−3; see numbers in Fig. 4), whereas the density of
S3+ decreased by a factor of 2. This relationship can be
ascribed to a scenario in which (1) the volcanic erup-tion provided ejecta to the IPT; and (2) the electron impact increased the density of S+ (and later S2+), but the Fig. 5 a Aurora and IPT brightenings on day-of-year (DOY) 59. The
periodic System-III variation (period: 10 h) has been removed from the original aurora light curve. The vertical lines indicate the start times of the brightenings. The error bars for the time are also pre-sented. b Prediction of the dynamic SW pressure
increase of neutrals was accompanied by a decrease in the density of S3+ (70–50 cm−3) because of charge exchange.
On DOY 36 (roughly 15 days after the increase of S II), the density of S3+ began to increase because of electron
impact with abundant S2+. The ultraviolet spectrometer
on the Cassini spacecraft detected ionic compositional change during the decay phase of volcanic activity (Steffl et al. 2004), which is similar to the evolution observed by Hisaki after DOY 70, although the rising phase of total brightness was not captured. Our results are the first to show temporal variations of the ionic compositions in the initial phase of volcanic activity on Io.
The hot electron fraction, deduced from three spectra on DOY 10, 40, and 70, gradually increased. Dramatically large brightenings occurred between DOY 40 and 70. The spectral diagnosis indicated an increase in the hot electron fraction with each event (e.g., on DOY 59, the fraction increased from 2.4 to 3.0%); however, the fraction returned to pre-brightening power within a day, as observed for the total radiation power of the IPT. The average hot electron fraction increased gradually and independently of the brightening pair (Hikida et al. in preparation).
The sizes of the error bars in Fig. 6 are mainly attrib-uted to the discontinuity of Hisaki observations because Hisaki cannot observe Jupiter during daytime. Under dif-ferent volcanic conditions, the measured time lags (11 h) are slightly longer than the period of Jovian magneto-spheric rotation. During Kurdalagon’s volcanically active period, the average time lag increased by half an hour and the greatest amount of scatter in the data points was obtained. These findings suggest that the inward velocity of the magnetic field lines with hot electrons might not increase significantly (<5%).
The frequency of the IPT brightening events trig-gered by internally driven aurorae did not increase after the eruption (Fig. 3). Except for the periods of increased dynamic SW pressure, the frequency of the brightening pairs remained unchanged (the average cycle of appear-ance is approximately 5 days). However, the brightening pairs were more intense than those before the erup-tion. Before the eruption, the upward deviation of the IPT was 20–30 GW per event, whereas it was roughly 100 GW after the eruption (Fig. 3a, b). The outbreak of intense brightening pairs is considered not only the result of increased ionic density but also increased hot elec-tron fraction (Note that the ionic density had doubled at its maximum, as shown in Fig. 4d). In summary, the dense magnetospheric conditions increased the intensity of brightening pairs; these dense conditions might have induced inward transportation accompanied by more hot electrons in the mid-magnetosphere.
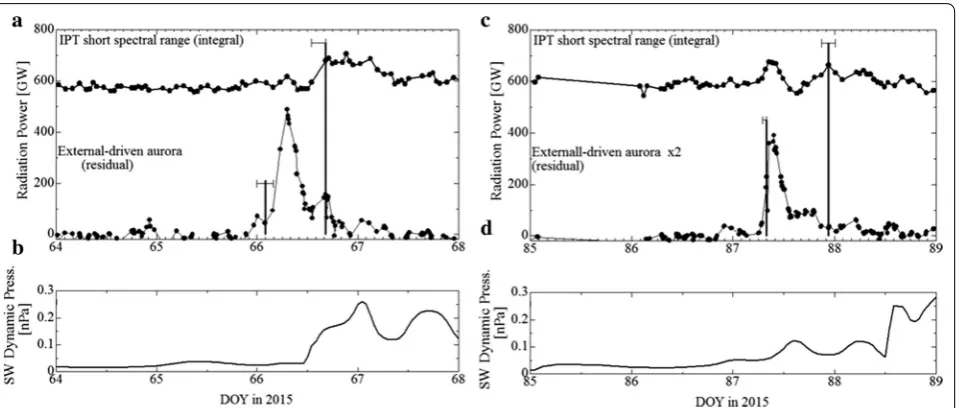
During active SW periods (dynamic pressure >0.1 nPa), the brightening pair showed a unique behavior. Figure 7
shows examples for DOYs 66 and 87. Both DOYs are indicated by red marks in Fig. 3b–d. In both cases, the quiescent intervals of SW lasted for days immediately pre-ceding the aurora brightenings. An unprecedented aurora intensification, exceeding 400 GW, occurred on DOY 66 (Fig. 7a) and the most intense transient, approaching 800 GW, took place on DOY 87 (Fig. 7c). These events were enhanced due to the long quiescent intervals of SW (Kita et al. 2016) and increase of ion and hot electron densities during high volcanic activity. Figure 7b is the prediction of the dynamic SW pressure, showing that the quies-cent interval of SW lasted for at least 2 days (it lasted for 10 days, not shown in the figure) before the discontinu-ous increase of the dynamic SW pressure. Note that the uncertainty of the arrival time should be considered, as stated previously. The aurora and IPT seemed to have brightened at the same time. The late brightening, which might be identical to the one during the quiet period of SW, occurred 14.4 h later. Based on the spectral diagnosis, a temporal increase of the hot electron fraction from 2 to 4% was expected on DOY 66; the fraction then decreased to the pre-brightening level within 1–2 days. Figure 7c, d shows a similar event on DOY 87 during which two IPT brightenings occurred and correlated with one auro-ral transient. The quiescent interval before the aurora brightening was 7 days (not shown in the figure). The late brightening lagged 14.6 h behind the aurora enhance-ment, accompanied by the temporal hot electron increase from 5 to 7% (Hikida et al. in preparation).
The time difference between the simultaneous bright-ening of the IPT and aurora transient was not measure-able due to the poor time resolution in this study. The correlation between the simultaneous brightening of IPT and the aurora can be explained by faster inward veloc-ity from distant regions. If we assume that hot electrons travelled from the middle magnetosphere (20 RJ) and the
apparent simultaneous brightening of IPT was delayed by 1 h (comparable with the time resolution in this study), the inward velocity would have been 300 km s−1.
How-ever, given the small number of clear events, it is difficult to draw definitive conclusions about the simultaneous brightening of IPT during the active period of SW. Fur-thermore, in most cases, it is difficult to determine the brightening timing with the present method because the rising time of the late brightening is unknown. We selected a few clear brightening pairs (as shown in Fig. 7); the time lag ranged from 10 to 15 h. Further investigation is necessary after revision of the present method. Super-posed epoch analysis might be effective.
quiescent intervals longer than 5 days. The intervals induced the largest brightening of IPT and aurora.
Based on the small number of events during active SW, we note that (1) the brightenings were intense after long quiescent intervals, (2) the transient IPT light curve had two peaks in some cases, where the former was simul-taneous with the aurora and the latter lagged roughly 10–15 h behind.
Remote sensing methods are used to measure the col-umn density along the line-of-sight and the volume-fill-ing factor of the inward flux tubes is low; therefore, even if out-reaching Io-genic structures peeled off outwards from the IPT (Yang et al. 1994), they were invisible in the spectrum. This is a methodological limit of the remote sensing technique.
Measurements of the radial distance of 10–13 RJ using
a plasma particle detector on the Galileo spacecraft indi-cated hot plasma injection for more than 6 h (Mauk et al.
2002). This timescale is roughly equivalent to that of the IPT brightenings observed by Hisaki (Fig. 5). However, the plasma densities at 10–13 RJ are too low for Hisaki
to detect any emissions from this region. In terms of the timescale, it can be noted that the short-term IPT bright-enings might have hot electrons of the same origin as the plasma injection discovered by the Galileo spacecraft.
Conclusions
The geological change on Io associated with the Kurda-lagon Patera eruption in the beginning of 2015 most likely changed the environment on the IPT. This dra-matic environmental change provides us with a unique opportunity to determine the characteristics of the more
heavily loaded magnetosphere using the Hisaki space-craft. It should take some time for volcanic ejecta to be ionized, fill magnetic flux tubes, and increase the power of radiation from the IPT; however, this time lag was not measured. It must have been shorter than 5 days. During the initial phase of the event, the emission of S+
bright-ened first; S2+ followed after a 3 days delay. The density
and emission of S3+ decreased because of loss due to the
charge exchange with abundant neutrals. The follow-ing composition evolution observed by Hisaki, based on which S3+ emissions became brighter and those of S+ and
S2+ dimmer, was similar to that observed by Cassini.
With respect to the magnetospheric reaction to the environment change of plasma density, we have found that (1) the hot electron fraction, which is responsible for the radiation power in the shorter EUV range, gradu-ally increased in the IPT with an independent outburst of the brightening pair; (2) the responses of IPT bright-enings to internally driven aurorae, which presumably result from the inward transfer of high-energy electrons from the distant region, were delayed by roughly 11 h and this time lag does not seem to change in comparison with that during volcanic inactivity; (3) the outburst fre-quency of brightenings did not increase; (4) the amount of hot electrons in the IPT temporally increased after the auroral transient. The brightening pairs were more intense. The intensified aurora is evidence showing that the inner region of the magnetosphere influences the distant regions and that the two distant regions are con-nected; and (5) even the energy supplied by the largest event maintained the enhanced torus emission for less than a day only. The apparently large energy input, which
was triggered by the aurora intensifications, did not tribute to the average radiation power in the IPT. It con-tributed to temporally fuel the IPT. Therefore, small-scale transfer, which was invisible in the spectrum, might be present and supply the energy to the IPT.
Abbreviations
DOY: day-of-year; EUV: extreme ultraviolet; EXCEED: extreme ultraviolet spec-troscope for exospheric dynamics; IPT: Io plasma torus; MHD: magnetohydro-dynamic; NIR: near-infrared spectral region; SW: solar wind.
Authors’ contributions
IY supervised the data analysis and discussion, FS was involved in data han-dling and figure production, RH was involved in data selection and hanhan-dling, figure production, KY checked the accuracy of data analysis, GM was involved in data acquisition, FT checked the accuracy of data, CT predicted the solar wind parameters using the MHD model, AY was involved in data acquisition, and TK, HK, HN and MF contributed to the discussion. All authors read and approved the final manuscript.
Authors’ information
IY (professor at the university) is the principal investigator of EXCEED on the Hisaki spacecraft. He has led mission planning and development and is responsible for the production of scientific output. FS and RH are gradu-ate students supervised by IY; KY (assistant professor at the university), GM (research scientist at the institute), FT (assistant professor at the university), and AY (assistant professor at the institute) have been core members of the project from the beginning and have contributed to instrumental development and mission planning. TK (research scientist at the institute), HK (research scientist at the university), HN (associate professor at the institute), and MF (professor at the institute) are scientists specialized in the Jovian magnetosphere. CT (research scientist at National Institute of Information and Communications Technology) is a specialist in predicting SW parameters.
Author details
1 University of Tokyo, 5-1-5 Kashiwanoha, Kashiwa 277-8561, Chiba, Japan. 2 Japan Aerospace Exploration Agency, 3-1-1 Yoshinodai, Chuou, Sagami-hara 252-5210, Kanagawa, Japan. 3 Tohoku University, 6-3 Aoba, Aramaki, Aoba, Sendai 980-8578, Miyagi, Japan. 4 National Institute of Information and Communications Technology, 4-2-1 Nukuikitamachi, Koganei 184-8795, Tokyo, Japan. 5 RIKEN, 2-1 Hirosawa, Wako, Saitama, Japan. 6 National Institute of Technology, Kagoshima College, 1460-1 Shinkou, Hayatocho, Kirishima 899-5193, Kagoshima, Japan.
Acknowledgements
The data from the Hisaki satellite are archived in Data Archives and Transmis-sion System (DARTS) built by Institute of Space and Astronautical Science (ISAS)/Japan Aerospace Exploration Agency (JAXA). The authors wish to thank Dr. S. Sawai, Dr. S. Fukuda, Dr. K. Nakaya, Dr. S. Sakai, and all group members who contributed to the Hisaki project. This work was done in the frame of the International Team collaboration number 388 supported by the International Space Science Institute in Bern, Switzerland. This work was supported by a Grant-in-Aid for Scientific Research (JP17915282) from the Japan Society for the Promotion of Science.
Competing interests
The authors declare that they have no competing interests.
Publisher’s Note
Springer Nature remains neutral with regard to jurisdictional claims in pub-lished maps and institutional affiliations.
Received: 6 January 2017 Accepted: 2 August 2017
References
Badman SV, Bonfond B, Fujimoto M, Gray RL, Kasaba Y, Kasahara S, Kimura T, Melin H, Nichols JD, Steffl AJ, Tao C, Tsuchiya F, Yamazaki A, Yoneda M, Yoshikawa I, Yoshioka K (2016) Weakening of Jupiter’s main auroral emis-sion during January 2014. Geophys Res Lett 43:988–997. doi:10.1002/20 15GL067366
Barbosa DD, Coroniti FV, Kurth WS, Scarf FS (1985) Voyager observations of lower hybrid noise in the Io plasma torus and anomalous plasma heating rates. Astrophys J 289:392–408. doi:10.1086/162899
Broadfoot AL, Belton MJ, Takacs PZ, Sandel BR, Shemansky DE, Holberg JB, Ajello JM, Moos HW, Atreya SK, Donahue TM, Bertaux JL, Blamont JE, Stro-bel DF, McConnell JC, Goody R, Dalgarno A, McElroy MB (1979) Extreme ultraviolet observations from Voyager 1 encounter with Jupiter. Science 204:979–982. doi:10.1126/science.204.4396.979
Cap FF (1976) Interchange instabilities. Handbook on plasma instabilities, vol 1. Academic Press, New York, pp 274–275
de Kleer K, de Pater I (2016a) Time variability of Io’s volcanic activity from near-IR adaptive optics observations on 100 nights in 2013–2015. Icarus 280:378–404. doi:10.1016/j.icarus.2016.06.019
de Kleer K, de Pater I (2016b) Spatial distribution of Io’s volcanic activity from near-IR adaptive optics observations on 100 nights in 2013–2015. Icarus 280:405–414. doi:10.1016/j.icarus.2016.06.018
Delamere PA, Bagenal F (2003) Modeling variability of plasma conditions in the Io torus. J Geophys Res. doi:10.1029/2002JA009706
Delamere PA, Bagenal F, Steffl AJ (2005) Radial variations in the Io plasma torus during the Cassini era. J Geophys Res. doi:10.1029/2005JA011251
Kimura T, Badman SV, Tao C, Yoshioka K, Murakami G, Yamazaki A, Tsuchiya F, Bonfond B, Steffl AJ, Masters A, Kasahara S, Hasegawa H, Yoshikawa I, Fujimoto M, Clarke JT (2015) Transient internally-driven aurora at Jupiter discovered by Hisaki and the Hubble Space Telescope. Geophys Res Lett 42:1662–1668. doi:10.1002/2015GL063272
Kita H, Kimura T, Tao C, Tsuchiya F, Misawa H, Sakanoi T, Kasaba Y, Murakami G, Yoshioka K, Yamazaki A, Yoshikawa I, Fujimoto M (2016) Characteristics of solar wind control on Jovian UV auroral activity deciphered by long-term Hisaki EXCEED observations: evidence of preconditioning of the magne-tosphere? Geophys Res Lett 43:6790–6798. doi:10.1002/2016GL069481
Kivelson MG, Russell CT (1995) Introduction to space physics. Cambridge University Press, Cambridge
Masunaga K, Seki K, Terada N, Tsuchiya F, Kimura T, Yoshioka K, Murakami G, Yamazaki A, Kagitani M, Tao C, Fedorov A, Futaana Y, Zhang TL, Shiota D, Leblanc F, Chaufray JY, Yoshikawa I (2015) Periodic variations of oxygen EUV dayglow in the upper atmosphere of Venus: Hisaki/EXCEED observa-tions. J Geophys Res: Planets. doi:10.1002/2015JE004849
Mauk BH, Clarke JT, Grodent D, Waite JH, Paranicas CP, Williams DJ (2002) Transient aurora on Jupiter from injections of magnetospheric electrons. Nature 415:1003–1005. doi:10.1038/4151003a
Murakami G, Yoshioka K, Yamazaki A, Tsuchiya F, Kimura T, Tao C, Kita H, Kagitani M, Sakanoi T, Uemizu K, Kasaba Y, Yoshikawa I, Fujimoto M (2016) Response of Jupiter’s inner magnetosphere to the solar wind derived from extreme ultraviolet monitoring of the Io plasma torus. Geophys Res Lett. doi:10.1002/2016GL071675
Shemansky DE (1980) Radiative cooling efficiencies and predicted spec-tra of species of the Io plasma torus. Astrophys J 236:1043–1054. doi:10.1086/157832
Shemansky DE (1988) Energy branching in the Io plasma torus: the failure of neutral cloud theory. J Geophys Res 93:1773–1784. doi:10.1029/ JA093iA03p01773
Steffl AJ, Bagenal F, Ian A, Stewart F (2004) Cassini UVIS observations of the Io plasma torus: II. Radial variations. Icarus 172:91–103. doi:10.1016/j. icarus.2004.04.016
Steffl AJ, Delamere PA, Bagenal F (2006) Cassini UVIS observations of the Io plasma torus. III. Observations of temporal and azimuthal variability. Icarus 180:124–140. doi:10.1016/j.icarus.2005.07.013
Tao C, Kataoka R, Fukunishi H, Takahashi Y, Yokoyama T (2005) Magnetic field variations in the Jovian magnetotail induced by solar wind dynamic pressure enhancements. J Geophys Res 110:A11208. doi:10.1029/200 4JA010959
Thorne RM, Armstrong TP, Stone S, Williams DJ, McEntire RW, Bolton SJ, Gurnett DA, Kivelson MG (1997) Galileo evidence for rapid interchange transport in the Io torus. Geophys Res Lett 24:2131–2134. doi:10.1029/97GL01788
Tsuchiya F, Kagitani M, Yoshioka K, Kimura T, Murakami G, Yamazaki A, Nozawa H, Kasaba Y, Sakanoi T, Uemizu K, Yoshikawa I (2015) Local electron heating in the Io plasma torus associated with Io from HISAKI satellite observation. J Geophys Res 120:10317–10333. doi:10.1002/2015JA021420
Yamazaki A, Tsuchiya F, Sakanoi T, Uemizu K, Yoshioka K, Murakami G, Kagitani M, Kasaba Y, Yoshikawa I, Terada N, Kimura T, Sakai S, Nakaya K, Fukuda S, Sawai S (2014) Field-of-view guiding camera on the HISAKI (SPRINT-A) satellite. Space Sci Rev 184:259–274. doi:10.1007/s11214-014-0106-y
Yang YS, Wolf RA, Spirp RW, Hill TW, Dessler AJ (1994) Numerical simulation of torus-driven plasma transport in the Jovian magnetosphere. J Geophys Res 99:8755–8770. doi:10.1029/94JA00142
Yoshikawa I, Yoshioka K, Murakami G, Yamazaki A, Tsuchiya F, Kagitani M, Saka-noi T, Terada N, Kimura T, Kuwabara M, Fujiwara K, Hamaguchi T, Tadokoro
T (2014) Extreme ultraviolet radiation measurement for planetary atmos-pheres/magnetospheres from the Earth-orbiting spacecraft (extreme ultraviolet spectroscope for exospheric dynamics: EXCEED). Space Sci Rev 184:237–258. doi:10.1007/s11214-014-0077-z
Yoshikawa I, Yoshioka K, Murakami G, Suzuki F, Reina H, Yamazaki A, Kimura T, Tsuchiya F, Kagitani M, Sakanoi T, Uemizu K, Tao C, Nozawa H, Kasaba Y, Fujimoto M (2016) Properties of hot electrons in the Jovian inner-mag-netosphere deduced from extended observations of the Io plasma torus. Geophys Res Lett. doi:10.1002/2016GL070706
Yoshioka K, Yoshikawa I, Tsuchiya F, Kagitani M, Murakami G (2011) Hot elec-tron component in the Io plasma torus confirmed through EUV spectral analysis. J Geophys Res 116:A09204. doi:10.1029/2011JA016583