R E S E A R C H
Open Access
A novel method for the detection of
R-peaks in ECG based on K-Nearest Neighbors
and Particle Swarm Optimization
Runnan He
1, Kuanquan Wang
1, Qince Li
1, Yongfeng Yuan
1, Na Zhao
1, Yang Liu
1and Henggui Zhang
1,2,3*Abstract
Cardiovascular diseases are associated with high morbidity and mortality. However, it is still a challenge to diagnose them accurately and efficiently. Electrocardiogram (ECG), a bioelectrical signal of the heart, provides crucial
information about the dynamical functions of the heart, playing an important role in cardiac diagnosis. As the QRS complex in ECG is associated with ventricular depolarization, therefore, accurate QRS detection is vital for interpreting ECG features. In this paper, we proposed a real-time, accurate, and effective algorithm for QRS detection. In the algorithm, a proposed preprocessor with a band-pass filter was first applied to remove baseline wander and
power-line interference from the signal. After denoising, a method combining K-Nearest Neighbor (KNN) and Particle Swarm Optimization (PSO) was used for accurate QRS detection in ECGs with different morphologies. The proposed algorithm was tested and validated using 48 ECG records from MIT-BIH arrhythmia database (MITDB), achieved a high averaged detection accuracy, sensitivity and positive predictivity of 99.43, 99.69, and 99.72%, respectively, indicating a notable improvement to extant algorithms as reported in literatures.
Keywords: Electrocardiogram, QRS detection, K-Nearest Neighbor, Particle Swarm Optimization
1 Introduction
The electrocardiogram (ECG) is one of the major phys-iological signals generated by the heart. It is the graph-ical representation of the electrgraph-ical activity in the heart, providing valuable information for diagnosing cardiac diseases [1, 2]. In the normal condition, the pattern of cardiac electrical propagation is not random, but spreads over the heart in a coordinated manner, resulting in an ordered and measurable change in the spatio-temporal distribution of the body surface potentials, which is reflected by recorded ECGs. A typical ECG tracing is char-acterized by a recurrent sequence of waves including P, QRS and T waves, corresponding to the depolarization of the atria, ventricles and repolarization of the ventricles respectively. P wave represents the electrical signal mark-ing the initiation of the heartbeat, atrial depolarization
*Correspondence: henggui.zhang@manchester.ac.uk
1School of Computer Science and Technology, Harbin Institute of Technology (HIT), 150001 Harbin, China
2School of Physics and Astronomy, The University of Manchester, M13 9PL, Manchester, UK
Full list of author information is available at the end of the article
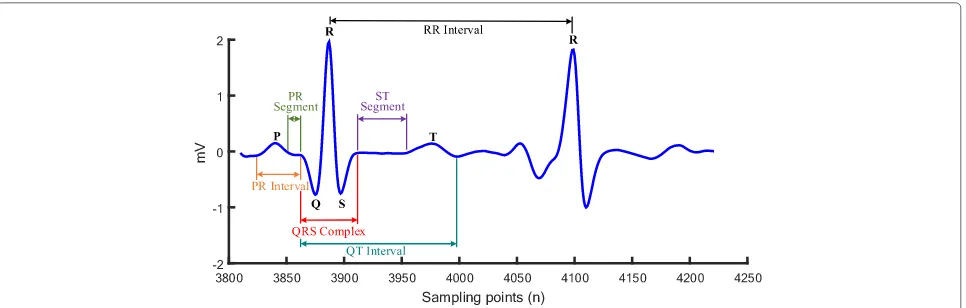
that spreads from the sinoatrial node (SAN) towards the atria and the atrioventricular node (AVN) with 0.08-0.11s duration. The QRS complex reflects the combination of three graphical deflections seen on a typical electrocar-diogram that marks the depolarization of the ventricles. It is usually the central and most visually obvious part of the ECG trace because of the larger size of ventricles. It corresponds to the depolarization of the right and left ven-tricles of the human heart with 0.06–0.10 s duration. The Q, R, and S waves occur in rapid succession, do not all appear in all leads, and reflect a single event, and thus are usually considered together. T wave represents the repo-larization (or recovery) of the ventricles with a duration of 0.05–0.25 s. Figure 1 shows a typical ECG signal segment from MIT-BIH arrhythmia database (ECG 100 recording). The QRS complex is known as the reference waveform for analysis of ECG signals, accurate and reliable detec-tion of which affects the performance of an automatic ECG analyzing algorithm based on heart rate variability (variation in RR intervals) for diagnosing cardiac diseases [3, 4]. In order to detect the QRS complex more accurately, it is vital to identify the exact R-peak locations from the
Fig. 1A typical cardiac cycle (heartbeat) from MIT-BIH arrhythmia database (ECG 100 recording)
recorded ECG data. Furthermore, accurate delineation of other ECG waves also depends on this. When the location of QRS complex is detected, then other ECG signal com-ponents such as P and T waves may be determined by their relative position to QRS complex [5, 6]. However, in prac-tice, ECG records are often corrupted by various types of artefacts and noises [7, 8]. Hence, the de-noising and enhancement of ECG signals are perquisites for accurate ECG analysis.
In general, most of the QRS detection algorithm in the past few years consist of two components: the signal processing and decision stages [9]. So far, variant meth-ods for ECG de-noising and R-wave detection have been proposed, including approaches of derivatives [10, 11], digital filters [12–15], wavelet transform(WT) [1, 16–26], artificial neural network (ANN) [27, 28], support vector machine (SVM) [29], k-means [30], empirical mode decomposition (EMD) [31], geometrical matching [32–34], combined threshold method [35, 36], phase space method [37], Hilbert Transform method [38], and mixed approach [39, 40]. Almost all of the methods listed above have some limitations. For most of the existing derivative and digital filter algorithms, QRS complex was deter-mined with an assumption on that ECG signals were free of noise and other waves were eliminated, which were ideal for automatic ECG analysis [11]. In general, in the preprocessing stage, most of the above methods imple-ment different signal processing techniques to strengthen the QRS complex and weaken noises. But the methods applied have some shortcomings resulting from the deci-sion between missing or false detections which depends on the choice of filter bandwidth and moving-window size
[12]. The WT method has a problem in the selection of mother wavelet and scales to obtain QRS events, which different scales may determine how much QRS complex energies will be reserved [16]. In wavelet analysis, vari-ant mother wavelets can be used. Generally, a mother wavelet is a function with characteristics of orthogonality, compact support, and symmetry. As more than one mother wavelet with the same properties often exist for the same signal, different analysis results may be obtained by using different mother wavelets. To overcome this, the similarity between signal and mother wavelet are consid-ered in selecting a mother wavelet. For the choice problem of the basis function, EMD-based approach can be bet-ter than WT, but the selection of intrinsic mode functions (IMFs) is sensitive to noise, which requires the design of more effective filtering and selection of threshold [31]. The use of ANN and SVM require the training of spe-cific model and adjustment of parameters, which needs massive complicated calculations. Hence, it is difficult to effectively address the balance between QRS enhance-ment and noise reduction in practice [27–29].
In previous studies, the squaring transformation has been widely used, but it considerably diminishes the mag-nitude of the candidate R-peaks of various QRS complexes [11]. The Hamilton–Tompkins algorithm proposed by Tompkins in 1986 is one of the most typical QRS detec-tion algorithms and is widely used because of its high accuracy and capability in real-time detection [13]. Later, this algorithm has been improved by adding an automatic adjustment of the primary threshold in order to avoid sub-jective selection of threshold coefficients, which is called as Tompkins Modified Method II [11]. The performance
a
b
Fig. 3Two typical characteristics of ECG signals.aGeneral change tendency of QRS complex which the overall waveform is small or large in succession.bThe change tendency of individual which will appear similar amplitude QRS complex locally
of the modified method has shown better detection per-formance, but it is not sensitive to the change of the integral information of QRS, leading to mistakes in the cases of low-amplitude QRS, sudden change of amplitude and high P and T waves. Other methods based on cluster such as K-means have a similar problem and cost enor-mous computation time because of the need of calculation over the whole sample set, which makes it unrealistic for the real-time detection [30].
In this paper, based on detailed analysis of beat features in ECG, we proposed a simple and novel method with high average accuracy to detect QRS in ECGs with atypically shaped QRS complexes and noises. The method is based on a simple peak-finding logic using the K-Nearest Neigh-bor (KNN) and Particle Swarm Optimization (PSO). The rest of this paper is organized as follows. In Section 2, the method of four-stage R-peak detection is described in details. In Section 3, the proposed method is evaluated using the MIT-BIH arrhythmia database. Finally, Section 4 concludes our study.
2 Method
The flowchart diagram of the proposed R-peak detection method is shown in Fig. 2. It contains four stages which are digital filtering, enhancement of QRS complex, KNN peak-finding, and PSO parameter selection. In general, in the first stage of the proposed algorithm a bandpass fil-ter was used to remove the noise in ECG signals. In the second stage, a five-point first-order differentiation, abso-lute and the backward cumulation operation were used to emphasize the QRS complex. This stage plays the most critical role in the proposed algorithm. In the third stage, the proposed peak-finding technique based on the KNN was implemented to identify accurate locations of the local maxima. Finally, PSO was applied to deal with the parameter selection, which maximizes the accuracy rate
of R-peaks. Detailed description of each stage in Fig. 2 are presented in the following subsections.
2.1 MIT-BIH arrhythmia database
The annotated ECG records from the MIT-BIH arrhyth-mia database consists of 48 records, which are used for QRS detection in this study [41]. Including a modified limb lead II and one of the modified chest leads V1, V2, V3, V4, V5, or V6, each record has a 30-min duration and is sampled at 360 Hz (Fs = 360 Hz). The ECG records present a variety of waveforms such as artifacts, complex ventricular, junctional and supraventricular arrhythmias and conduction abnormalities. Each ECG trace is accom-panied by an annotation file in which the category of each ECG beat has been identified by expert cardiolo-gists. These labels, referred to as “truth” annotation in this paper, are used to evaluate the performance of our method.
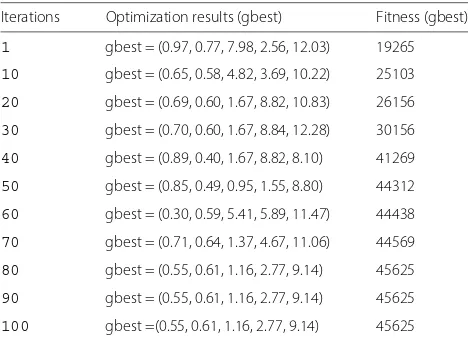
Table 1The iteration result of PSO for the training data
Iterations Optimization results (gbest) Fitness (gbest)
1 gbest = (0.97, 0.77, 7.98, 2.56, 12.03) 19265
10 gbest = (0.65, 0.58, 4.82, 3.69, 10.22) 25103
20 gbest = (0.69, 0.60, 1.67, 8.82, 10.83) 26156
30 gbest = (0.70, 0.60, 1.67, 8.84, 12.28) 30156
40 gbest = (0.89, 0.40, 1.67, 8.82, 8.10) 41269
50 gbest = (0.85, 0.49, 0.95, 1.55, 8.80) 44312
60 gbest = (0.30, 0.59, 5.41, 5.89, 11.47) 44438
70 gbest = (0.71, 0.64, 1.37, 4.67, 11.06) 44569
80 gbest = (0.55, 0.61, 1.16, 2.77, 9.14) 45625
90 gbest = (0.55, 0.61, 1.16, 2.77, 9.14) 45625
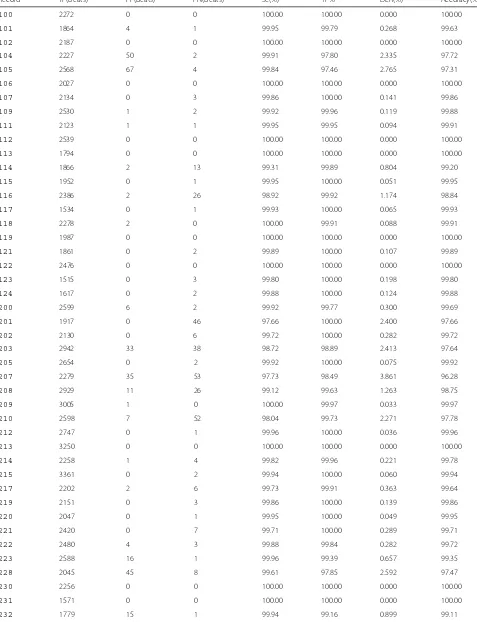
Table 2Performance evaluation of the proposed R-wave detection method with the MIT-BIH arrhythmia database
Record TP(beats) FP(beats) FN(beats) Se(%) +P% DER(%) Accuracy(%)
100 2272 0 0 100.00 100.00 0.000 100.00
101 1864 4 1 99.95 99.79 0.268 99.63
102 2187 0 0 100.00 100.00 0.000 100.00
104 2227 50 2 99.91 97.80 2.335 97.72
105 2568 67 4 99.84 97.46 2.765 97.31
106 2027 0 0 100.00 100.00 0.000 100.00
107 2134 0 3 99.86 100.00 0.141 99.86
109 2530 1 2 99.92 99.96 0.119 99.88
111 2123 1 1 99.95 99.95 0.094 99.91
112 2539 0 0 100.00 100.00 0.000 100.00
113 1794 0 0 100.00 100.00 0.000 100.00
114 1866 2 13 99.31 99.89 0.804 99.20
115 1952 0 1 99.95 100.00 0.051 99.95
116 2386 2 26 98.92 99.92 1.174 98.84
117 1534 0 1 99.93 100.00 0.065 99.93
118 2278 2 0 100.00 99.91 0.088 99.91
119 1987 0 0 100.00 100.00 0.000 100.00
121 1861 0 2 99.89 100.00 0.107 99.89
122 2476 0 0 100.00 100.00 0.000 100.00
123 1515 0 3 99.80 100.00 0.198 99.80
124 1617 0 2 99.88 100.00 0.124 99.88
200 2599 6 2 99.92 99.77 0.300 99.69
201 1917 0 46 97.66 100.00 2.400 97.66
202 2130 0 6 99.72 100.00 0.282 99.72
203 2942 33 38 98.72 98.89 2.413 97.64
205 2654 0 2 99.92 100.00 0.075 99.92
207 2279 35 53 97.73 98.49 3.861 96.28
208 2929 11 26 99.12 99.63 1.263 98.75
209 3005 1 0 100.00 99.97 0.033 99.97
210 2598 7 52 98.04 99.73 2.271 97.78
212 2747 0 1 99.96 100.00 0.036 99.96
213 3250 0 0 100.00 100.00 0.000 100.00
214 2258 1 4 99.82 99.96 0.221 99.78
215 3361 0 2 99.94 100.00 0.060 99.94
217 2202 2 6 99.73 99.91 0.363 99.64
219 2151 0 3 99.86 100.00 0.139 99.86
220 2047 0 1 99.95 100.00 0.049 99.95
221 2420 0 7 99.71 100.00 0.289 99.71
222 2480 4 3 99.88 99.84 0.282 99.72
223 2588 16 1 99.96 99.39 0.657 99.35
228 2045 45 8 99.61 97.85 2.592 97.47
230 2256 0 0 100.00 100.00 0.000 100.00
231 1571 0 0 100.00 100.00 0.000 100.00
Table 2Performance evaluation of the proposed R-wave detection method with the MIT-BIH arrhythmia database (Continued)
Record TP(beats) FP(beats) FN(beats) Se(%) +P% DER(%) Accuracy(%)
233 3073 0 6 99.81 100.00 0.195 99.80
234 2752 0 1 99.96 100.00 0.036 99.96
Overall 107,851 305 333 99.69 99.72 0.579 99.43
2.2 Suppression of noise and enhancement of QRS complex
In the realistic environments, ECG signals may be cor-rupted by various kinds of noises, including power line interference, electrode contact noise, motion artifacts, muscle contraction, and baseline drift. On the other hand, large P and T waves may also disturb the QRS detection. In order to reduce noise, the filtering stage is constructed using bandpass filter (10–45 Hz) which accentuates the QRS complex and reduces noise since the frequency domain of available ECG signal is about 10-25 Hz [42]. Then, the filtered signal, f[n] (n denotes sampling points), is differentiated using five-point first-order dif-ferentiation to provide information about the slope of the QRS complexes and reduce the influence of the P and T waves [43]. The equation for five-point first-order derivative of the filtered ECG is listed as follows:
d[n]= 182f[n]+f[n−1]−f [n−3]−2f[n−4] (n≥5)
(1)
where d[n] represents the differentiation signal. The five point first order differentiation is applied to enhance the QRS complex which provides the QRS complex slope information because of the higher amplitude of QRS com-plex in ECG signals.
The output of the differentiator is a bipolar signal and thus a rectification is applied for the detection of negative R-peaks by simply using absolute value as shown in Eq. (2).
Abs(d[n])= |d[n]| (2)
The process of the absolute value can make all the R-peaks positive which deals with the detection of the inverted (negative) R-peaks. In order to further highlight the QRS region, the backward cumulation ofAbs(d[n]) is calculated within a window width (Ww) containing 60 sampling points as shown in Eq. (3).
Bc(n)=
n+Ww−1
i=n
Abs(d[i]) (3)
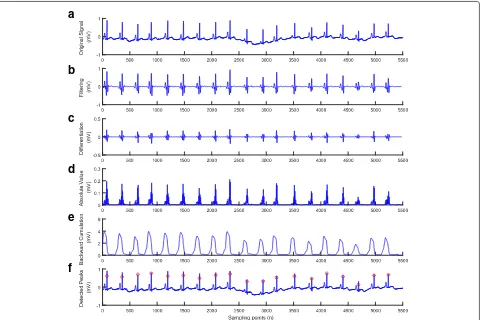
The use of the backward cumulation obtain waveform feature information in addition to the slope of the R-peaks. The backward cumulation window width we selected to use is about 160 ms (because the ECG signal sampling rate is 360 Hz), which is approximately the same width as the widest possible QRS complex to ensure only one QRS complex in each window. For the last 60 sampling points of a ECG signal series, as all of the QRS complex are covered in every window, so we need not to enhance the signal with the backward cumulation algorithm. Results after all the processes are shown in Figs. 4, 5, 6, 7, 8, 9, and 10.
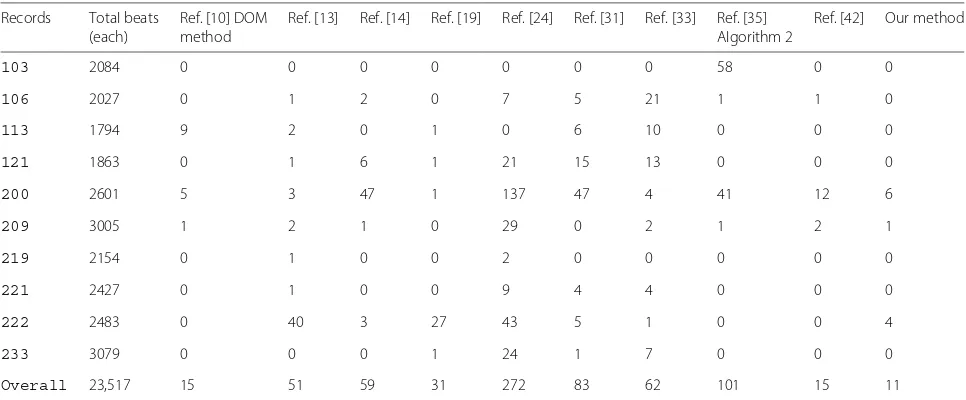
Table 3Numbers of false-positives (FPs) comparison for specific records
Records Total beats Ref. [10] DOM Ref. [13] Ref. [14] Ref. [19] Ref. [24] Ref. [31] Ref. [33] Ref. [35] Ref. [42] Our method
(each) method Algorithm 2
103 2084 0 0 0 0 0 0 0 58 0 0
106 2027 0 1 2 0 7 5 21 1 1 0
113 1794 9 2 0 1 0 6 10 0 0 0
121 1863 0 1 6 1 21 15 13 0 0 0
200 2601 5 3 47 1 137 47 4 41 12 6
209 3005 1 2 1 0 29 0 2 1 2 1
219 2154 0 1 0 0 2 0 0 0 0 0
221 2427 0 1 0 0 9 4 4 0 0 0
222 2483 0 40 3 27 43 5 1 0 0 4
233 3079 0 0 0 1 24 1 7 0 0 0
Table 4Numbers of false-negatives (FNs) comparison for specific records
Records Total beats Ref. [10] DOM Ref. [13] Ref. [14] Ref. [19] Ref. [24] Ref. [31] Ref. [33] Ref. [35] Ref. [42] Our method
(each) method Algorithm 2
K-Nearest Neighbors algorithm (KNN) is a non-parametric method used for classification and regression. It is a type of instance-based learning or lazy learning, where the function is only approximated locally and all computation is deferred until classification [44]. The algorithm output is a class membership. An object is classified by a majority vote of its neighbors, with the object being assigned to the class most common among itsk nearest neighbors (k is a positive integer, typically small). Ifk= 1, then the object is simply assigned to the class of that single nearest neighbor.
After the noise suppression and enhancement of QRS complex, positive peaks regardless of polarity of QRS complexes can be obtained. The main goal of the next step is to identify R-peaks by implementing the KNN-based peak-finding algorithm, which relies on the use of single-sided threshold [45]. However, it is a challenge to determine such a threshold. After careful evaluation of a large amount of the ECG signals, two classes of QRS characteristics were identified as shown in Fig. 3, which may form a basis for determining the threshold. As it was shown in Fig. 3, in Fig. 3a, the general features of QRS complex is temporally consistent, presenting as a contin-uous period of QRS with large or small R-amplitude. It means the closer the ECG signal is to the current detec-tion posidetec-tion, the higher similarity to the next unknown R-peak (calculated by the Eq. (4)). However, in Fig. 3b, the features of the individual QRS complex alternates, with every one or two low-amplitude QRS complex followed by two high-amplitude QRS complex. It means the minimum amplitude R-peak in the detected R-peaks before, which will have the greatest influence on the next unknown adaptive threshold (calculated by the Eq. (5)).
The core idea of KNN algorithm is to find k sam-ples most similar to the unknown sample among the existed samples, which is used for classifying the unknown sample. In this study, the detected K R-peaks were used as samples, which are used to determine an adaptive thresh-old for detecting the next R-peak. Thus, there are two factors that affect KNN algorithm: (1) how to measure the similarity among samples, which affects the precision of computation; (2) how to find the most similar sam-ples fast, which affects the efficiency of execution. In our study, applying KNN algorithm to the detection of QRS complex, we should predict the threshold of next QRS complex through detected QRS complex. However, the features cannot be extracted from the unknown threshold, so we convert another thought to conduct the computa-tion of similarity and the seleccomputa-tion of nearest neighbor according to the two characteristics of QRS complex men-tioned above. We regard n detected QRS complex as the reference set of nearest neighbor, calculate the difference of every QRS peak value and the minimum value and the last QRS peak time and every peak time, which is accompanied by the proportionality coefficient and Euler
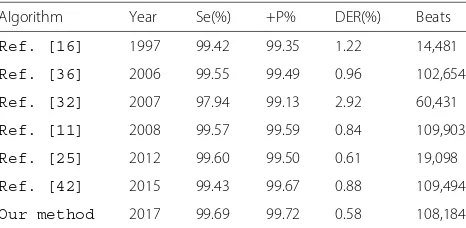
Table 5Comparison of R-peak detection with other algorithms
Algorithm Year Se(%) +P% DER(%) Beats
Ref. [16] 1997 99.42 99.35 1.22 14,481
Ref. [36] 2006 99.55 99.49 0.96 102,654
Ref. [32] 2007 97.94 99.13 2.92 60,431
Ref. [11] 2008 99.57 99.59 0.84 109,903
Ref. [25] 2012 99.60 99.50 0.61 19,098
Ref. [42] 2015 99.43 99.67 0.88 109,494
a
b
c
d
e
f
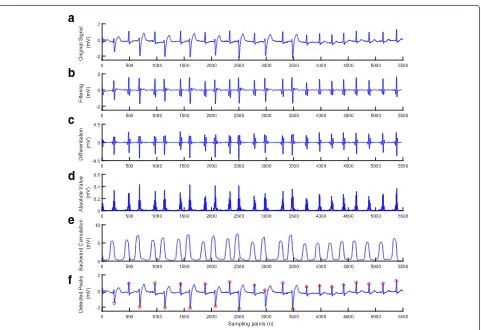
Fig. 4Result after performing each stage of the proposed method for the ECG with high frequency noise and artifact (ECG recording 200).
a) Original signal.b) Filtering.c) Differentiation.d) Absolute value.e) Backward cumulation.f) Detected peaks
distance as the final similarity vector. Finally, we select K elements according to the similarity obtained above to calculate the next detection threshold of QRS complex. Thus, we proposed KNN algorithm based on time dis-tance and amplitude to dynamically generate threshold base value (Thresbasis) by the two characteristics of QRS complex mentioned above. There are several formulas as the followings:
Vectortime(i)=
RpeakIndex(end)−RpeakIndex(i)
Fs (4)
Vectoramplitude(i)=Rpeak(i)−min(Rpeak) (5)
Eular distance(i)=
(α1·Vectortime(i))2+α2·Vectoramplitude(i)2
(6)
Weight(i)=α·e−
Eular distance(i)2
θ2 (7)
Thresbasis=
k
i=1weight(i)·Rpeak(i)
k
i=1weight(i)
(8)
Threshold=Thresfrac·Thresbasis (9)
a
b
c
d
e
f
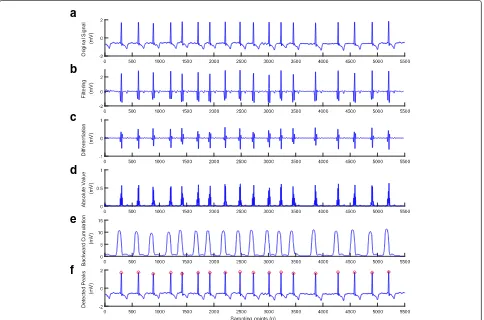
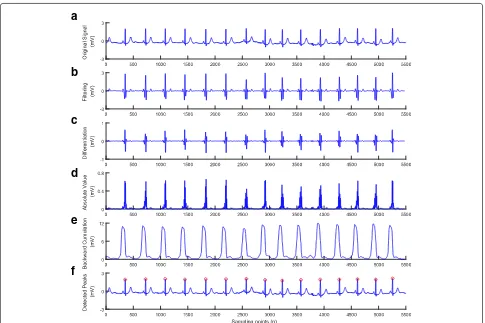
Fig. 5Result after performing each stage of the proposed method for the ECG with baseline wander and sudden changes (ECG recording 219).
a) Original signal.b) Filtering.c) Differentiation.d) Absolute value.e) Backward cumulation.f) Detected peaks
experiences. Thresbasis is the threshold base value and Threshold is the final adaptive threshold multiplied by Thresfrac.
After threshold selection, R peaks are identified as the peaks larger than the threshold. Normally, if the RR inter-val is 1.5 times larger than average RR, we think a missing R-peak appear because of the low amplitude R-peaks, so the secondary threshold is regarded as lower threshold than the threshold calculated for the first time to detect all the peaks, which is applied to detect the missing R-peaks. Finally, we set a refractory period within a 200-ms window. In the refractory period, once a peak is detected, the largest amplitude in the vicinity of each identified peak is removed.
2.4 Particle swarm optimization-based parameter selection
The proposed KNN approach above contains multiple parameters. In order to obtain the best detection results, it is unpractical to adjust the parameters only relying on the traditional experience and observation of ECG wave-forms. Thus, we used the automatic optimization choice of parameters by applying PSO.
PSO originally developed by Kennedy et al. is a com-putational method that optimizes a problem by iteratively improving a candidate solution with regard to a given measure of quality [46, 47]. This method uses a popu-lation of candidate solutions, here referred as particles, and moves these particles around in the search-space according to simple mathematical formula of the particle’s position and velocity. Each particle’s movement is influ-enced by its local best known position and is also guided toward the best-known positions in the search-space. The position of the particle will be updated as better posi-tions are found, which is expected to move the swarm toward the best solutions. The core equations are as followings,
vij(t+1)=w·vij(t)
+c1·rand1·
pbestij(t)−pij(t)
+c2·rand2·
gbestj(t)−pij(t)
(10)
pij(t+1)=pij(t)+β·vij(t+1) (11)
where t represents the number of iterations, vij ∈
a
b
c
d
e
f
Fig. 6Results after performing each stage of the method for the ECG with numerous long time cardiac arrest in duration (ECG recording 232).a) Original signal.b) Filtering.c) Differentiation.d) Absolute value.e) Backward cumulation.f) Detected peaks
particle i on the dimension of j, pbestij represents the best value of the particlei on the dimension ofj.gbestj represents the best value of the global particles on the dimension ofj.wandβrepresent the adjustment weight of the particle movement speed and the rate of change, respectively.C1andC2represent the weight which con-trol the local and global solution. In our study, we defined a fitness function as Eq. (12),
Fitness Function=TP−FP−FN (12)
where TP, FP, and FN represent the true positives (TP), false positives (FP) and false negatives (FN) respectively. Finally, we apply PSO to automatically choose the opti-mization parameters (Thresfrac,Thresfrac2,α1,α2,α) to achieve the maximum value of fitness function.
In this paper, we use particle swarm optimization to choose the optimization parameters. We select the 100-124 ECG recordings as the training data (the sum of the R-peak beats is 45,882) to ensure the five optimal param-eters and test all the ECG recordings, which achieved a better result than others. In our study, we have set some
initial parameters. The number of particles is 50, The iter-ations are 100. The PSO updated parametersc1,c1andβ are 0.5, 0.5 and 1. The five parameters generated during the iterative process of the algorithm are shown in Table 1. Not difficult to find, gbest and fitness(gbest) tend to be stable after 40 iterations, the values of the five optimiza-tion parameters and the detected R-peaks are 0.55, 0.61, 1.16, 2.77, 9.14, and 45,625.
3 Results and discussions
a
b
c
d
e
f
Fig. 7Results after performing each stage of the method for the ECG with tall P waves (ECG recording 222).a) Original signal.b) Filtering.c) Differentiation.d) Absolute value.e) Backward cumulation.f) Detected peaks
and the positive predictivity (+P) and the detection error rate (DER) were calculated using the following equations, respectively
Se = TP
TP+FN ×100% (13)
+P = TP
TP+FP ×100% (14)
DER = FP+FN
TP ×100% (15)
The overall performance of the method is calculated by the detection accuracy which is defined as follows
Accuracy=TP/ (TP+FP+FN)×100% (16)
The performance evaluation of the proposed method for 47 ECG recordings (except 108 recording) of the MIT-BIH arrhythmia database are summarized in Table 2. For the total of 107,851 beats, the proposed method produced an averaged 99.43% accuracy, with 638 false detections that included 333 false-negative (FN) and 305 false-positive (FP) beats. On the basis of the character-istics of ECG signals of normal, abnormal and different
noise levels, the detection precision varied from 96.28 to 100% as shown in Table 2.
a
b
c
d
e
f
Fig. 8Results after performing each stage of the method for the ECG with tall T waves (ECG recording 106).a) Original signal.b) Filtering.c) Differentiation.d) Absolute value.e) Backward cumulation.f) Detected peaks
and FPs. In this paper, we compare specific records which contain most of various typical arrhythmias in order to prove that our algorithm have ability to detect R-peaks in different ECG recordings with various conditions. The sum of the FPs and FNs (37) are less than other algorithms in Tables 3 and 4. The overall comparison with other algorithms have shown in Table 5.
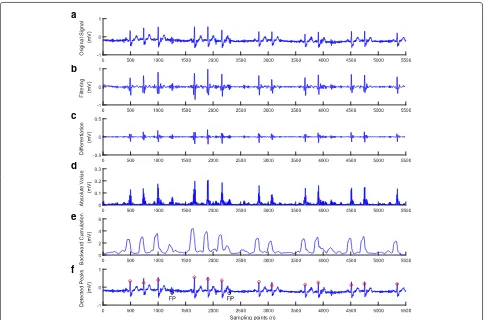
The ECG signal waveforms recorded in different pro-cessing steps are shown in Figs. 4, 5, 6, 7, 8, 9, and 10 showing the performance of the proposed method under various conditions. The TPs are labeled by the red cir-cle compared with the manual annotation, while FPs and FNs are also labeled as black circle. In each figure, (a) to (f ) have shown the whole detection procedure clearly.
For ECG with high frequency noise and artifact, most existing methods produced more missing and false detec-tions. However, the presented method illustrates an excel-lent detection performance as shown in Fig. 4 for ECG recording 200.
The baseline wander and sudden changes are mainly found in record 219 that yields more miss-ing and false detections in most existmiss-ing methods.
The detection performance of the method is shown in Fig. 5.
The numerous long time cardiac arrest in duration are mainly found in record 232 that yields more missing and false detections in most existing methods. The detection performance of the method is shown in Fig. 6.
The tall P waves are mainly found in record 222 that yields more missing and false detections in most existing methods. The detection performance of the method is shown in Fig. 7.
The tall T waves are mainly found in record 106 that yields more false-positive detections in most existing methods. The detection performance of the method is shown in Fig. 8.
The ventricular arrhythmia patterns are mainly found in record 233 that yields more missing and false detections in most existing methods. The detection performance of the method is shown in Fig. 9.
a
b
c
d
e
f
Fig. 9Result after performing each stage of the method for the ECG with ventricular arrhythmia patterns(ECG recording 233).a) Original signal.b) Filtering.c) Differentiation.d) Absolute value.e) Backward cumulation.f) Detected peaks
Finally, the overall performance of proposed method is compared with some R-peak detection methods. Based on the data shown in Table 5, an average accuracy of 99.43%, a sensitivity of 99.69% and a positive predictivity of 99.72% are obtained for the ECG recordings of the MIT-BIH arrhythmia database, which is significantly better than other detection algorithms. Based on the detection results, we concluded that the simple and effective selec-tion of preprocessing and decision stages can increase the precision rate of detection of R-peaks in ECG recordings with various normal and abnormal waveforms.
Also, as we mentioned about the proposed detec-tion method, we used K-detected R-peaks to pre-dict the next adaptive threshold, so the new detected R-peaks were incorporated to update the threshold. How-ever, it is unclear if the false positively detected R-peaks may introduce uncertainty to the model, which warrants future studies. However, with the specific data sets of the public MIT-BIH database, our results showed that a small number of false positively detected R-peaks had no effect because of the weights of K-detected R-peaks determined to calculate the adaptive threshold.
4 Conclusions
a
b
c
d
e
f
Fig. 10Result after performing each stage of the method for the ECG with sudden changes of QRS complex waveforms and serious baseline wander (ECG recording 103).a) Original signal.b) Filtering.c) Differentiation.d) Absolute value.e) Backward cumulation.f) Detected peaks
The proposed method obtains a high averaged detection accuracy, sensitivity, and positive predictivity of 99.43, 99.69, and 99.72%, respectively. Although the existence of various normal and abnormal QRS complex wave-forms and the influences of different noises in the ECG signals, the proposed method also reaches much higher accuracy rate compared with other existing methods.
Acknowledgements
The work is supported by the National Science Foundation of China (NSFC) under Grant Nos.61572152. (NSFC) under Grant Nos. 61572152, 61571165, and 61601143 (to HZ, KW, and QL), the Science Technology and Innovation Commission of Shenzhen Municipality under Grant Nos.
JSGG20160229125049615 and JCYJ20151029173639477 (to HZ), and China Postdoctoral Science Foundation under Grant Nos. 2015M581448 (to QL).
Authors’ contributions
RH wrote the majority of the text and performed the design and implementation of the algorithm. HZ and QL contributed text to earlier versions of the manuscript and helped with the algorithm. KW and YY commented on and approved the manuscript. NZ and YL initiated the research on the detection of R-peaks. All authors read and approved the final manuscript.
Competing interests
The authors declare that they have no competing interests.
Publisher’s Note
Springer Nature remains neutral with regard to jurisdictional claims in published maps and institutional affiliations.
Author details
1School of Computer Science and Technology, Harbin Institute of Technology
(HIT), 150001 Harbin, China.2School of Physics and Astronomy, The University of Manchester, M13 9PL, Manchester, UK.3Space Institute of Southern China,
518117 Shenzhen, China.
Received: 8 August 2017 Accepted: 29 November 2017
References
1. S Saxena, V Kumar, S Hamde, Feature extraction from ecg signals using wavelet transforms for disease diagnostics. Int. J. Syst. Sci.33, 1073-1085 (2002)
2. ED Übeyli, Implementing wavelet transform/mixture of experts network for analysis of electrocardiogram beats. Expert Syst.25, 150–162 (2008) 3. L Schamroth,An introduction to electrocardiography. (Oxford Blackwell,
1982)
4. H Chan, W Chou, S Chen, S Fang, C Liou, Y-S Hwang, Continuous and online analysis of heart rate variability. J. Med. Eng. Technol.29, 227–234 (2005)
6. F Bereksi-Reguig, S Chouakri, Computerised cardiac arrhythmias detection. Automedica.17, 41–58 (1998)
7. L Gargasas, A Janusauskas, A Lukosevicius, A Vainoras, R Ruseckas, S Korsakas, V Miskinis, Development of methods for monitoring of electrocardiograms, impedance cardiograms and seismocardiograms. Stud. Health Technol. Inform.105, 131–144 (2004)
8. Y Wu, RM Rangayyan, Y Zhou, S-C Ng, Filtering electrocardiographic signals using an unbiased and normalized adaptive noise reduction system. Med. Eng. Phys.31, 17–26 (2009)
9. B-U Köhler, C Hennig, R Orglmeister, The principles of software qrs detection. Eng. Med. Biol. Mag. IEEE.21, 42–57 (2002)
10. Y-C Yeh, W-J Wang, Qrs complexes detection for ecg signal: The difference operation method. Comput. Methods Prog. Biomed.91, 245–254 (2008) 11. NM Arzeno, Z-D Deng, C-S Poon, Analysis of first-derivative based qrs
detection algorithms. IEEE Trans. Biomed. Eng.55, 478–484 (2008) 12. J Pan, WJ Tompkins, A real-time qrs detection algorithm. IEEE Trans.
Biomed. Eng.BME-32(3), 230–236 (1985)
13. PS Hamilton, WJ Tompkins, Quantitative investigation of qrs detection rules using the mit/bih arrhythmia database. IEEE Trans. Biomed. Eng.
BME-33(12), 1157–1165 (1986)
14. M Adnane, Z Jiang, S Choi, Development of qrs detection algorithm designed for wearable cardiorespiratory system. Comput. Methods Programs Biomed.93, 20–31 (2009)
15. D Benitez, P Gaydecki, A Zaidi, A Fitzpatrick, The use of the hilbert transform in ecg signal analysis. Comput. Biol. Med.31, 399–406 (2001) 16. J Sahambi, S Tandon, R Bhatt, Using wavelet transforms for ecg
characterization. An on-line digital signal processing system. Eng. Med. Biol. Mag. IEEE.16, 77–83 (1997)
17. IR Legarreta, P Addison, N Grubb, G Clegg, C Robertson, K Fox, J Watson, R-wave detection using continuous wavelet modulus maxima. Comput. Cardiol.2003, 565–568 (2003)
18. F Abdelliche, A Charef, inELECO 2009. International Conference. R-peak detection using a complex fractional wavelet.in Electrical and Electronics Engineering, 2009 (IEEE, Bursa, 2009), pp. II-267-II-270
19. M Elgendi, M Jonkman, F De Boer. R wave detection using coiflets wavelets. Bioengineering Conference, 2009 IEEE 35th Annual Northeast (IEEE, Boston, 2009), pp. 1–2
20. JP Martínez, R Almeida, S Olmos, AP Rocha, P Laguna, A wavelet-based ecg delineator: Evaluation on standard databases. IEEE Trans. Biomed. Eng.51, 570–581 (2004)
21. A Ghaffari, H Golbayani, M Ghasemi, A new mathematical based qrs detector using continuous wavelet transform. Comput. Electr. Eng.34, 81–91 (2008)
22. A Ghaffari, M Homaeinezhad, M Akraminia, M Atarod, M Daevaeiha, A robust wavelet-based multi-lead electrocardiogram delineation algorithm. Med. Eng. Phys.31, 1219–1227 (2009)
23. R Sunkaria, S Saxena, V Kumar, A Singhal, Wavelet based r-peak detection for heart rate variability studies. J. Med. Eng. Technol.34, 108–115 (2010) 24. S Chouakri, F Bereksi-Reguig, A Taleb-Ahmed, Qrs complex detection
based on multi wavelet packet decomposition. Appl. Math. Comput.217, 9508–9525 (2011)
25. S Banerjee, R Gupta, M Mitra, Delineation of ecg characteristic features using multiresolution wavelet analysis method. Measurement.45, 474–487 (2012)
26. Z Zidelmal, A Amirou, M Adnane, A Belouchrani, Qrs detection based on wavelet coefficients. Comput. Methods Prog. Biomed.107, 490–496 (2012)
27. G Vijaya, V Kumar, H Verma, Artificial neural network based wave complex detection in electrocardiograms. Int. J. Syst. Sci.28, 125–132 (1997) 28. B Abibullaev, HD Seo, A new qrs detection method using wavelets and
artificial neural networks. J. Med. Syst.35, 683–691 (2011) 29. S Mehta, N Lingayat, Svm-based algorithm for recognition of qrs
complexes in electrocardiogram. IRBM.29, 310–317 (2008) 30. S Mehta, D Shete, N Lingayat, V Chouhan, K-means algorithm for the
detection and delineation of qrs-complexes in electrocardiogram. Irbm.
31, 48–54 (2010)
31. X Hongyan, H Minsong, inBioinformatics and Biomedical Engineering, 2008. A new qrs detection algorithm based on empirical mode decomposition. ICBBE 2008. The 2nd International Conference on (IEEE, Shanghai, 2008), pp. 693–696
32. Y Chen, H Duan, A qrs complex detection algorithm based on
mathematical morphology and envelope. Conf. Proc. IEEE. Eng. Med. Biol. Soc.5, 4654-7 (2005)
33. F Zhang, Y Lian, Qrs detection based on multiscale mathematical morphology for wearable ecg devices in body area networks. IEEE Trans. Biomed. Circ. Syst.3, 220–228 (2009)
34. KV Suárez, JC Silva, Y Berthoumieu, P Gomis, M Najim, Ecg beat detection using a geometrical matching approach. IEEE Trans. Biomed. Eng.54, 641–650 (2007)
35. II Christov, Real time electrocardiogram qrs detection using combined adaptive threshold. Biomed. Eng. Online.3, 28 (2004)
36. S-W Chen, H-C Chen, H-L Chan, A real-time qrs detection method based on moving-averaging incorporating with wavelet denoising. Comput. Methods Prog. Biomed.82, 187–195 (2006)
37. E Plesnik, O Malgina, J Tasiˇc, M Zajc, Detection of the electrocardiogram fiducial points in the phase space using the euclidian distance measure. Med. Eng. Phys.34, 524–529 (2012)
38. D Benitez, P Gaydecki, A Zaidi, A Fitzpatrick, A new qrs detection algorithm based on the hilbert transform. Comput. Cardiol.2000, 379–382 (2000) 39. C Meyer, JF Gavela, M Harris, Combining algorithms in automatic
detection of qrs complexes in ecg signals. IEEE Trans. Inf. Technol. Biomed.10, 468–475 (2006)
40. H Li, J Tan, Body sensor network based context aware qrs detection. Pervasive Health Conf. Workshops.2006, 1–8 (2006)
41. GB Moody, RG Mark, inComputers in Cardiology 1990. Proceedings. The mit-bih arrhythmia database on cd-rom and software for use with it (IEEE, Chicago, 1990), pp. 185–188
42. D Castells-Rufas, J Carrabina, Simple real-time qrs detector with the mamemi filter. Biomed. Signal Process. Control.21, 137–145 (2015) 43. A Ligtenberg, M Kunt, A robust-digital qrs-detection algorithm for
arrhythmia monitoring. Comput. Biomed. Res.16, 273–286 (1983) 44. NS Altman, An introduction to kernel and nearest-neighbor
nonparametric regression. Am. Stat.46, 175–185 (1992)
45. O Pahlm, L Sörnmo, Software qrs detection in ambulatory monitoring—a review. Med. Biol. Eng. Comput.22, 289–297 (1984)
46. J Kennedy,Particle swarm optimization. Encyclopedia of machine learning. (Springer, US, 2011), pp. 760–766
47. Y Shi, R Eberhart, inEvolutionary Computation Proceedings, 1998. IEEE World Congress on Computational Intelligence., The 1998 IEEE International Conference on. A modified particle swarm optimizer.