Longitudinal variations in planetary wave activity in the equatorial mesosphere
S. Kovalam1, R. A. Vincent1, I. M. Reid1, T. Tsuda2, T. Nakamura2, K. Ohnishi2, A. Nuryanto3, and H. Wiryosumarto3
1Department of Physics and Mathematical Physics, University of Adelaide, Adelaide, Australia 2Radio Atmospheric Science Center, Kyoto University, Kyoto, Japan
3Indonesian Institute for Aeronautics and Space, Jakarta, Indonesia
(Received August 17, 1998; Revised March 19, 1999; Accepted March 19, 1999)
Zonal and meridional winds in the equatorial mesosphere and lower thermosphere (65–98 km) measured at two sites separated by 94◦ in longitude are used to study the zonal structure of planetary-scale waves. The data were obtained with MF radars located at Pontianak (0◦N, 109◦E)and Christmas Island (2◦N, 157◦W). The data at Christmas Island were collected from January 1990 to December 1997 and the observations at Pontianak were made from November 1995 to July 1997. Power spectral techniques are used to study the amplitude and frequency variations of long-period oscillations as a function of height and time. A mean climatology of these variations taken from years 1990–1997 is presented. Strong peaks in zonal and meridional winds are found at tidal periods and for the quasi 2-day wave. Zonal spectra exhibit considerable power at periods of 3–10 days, with transient oscillations with periods near 3.5 day and 6.5 days being especially prominent. The 6.5-day wave is particularly strong during April and September. Examination of the phase differences obtained from cross-spectra between the two stations show that the 6.5-day wave is westward propagating with zonal wavenumber 1, while the 3.5 day wave is eastward propagating with wavenumber 1. The 6.5-day wave is identified as a manifestation of an unstable mode, while the 3.5-day wave is identified as an ultrafast Kelvin wave. There are significant longitudinal variations in the amplitudes and inferred momentum fluxes of the 3.5-day wave, amplitudes being larger in the Asian region than in the central Pacific.
1.
Introduction
It is believed that the zonal-mean zonal circulation of the equatorial middle atmosphere is driven primarily by waves
propagating up from the troposphere. Wave driving is
thought to be especially important in producing the semian-nual oscillations (SAO) in the zonal-mean zonal winds that occur in the altitude range 30–90 km over the equator. The largest amplitudes of the SAO (∼30 m s−1) occur near the
mesopause (∼85 km) and the stratopause (∼50 km), with very small amplitudes near 65 km (Hirota, 1978; Hamilton, 1982; Garciaet al., 1997). Several mechanisms are likely to be responsible and this has motivated studies to distinguish the ways in which the mesopause and the stratopause SAO are driven (e.g. Dunkerton, 1982).
Understanding of the dynamics of the equatorial meso-sphere and lower thermomeso-sphere (MLT) region has improved markedly in the last decade. Radar probing of equatorial mesosphere became possible with the installation of a me-teor scatter radar (Avery et al., 1990) and a separate MF radar (Vincent and Lesicar, 1991) on Christmas Island (2◦N, 157◦W) in the central Pacific. Investigations of the equato-rial MLT in the western Pacific started with the installation of a meteor wind radar at Jakarta (6◦S, 107◦E) (Tsuda et al., 1995). Recently, equatorial middle atmosphere wind measurements from the Upper Atmospheric Research Satel-lite (UARS) have become available. The combination of
Copy right cThe Society of Geomagnetism and Earth, Planetary and Space Sciences (SGEPSS); The Seismological Society of Japan; The Volcanological Society of Japan; The Geodetic Society of Japan; The Japanese Society for Planetary Sciences.
ground-based and UARS observations provide a detailed cli-matological picture of the mean circulation (Lieberman et al., 1993; Palo and Avery, 1993; Vincent, 1993; Burrageet al., 1996b; Garciaet al., 1997), equatorial waves (Canziani et al., 1995; Lieberman and Riggin, 1997; Riggin et al., 1997), normal modes (Harris and Vincent, 1993; Wuet al., 1993; Palo and Avery, 1996), tides (McLandresset al., 1996; Vincentet al., 1998), and gravity waves (Conner and Avery, 1996; Isler and Fritts, 1996).
This paper uses data from the Christmas Island radar and from an MF radar recently installed at Pontianak (0◦N, 109◦E) in Indonesia. Pontianak is situated in the convec-tively active Maritime Continent region of the Western Pa-cific while Christmas Island is situated in a usually con-vectively quiescent region. The characteristics of equatorial waves change as they propagate away from their source re-gions in the troposphere (Liebmann and Hendon, 1990), so the radars are ideally located for investigating longitudinal variability in the mesosphere. Combining the data from dif-ferent sites can also provide information on the zonal wave number.
In this paper we investigate the characteristics of the long period waves as a function of both longitude and height. The data collection and analysis procedures are described in Sections 2 and 3 and the results, including estimates of zonal wavenumber, are discussed in Section 4. The results are summarized and further discussed in terms of possible wave types in Section 5.
2.
Data Collection and Analysis
The MF radars used in this study are identical in con-struction and operating frequency (1.98 MHz), with winds measured using the spaced-antenna technique. Raw data are analyzed in realtime using the full correlation analysis (Briggs, 1984). The commonality of the radars and data analysis techniques minimizes any problems that sometimes occur when data obtained with different techniques are com-pared. Observations are taken over the altitude range 60 to 98 km, with measurements made at 2 km height intervals every 2 minutes. The actual height coverage and time resolution obtained depends on the presence of suitable irregularities for scattering the radiowaves from the lower ionosphere.
Wind measurements are available from Christmas Island for the period January 1990 to December 1997. The ob-servations at Pontianak started in November 1995 and are available up to August 1997. These data provide us with nearly continuous data set of zonal and meridional winds in the height range 78–98 km both day and night. The data were screened to remove outliers and time series formed from hourly averages were used since we are here interested only in long-period motions.
3.
Analysis Procedures
The analysis of the radar wind data was separated into two categories. (i) Background wind studies to examine the sea-sonal behavior of the mesosphericflow and, (ii) studies of the energy content of the long-period waves in the mesosphere. We begin by spectrally analysing the velocity time series of Christmas Island and Pontianak at each height. Short gaps in the time series werefilled by linear interpolation and con-ventional FFT techniques applied after the subtraction of a linear trend. The power spectral densities provide informa-tion about the spectral content of the signal at afixed point of time. Moving time window spectra were used to study the temporal behavior of mesospheric waves. Power spec-tra were computed for a short time segment or window of data and the window was then shifted by an appropriate time step and the power spectra recalculated. By continuing this process a description of the spectral behavior with time was acquired.
The moving window analyses showed that mesospheric wave activity was highly dynamic, with significant changes in spectral power occurring in relatively short time intervals. The data were reanalyzed using harmonic fits in order to obtain more quantitative estimates of wave amplitudes and phases at times when the spectral powers were large. A linear trend was removed from the data and a least-squares harmonicfit made using a singular value decomposition tech-nique (Press et al., 1992). The harmonic fitting window spanned at least four cycles of a wave period. The window was then advanced by an appropriate amount to obtain the time dependence of amplitude and phase.
4.
Analysis Results
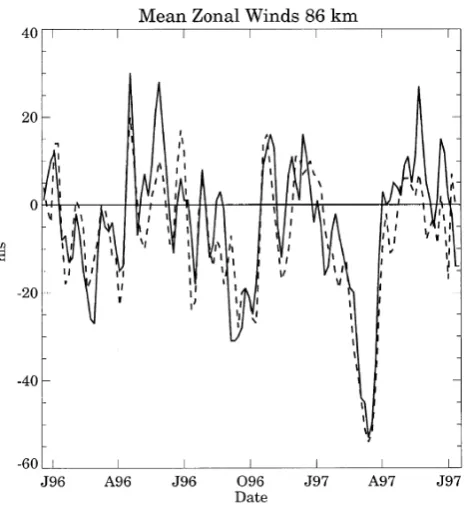
4.1 Mean zonal windsThe focus of this paper is on seasonal and longitudinal variations in planetary wave activity, but to set the results in context wefirst consider the behavior of the prevailing winds. Figure 1 shows time series of the mean zonal winds measured
Fig. 1. Mean zonal winds in 10-day intervals at 86 km for Christmas Island (solid) and Pontianak (dashed)
at Christmas Island and Pontianak at an altitude of 86 km, where the seasonal variations in the zonal wind tend to be largest (Vincent, 1993; Garciaet al., 1997). The mean winds were derived from 10-day windows that were advanced in 5 day steps. It is apparent that the winds at each site track each other very closely. The mesospheric semiannual oscil-lation (MSAO) is very apparent, with negative (westward)
flow at the equinoxes and positive (eastward)flow at the sol-stices. Strong interannual variability is also apparent, with the westwardflow in March/April 1997 much stronger than in March/April 1996. This pattern of weak and strong zonal westward winds in March/April in alternate years continues the sequence reported by Burrageet al.(1996b) and Garcia
et al.(1997) who noted an apparent correlation between the westward phase of the MSAO and the quasi-biennial oscil-lation in zonal-mean zonal winds in the stratosphere.
It is noteworthy that wind fluctuations on time scales shorter than seasonal are also very similar at Pontianak and Christmas Island. Thesefluctuations with periods of tens of days are manifestations of mesospheric intraseasonal oscil-lationsfirst reported by Eckermann and Vincent (1994) and Eckermannet al.(1997) from observations at Christmas Is-land. The strong similarity of the intraseasonal variations at the two sites indicate that they are global in extent, reinforc-ing thefindings of Lieberman (1998).
4.2 Power spectra
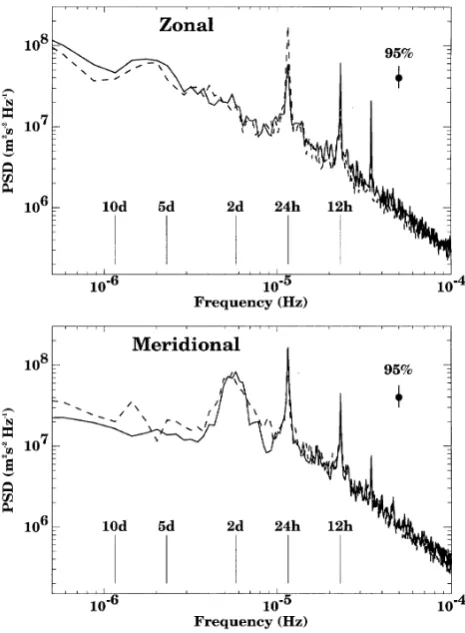
Fig. 2. Frequency spectra of hourly averaged zonal (top) and meridional winds (bottom) averaged between 86 and 92 km at Christmas Island (solid line) and Pontianak (dashed line) for the period November 1995 to August 1997. Confidence limits at the 95% level are indicated.
associated with each spectral estimate (Presset al., 1992). Spectra computed for four heights from 86 to 92 km were then averaged together to further improve the spectral reli-ability. At each height there were 29 overlapping segments giving a notional 29×2×9/11∼47.5 degrees of freedom (dof). The factor of 9/11 arises from the correlation between overlapping segments (Presset al., 1992). Averaging over four height ranges (8 km) should increase thedof by a factor of 4, but spectra from adjacent heights are not completely independent since the radar pulse length is about 4 km. It is conservatively estimated that there are about 95dof asso-ciated with each spectral estimate. Confidence limits at the 95% level are shown. Spectra for the full 8 years of data from Christmas Island (not shown) are very similar.
The spectra for a given wind component are very similar at the two sites, which indicates that similar dynamical pro-cesses are being observed. Narrow spectral peaks associated with the diurnal, semidiurnal and terdiurnal tides are clearly evident. However, the diurnal tidal amplitudes in the zonal component are larger at Pontianak than at Christmas Island. Conversely, the semidiurnal amplitudes are a little larger at Christmas Island. At periods shorter than about 1 day the spectral densities decrease with an approximate f−5/3power
law as found at other latitudes. This part of the spectrum is usually ascribed to gravity wave motions (see Fritts and VanZandt (1993) and references therein). In the high
fre-quency part of the spectrum energies are approximately equally partitioned between the zonal and meridional wind components. At periods longer then 24 h, however, energy is less equally distributed. The broad peak with a period near two days in the meridional component is due to the quasi-2-day wave, which is a strong feature of the midlatitude summer mesosphere, particularly in the southern hemisphere (Salby, 1981, 1984; Harris, 1993; Paloet al., 1997). The zonal spec-tra exhibit considerable power in the period range between 3 and 10 days, with a broad peak evident near 6 to 7 days.
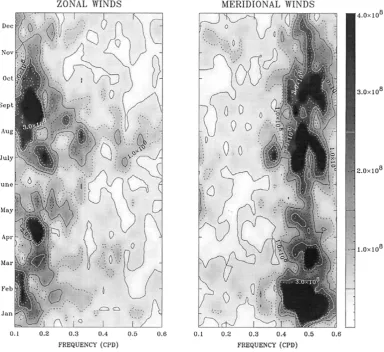
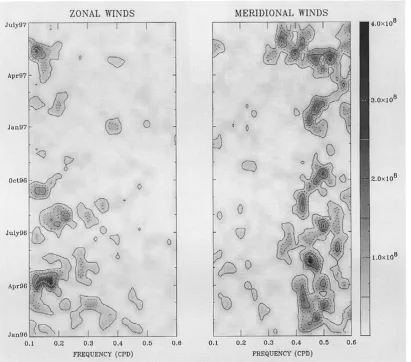
To summarize seasonal variations in wave activity, Fig. 3 represents the annual average power spectral density of MLT wind components in the frequency range 0.1 to 0.6 cpd at Christmas Island for the entire eight-year observing period. The power spectra were computed using time series that were 40 days in length (bandwidth of 0.025 cpd) which were then stepped forward one day at a time and the spectra recom-puted. The spectral powers were limited or clipped to a maximum value of 4×10⁸ m2 s−2Hz−1 in order to bring
out more clearly the details in the spectra and allow them to be compared on an equivalent basis. Maximum activity appears between January and April and between July and October in the zonal wind component. Strong peaks are es-pecially apparent near 0.15 cpd (6 to 7 day periods) in April and September. Relatively strong wave activity is also ap-parent at a frequencies of 0.33 cpd (3 days) in August and near 0.28 cpd (3.5 days) in early September. The domi-nant feature of the meridional wind plot is the quasi-2 day wave. This seems to be present almost continuously, but has maxima in January/February, March, July/August and in September/October. The behavior of the 2-day wave in the equatorial MLT will not be discussed further here, as it is similar to that extensively described by Harris and Vincent (1993) and Palo and Avery (1996) from Christmas Island observations.
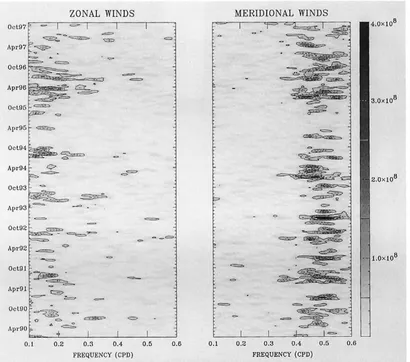
Although Fig. 3 is an an average of eight years of obser-vations it still suggests that wave activity is often transitory. Moving window power spectra were computed in order to investigate better the short term temporal behavior on both seasonal and interannual timescales. Figures 4 and 5 show the spectra of the zonal and the meridional wind at Christmas Island and Pontianak, respectively. Considerable transient power is observed at periods near 2-days (f ∼0.5 cpd) in the meridional wind component, but relatively little energy is observed in the zonal component at this frequency. As expected from the mean power spectra the zonal winds are dominated by transient wave activity in the frequency range 0.1–0.3 cpd. Bursts of activity at frequencies near 0.16 cpd, corresponding to a period of about 6 days, are particularly evident at both stations. More sporadic bursts of activity are also evident in the frequency range 0.25 to 0.33 cpd (periods between 3 and 4 days).
Fig. 3. Annual-average moving-window power spectra of zonal (left) and meridional (right) winds at Christmas Island. A 40-day window is used. The bar indicates spectral density in m2s−2Hz−1
and Christmas Island (C) are presented in Fig. 6 in terms of the squared-coherence (coh2) and cross-spectral phase (φ) at frequency f, where
coh2(f)= S 2 PC(f)
S2 P(f)S
2 C(f)
(1)
and
φ(f)=arctan(I(SPC(f))/R(SPC(f))). (2)
HereRandIare the real and imaginary parts respectively, and the phase is such that a positive value means that Christmas Island leads Pontianak.
The results for the zonal component are shown in Fig. 6 for the period range from 1.1 to 10 days. The coherence-squared values are highly significant at periods near 6.5, 3.5, and 2.5 days. The phase plot shows that on average Christmas Is-land leads Pontianak by about 0.25 cycle at a period of 6.5 day, but at 3.5 day the phase difference is about−0.25 cycle. For reference, the dotted lines show the phase differences expected for waves with zonal wavenumber 1 propagating westward (+1) and eastward (−1). However, spatial alias-ing means that similar phase differences would be observed for eastward and westward propagating zonal wavenumber-3 waves.
4.3 Harmonic analysis
Fig. 4. Moving-window power spectra of zonal (left) and meridional (right) winds for Christmas Island for the period January 1990 to December 1997.
mode, as discussed in Subsection 5.1.
The details of the event described above typify the general behavior of the 6.5-day wave. To provide a more quantitative description of the activity as a function of height and time a harmonic analysis was carried out for calendar year 1996. The data were analyzed in thirty-day segments, with each segment moved on by 15 days. Time series of the amplitude and phases were generated at each height between 78 and 98 km. Contour plots of the zonal amplitude at the two stations are given in Fig. 8. The phase, represented by the time of maximum eastward wind, are superimposed as solid circles. Amplitudes are somewhat different at the two stations, but the overall seasonal behavior is similar. In thefirst half of the year maximum amplitudes are attained in April, and in the second half they are centered on September, although significant amplitudes are observed in July and October at Christmas Island. Thirty-day average amplitudes as large as 20 m s−1are found near 90 km, but short-term peak
ampli-tudes are even larger (Fig. 7). It is interesting to note that zonal amplitudes show strong variations with height dur-ing March/April and September/October. Wave amplitudes maximize between 90 and 95 km and then slowly decrease with increasing in height. At other times the variation is irreg-ular. Thesefigures also show that phases are highly organized throughout the observation period and are similar at the two
sites. Usually there is a downward progression with time, al-though upward phase progressions are sometimes observed, usually when the amplitudes are weak so that the phases are less reliably determined. The small change in phase with height is an indication of the long vertical wavelength of the 6.5-day wave.
The general properties of the 3.5-day wave were analyzed in a manner similar to that described above. Figure 9 illus-trates the time-height variation of the zonal wavefield of the 3-day wave at the Christmas Island and Pontianak for 1996. Table 1 summarizes the main features of the 3.5-day wave in two-month intervals. Variations in the wave period were studied by band-passfiltering the hourly average time series between 0.22 and 0.38 cpd (period range 2.6–4.6 day) and computing the cross correlation function. The period is the time interval between adjacent peaks. The zonal wavenum-ber is estimated from the phase differences while the vertical wavelength is estimated from the phase lag of zonal winds between 86 and 94 km altitude at Pontianak. Peak amplitudes are about 25 m s−1, compared with 30-day mean values of
10–15 m s−1.
5.
Discussion and Conclusions
Fig. 5. Moving-window power spectra of zonal (left) and meridional (right) for Pontianak for the period November 1995 to August 1997.
Table 1. Properties of 3.5-day Kelvin waves inferred from harmonicfits to zonal winds in two-month intervals. The values in brackets indicate the zonal wavenumber due to aliasing
Observation period Mar–Apr 96 May–Jul 96 Aug–Oct 96 Nov–Dec 96 Mean Wave period 3.3 d 3.5 d 3.5 d 3.7 d 3.5 d
Zonal wave-number +0.7 +1.1 +0.7 +0.8 +1
(−3.1) (−2.7) (−3.1) (−3.0)
Amplitude 25 m/s 30 m/s 25 m/s 20 m/s 25 m/s
Vertical wavelength 76 km 80 km 53 km 88 km 75 km
94◦ in longitude, are used to explore the characteristics of planetary-scale waves in the equatorial MLT region (78–98 km). A number of discrete long-period oscillations in the zonal wind and meridional winds are found to have common temporal behavior. Spectral analyses show that the power spectral densities are very similar at all frequencies at both locations, with narrow spectral peaks occurring at tidal peri-ods and broader peaks near two days in the meridional com-ponent and near 6.5 and 3.5 days in the zonal comcom-ponent. Moving-window spectral analyses showed that the quasi-2-day wave is a prominent and almost continuous feature of the meridional wind component in the equatorial mesosphere, in
agreement with earlier studies. The 6.5 and 3.5 day waves are more transient in their behavior, with bursts of oscilla-tions lasting for 4–5 cycles. The largest amplitudes occur near the equinoxes. Cross-spectral and harmonic analyses show that the waves propagate in opposite directions in the zonal direction. This suggests that the waves are of different types and have different origins.
5.1 The 6.5-day wave
Fig. 6. Squared coherence (top) and cross-spectral phase (bottom) between zonal winds measured at Pontianak and Christmas Island. The period range is from 1.1 to 10 days
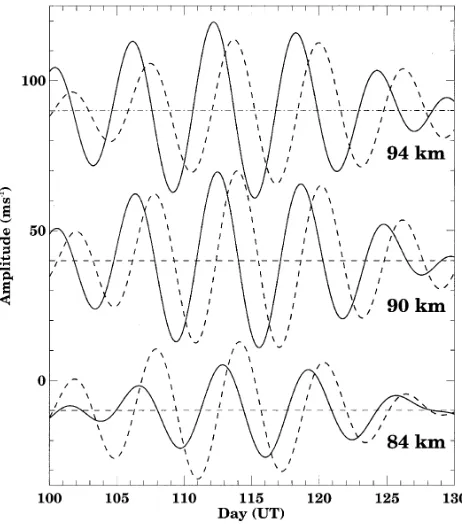
Fig. 7. Hourly-average zonal winds measured at Christmas Island (solid) and Pontianak (dashed) at heights of 84, 90 and 94 km during the period 9 April to 9 May 1996. The time series are bandpassed with afilter centered on 6.5 days.
Fig. 8. Time-height cross section of zonal wind amplitudes and phases obtained fromfits of a 6.5-day sinusoid to data at Christmas Island (top) and Pontianak (bottom) during 1996. Estimates are for 30 day intervals slid by 15 days. Filled circles denote time of maximum eastward wind.
Fig. 9. As for Fig. 7, but for the 3.5-day wave.
and Leovy, 1986; Canzianiet al., 1995). Maximum wave activity at the stratopause was reported to occur when the background winds were westward, that is opposite to the eastward propagating waves. Similarly, maximum wave ac-tivity of the 6.5-day wave at the mesopause is found to occur at the equinoxes when the backgroundflow is westward.
One problem with the Kelvin wave interpretation is that, as discussed above, the vertical wavelength of the 6.5-day wave is observed to be greater than 65 km. The dispersion relation for Kelvin waves is the same as large scale two-dimensional gravity waves (Andrewset al., 1987) viz:
m= spectively, the vertical and horizontal wavenumbers,ωˆis the intrinsic frequency andHis the scale height. Zonal wave-1 fast Kelvin waves have intrinsic phase speeds (ω/ˆ k) of less than 100 m s−1, which, from (3), means vertical wavelengths
(2π/m) shorter than 25–30 km. Higher zonal wavenumber waves would have even shorter wavelengths. The long ver-tical wavelength and the phase relation between Christmas Island and Pontianak indicating westward propagation taken together mean that an explanation other than Kelvin waves is required.
Meyer and Forbes (1997) discuss satellite and radar ob-servations made in August-September 1993 at mid latitudes in the 80–100 km height region which showed a westward propagating wave with a period somewhat greater than 6-days. This had been interpreted as a Doppler-shifted 5-day normal mode (Wuet al., 1994), although the 5-day wave is known to be insensitive to the state of the mean wind. Meyer and Forbes (1997) showed that this event is probably a man-ifestation of an unstable mode driven by shear of the zonal mesospheric jet located near 60◦N. The 6.5 day wave re-sembles a Kelvin wave in that there is little or no signature in the meridional wind at the equator, but it has a much larger vertical wavelength.
Our observations are consistent with the characteristics of the 6.5-day wave described by Meyer and Forbes (1997). Furthermore, observations of strong 6.5-day wave events in April as well as September suggest that it is a common fea-ture of the equinoctial MLT region. An analysis similar to that described by Meyer and Forbes (1997) indicates that the middle atmosphere windfield in April is conducive to the generation of the wave by instabilities and there is a strong response toin situmomentum forcing at high latitudes in the southern hemisphere (C. Meyer, Personal Communication, 1998). These results show that instabilities are a common feature of the equinoctial middle atmosphere windfields.
Onefinal point, is that there appears be a small longitu-dinal variation in wave amplitude. Both Fig. 2 and Fig. 8 suggest slightly larger amplitudes forfluctuations near 6.5 day over Christmas Island than over Pontianak. This needs to be confirmed by further study, but may indicate stronger dissipation over Indonesia due to strong gravity wave activity in this region.
5.2 The 3.5-day wave
In contrast to the 6.5-day wave, the characteristics of 3.5-day period waves observed at Christmas Island and Pontianak
are consistent with these being manifestations of Kelvin waves. Ultrafast wavenumber-1 Kelvin waves have intrinsic phase speeds∼150 m s−1, or vertical wavelengths of∼50
km, which is consistent with our observations. Our results are also consistent with observations of 3-day Kelvin waves made with the High Resolution Doppler Instrument (HRDI) instrument on the UARS satellite (Lieberman and Riggin, 1997) and with previous equatorial radar observations (Rigginet al., 1997). Using 10-day sequences of observa-tions Lieberman and Riggin (1997) report eastward propagat-ing signatures which maximize near the equator in wavenum-bers 1, 2, and 3 in the zonal windfield with periods near 3 days. Rigginet al.(1997), using a 9-month sequence of MF radar wind data from Christmas Island and meteor radar data from Jakarta taken in 1993, found a high degree of coherence between the two sites at periods near 3 days. The long ver-tical wavelength suggested that it was predominantly zonal wavenumber 1. The nineteen month sequence of observa-tions discussed here allow us to update these studies.
During July, the radar amplitudes are fairly consistent with the HRDI amplitudes. Comparisons with HRDI derived phases for June/July, the observed phases agree well through-out much of the vertical radar range, generally decreasing systematically with increasing altitude. At Christmas Island, the phase agreement is quite good in the 80–90 km layer where upward energy propagation is observed; however, radar amplitudes are weaker than HRDI amplitudes, a ten-dency that has been documented by Burrageet al.(1996a). HRDI phases are generally consistent with Pontianak and Christmas Island below 90 km but deviate substantially above that level.
An interesting feature of the contour plots in Fig. 9 is that amplitudes at Pontianak are often different to those ob-served at Christmas Island. In months when the amplitudes are largest (March/May and July/August) the amplitudes at Pontianak are larger than at Christmas Island by a ratio that varies between 1.25 and 1.4 for heights between 80 and 98 km. This supports thefindings of Rigginet al.(1997) who compared Jakarta meteor radar observations with Christmas Island MF radar observations. Rigginet al.(1997) were not sure whether the difference was due to instrumental differ-ences or to source effects. The radars used in this study are identical which shows that source effects are the cause of the longitudinal differences. Pontianak and Jakarta, located as they are in the strong convection region of the Maritime Continent, are close to the source of Kelvin waves. Ra-diosonde observations made in Indonesia of 3.5-day Kelvin waves near their generating regions in the lower atmosphere and comparisons with Jakarta meteor radar observations in the mesosphere are discussed in Yoshidaet al.(1998).
The amplitude growth of the 3.5-day wave with height is less than might be expected if the waves were propagating without dissipation. Dissipating waves exert a body force on the atmosphere through the convergence of the vertical com-ponent of zonal momentumflux, given byρuw(Andrews
et al., 1987), where ρ is atmospheric density and u and
ware the zonal and vertical perturbation velocities,
Table 2. Average of zonal accelerations (m s−1day−1) for 3.5-day wave in 1996. The values in brackets refer to January-September 1993 for Jakarta and Christmas Island (Rigginet al., 1997).
Height (km) Pontianak Christmas Island
Jan–Sept Jan–Dec Jan–Sept Jan–Dec 86–90 0.18±0.05 0.15±0.06 −0.06±0.01 −0.06±0.01
(0.18±0.05) (0.30±0.03)
90–94 0.48±0.06 0.44±0.06 0.21±0.04 0.19±0.14 (0.54±0.08) (0.29±0.04)
terms ofuso the vertical momentumflux becomes
P= 1
2ρu
2R
− k
(m2+ 1 4H2)
m− i
2H
. (4)
Vertical profiles ofPwere computed from the 30-day average amplitude fits, with estimates of m made from the phase profiles; a value ofkappropriate for a zonal wavenumber-1 Kelvin wave was assumed. The body force per unit mass is thenax= −ρ−1(∂P/∂z). Values ofPwere computed at 2–
km height intervals and then smoothed byfitting a third-order polynomial before computing the vertical derivative.
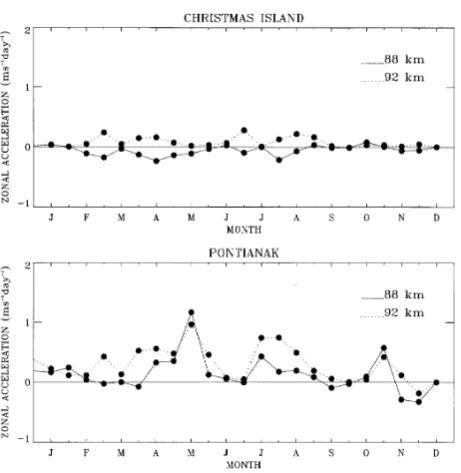
Estimates ofaxas a function of time are shown in Fig. 10
for Christmas Island and Pontianak in the two height in-tervals of 86–90 km and 90–94 km. There are a number of interesting features. In the lower height range the val-ues at Christmas Island are consistently negative whereas at Pontianak the values are positive, except in the last part of 1996. Above 90 km the values of ax are positive at both
locations, but the values at Pontianak tend to be larger in magnitude, especially in July/August. Annual average val-ues for the two height intervals are given in Table 2, where they are also compared with the nine-month averages from Rigginet al.(1997) using Jakarta and Christmas Island data between January and September 1993.
There is rather good agreement between the estimates of
axmade here and those reported in Rigginet al.(1997),
es-pecially above 90 km. It is noteworthy that the 12-month averages forax are somewhat smaller than the 9-month
av-erages and that the values for 1993 tend to be a little larger than for 1996. The latter feature may indicate interannual variability, but it is probable that somewhat different data processing techniques also influence the results. Rigginet al.(1997) used shorterfitting intervals (12.8 days) in their analysis than the 30-day fits that were used here. As Ta-ble 1 shows, the peak amplitudes observed in 1996 are often twice as large as the 30-day average values, so we if had used shorterfitting intervals the inferredfluxes would have been larger. What is important is that both studies show that the Kelvin waves have larger amplitudes in the Asian region than in the central Pacific and the wave drag exerted on the zonalflow is larger in this region. The longitudinal varia-tions in the Kelvin-wave drag may account, in part, for the longitudinal variations in the amplitude of the mesospheric semiannual oscillation observed from HRDI measurements (Smith, 1997).
Comparing the time sequence of accelerations (Fig. 10)
Fig. 10. Time series of zonal body force estimates for Christmas Island (top) and Pontianak (bottom) for the 3.5-day wave. The solid (dashed) line shows values in the 86–90 (90–94) km height range.
with the evolution of the 86-km zonal winds shown in Fig. 1, it seems that the large positive values ofax in May 1996 at
Pontianak coincide with the reversal of the zonalflow from westward to eastward. Similarly, the positiveaxobserved in
Acknowledgments. Helpful discussions with C. Meyer and J. Forbes are gratefully acknowledged. Operation of the Christmas Island radar is supported by the Australian Research Council. Sup-port from grants 09044080 and 07044082, from the Ministry of Ed-ucation, Science, Sports and culture of Japan from The Mitsubishi Foundation is also acknowledged.
References
Andrews, D. G., J. R. Holton, and C. B. Leovy,Middle Atmospheric Dy-namics, 489 pp., Academic Press, Orlando, 1987.
Avery, S. K., J. P. Avery, T. A. Valentic, S. E. Palo, M. J. Leary, and R. L. Obert, A new meteor echo detection and collection system: Christmas Island mesospheric measurements,Radio Sci.,25, 657–669, 1990. Briggs, B. H., The analysis of spaced sensor records, inHandbook for Map,
13, edited by R. A. Vincent, pp. 166–186, 1984.
Burrage, M. D., D. A. Gell, P. B. Hays, A. R. Marshall, D. A. Ortland, W. R. Skinner, S. J. Franke, D. C. Fritts, P. Hoffman, A. H. Manson, C. McLandress, R. Nieciejewski, F. J. Schmidlin, G. G. Shepherd, W. Singer, T. Tsuda, and R. A. Vincent, Validation of mesospheric and lower ther-mospheric winds from the high resolution Doppler imager,J. Geophys. Res.,101, 10,365–10,392, 1996a.
Burrage, M. D., R. A. Vincent, H. G. Mayr, W. R. Skinner, N. F. Arnold, and P. B. Hays, Long-term variability in the equatorial mesosphere and lower thermosphere zonal wind,J. Geophys. Res.,101, 12,847–12,854, 1996b.
Canziani, P, O., J. R. Holton, E. F. Fishbein, and L. Froideveaux, Equatorial Kelvin wave variability during 1992 and 1993,J. Geophy. Res.,100, 5193–5202, 1995.
Conner, L. N. and S. K. Avery, A three year gravity wave climatology of the mesosphere and lower thermosphere over Kauai,J. Geophys. Res.,101, 4065–4077, 1996.
Dunkerton, T. J., A Theory of the mesopause semiannual oscillation,J. Atmos. Sci.,39, 2681–2690, 1982.
Eckermann, S. D. and R. A. Vincent, First observations of intraseasonal os-cillations in the equatorial mesosphere and lower thermosphere,Geophys. Res. Lett.,21, 265–268, 1994.
Eckermann, S. D., D. K. Rajopadhyaya, and R. A. Vincent, Intraseasonal wind variability in the equatorial mesosphere and lower thermosphere: Long term observations for the central Pacific,J. Atmos. Terr. Phys.,59, 603–627, 1997.
Fritts, D. C. and T. E. VanZandt, Spectral estimates of gravity wave en-ergy and momentumfluxes. Part I: Energy dissipation, acceleration, and constraints,J. Atmos. Sci.,50, 3685–3694, 1993.
Garcia, R. R., T. J. Dunkerton, R. S. Lieberman, and R. A. Vincent, Clima-tology of the semiannual oscillation of the tropical middle atmosphere,
J. Geophys. Res.,102, 26,019–26,032, 1997.
Hamilton, K. P., Rocketsonde observations of the mesospheric semiannual oscillation at Kwajalein,Atmos-Oceans.,20, 281–286, 1982.
Harris, T. J. and R. A. Vincent, The Quasi-Two-day wave Observed in the Equatorial Middle atmosphere,J. Geophys. Res.,98, 10,481–10,490, 1993.
Hirota, I., Equatorial waves in the upper stratosphere and mesosphere in relation to the semiannual oscillation of the zonal wind,J. Atmos. Sci.,
35, 714–722, 1978.
Hirota, I., Kelvin waves in the equatorial middle atmosphere observed by the Nimbus 5 SCR,J. Atmos. Sci.,36, 217–222, 1979.
Hitchman, M. H. and C. B. Leovy, Evolution of the zonal mean state in the equatorial middle atmosphere during October 1978–May 1979,J. Atmos. Sci.,43, 1253–1267, 1986.
Hitchman, M. H. and C. B. Leovy, Estimation of the Kelvin wave con-tribution to the semiannual oscillation,J. Atmos. Sci.,45, 1462–1475, 1988.
Isler, J. R. and D. C. Fritts, gravity wave variability and the interaction with the low frequency motions in the lower mesosphere and thermosphere over Hawaii,J. Atmos. Sci.,53, 37–38, 1996.
Lieberman, R. S., Intraseasonal variability of high-resolution Doppler im-ager winds in the equatorial mesosphere and lower thermosphere,J. Geo-phys. Res.,103, 11,221–11,228, 1998.
Lieberman, R. S., M. D. Burrage, D. A. Gell, P. B. Hays, A. R. Marshall, D. A. Ortland, W. R. Skinner, D. Wu, R. A. Vincent, and S. J. Frank,
Zonal mean winds in the equatorial mesosphere and lower thermosphere observed by the high resolution Doppler imager,Geophys. Res. Lett.,20, 2849–2852, 1993.
Lieberman, R. S. and D. Riggin, High resolution Doppler imager observa-tions of Kelvin waves in the equatorial mesosphere and lower thermo-sphere,J. Geophys. Res.,102, 26,117–26,129, 1997.
Liebmann, B. and H. H. Hendon, Synoptic-scale disturbances near equator,
J. Atmos. Sci.,47, 1463–1479, 1990.
McLandress, C., G. G. Shepherd, B. H. Solhiem, M. D. Burrage, P. B. Hays, and W. R. Skinner, Combined Mesosphere/Thermosphere winds using WINDII and HRDI data from the Upper Atmospheric Research Satellite,J. Geophys. Res.,101, 10,441–10,453, 1996.
Meyer, C. K. and J. M. Forbes, A 6.5-day westward propagating plane-tary wave: origin and its characteristics,J. Geophys. Res.,102, 26,173–
26,178, 1997.
Palo, S. E. and S. K. Avery, Mean winds and the semiannual oscillations in the mesosphere and lower thermosphere at the Christmas island,J. Geophys. Res.,98, 20,385–20,400, 1993.
Palo, S. E. and S. K. Avery, Observations of the quasi-two-day wave in the middle and lower atmosphere over Christmas Island,J. Geophys. Res.,
101, 12,833–12,846, 1996.
Palo, S. E., M. E. Hagan, C. E. Meek, R. A. Vincent, M. D. Burrage, C. McLandress, S. J. Franke, W. Ward, R. R. Clark, P. Hofman, R. Johnson, D. Kuerschner, A. H. Manson, D. Murphy, T. Nakamura, Yu. I. Potnyagin, J. E. Salah, R. Schminder, W. Singer, T. Tsuda, T. S. Virdi, and Q. Zhou, An intercomparison between GSWM, UARS and ground-based radar observations: A case study in January 1993,Ann. Geophys.,15, 1123–
1141, 1997.
Press, W. H., S. A. Teukolsky, W. T. Vetterling, and B. P. Flannery, Nu-merical Recipes in C: The Art of Scientific Computing, 2nd Ed., 994 pp., Cambridge University Press, Cambridge, 1992.
Riggin, D., D. C. Fritts, T. Tsuda, T. Nakamura, and R. A. Vincent, Radar observations of a 3-day Kelvin wave in the equatorial mesosphere, J. Geophys. Res.,102, 26,141–26,157, 1997.
Salby, M . L., The 2-day wave in the middle atmosphere: Observations and theory,J. Geophys. Res.,86, 9654–9664, 1981.
Salby, M . L., Survey of planetary-scale traveling waves: The state of theory and observations,Rev. Geophys. Space Phys.,22, 209–236, 1984. Smith, A. K., Longitudinal variability of the mesopause SAO,Geophys.
Res. Lett.,24, 1991–1994, 1997.
Tsuda, T., S. Fukao, M. Yamamoto, T. Nakamura, M. D. Yamanaka, T. Adachi, H. Hashiguchi, N. Fujioka, M. Tsutsumi, S. Kato, S. W. B. Harijono, T. Sribimawati, B. P. Sitorus, R. B. Yahya, M. Karmini, F. Renggono, B. L. Parapat, W. Djojonegoro, P. Mardio, N. Adikusumah, H. T. Endi, and H. Wirosumarto, A preliminary report on observations of equatorial dynamics in Indonesia with radars and radiosondes,J. Meteor. Soc. Japan.,73, 393–406, 1995.
Vincent, R. A., Long-period motions in the equatorial mesosphere,J. Atmos. Terr. Phys.,55, 1067–1080, 1993.
Vincent, R. A. and D. Lesicar, Dynamics of the equatorial mesosphere: First results with a new generation partial reflection radar,Geophys. Res. Lett.,
18, 825–828, 1991.
Vincent, R. A., S. Kovalam, D. C. Fritts, and J. R. Isler, Long-term MF radar observations of solar tides in the low-latitude mesosphere: Interannual variability and comparisons with the GSWM,J. Geophys. Res., 103, 8667–8683, 1998.
Wu, D. L., P. B. Hays, W. R. Skinner, A. R. Marshall, M. D. Burrage, R. S. Lieberman, and D. A. Ortland, Observations of the quasi 2-day wave from the High Resolution Doppler Imager on UARS,Geophys. Res. Lett.,
20, 2853–2856, 1993.
Wu, D. L., P. B. Hays, and W. R. Skinner, Observations of the 5-day waves in the mesosphere and lower thermosphere,Geophys. Res. Lett.,21, 2733–
2736, 1994.
Yoshida, S., T. Tsuda, A. Shimizu, and T. Nakamura, Seasonal variations of 3.0∼3.8-day ultra-fast Kelvin waves observed with a meteor radar and radiosondes in Indonesia,Earth, Planet. Sci., 1998 (submitted).