400 and 1000 km is extremely complicated, with intermediate scale structures present regionally as seismic reflectors under the 660 km discontinuity and bent plume-like structures under the transition zone. We have studied the dynamics of the transition zone with two models, an axisymmetric spherical-shell (2-D) model with a horizontally averaged temperature- and pressure-dependent viscosity and a 3-D Cartesian model with a depth-dependent viscosity. Two mantle phase transitions have been employed in both models. Results of the 2-D axisymmetric model show that the interaction of the lower mantle plumes with the transition zone can result in a horizontal channel flow right underneath the 660 km and in the birth of secondary plume some distance away from the lower mantle plume. The strength of the secondary plume increases in strength with larger viscosity contrast across the 660 km discontinuity. In the 3-D model we have found that with the presence of a second low viscosity zone somewhere between 660 and 1000 km, many secondary instabilities are developed in the second asthenosphere and the mesoscale thermal structure developed can become quite complex. Many small-scale plumes can emanate from the transition zone. Occasionally a very large plume burst, with a near-surface radius exceeding 1000 km, can develop from the hot lower-mantle material trapped in the second asthenosphere. Both the viscosity and the phase transition structure between 660 km and 1000 km can exert a significant influence on the plume distribution and cause singular plume eruption events in the upper mantle. Plume instabilities originating below the 660 km discontinuity in the western Pacific might have launched a large hot upwelling into the upper mantle, thus precipitating the massive flood basalt volcanism in the Ontong-Java region.
1.
Introduction
It has long been recognized (e.g. Birch, 1954; Ringwood, 1982) that the transition zone and the region extending down to 1000 km plays an important role in governing the dynam-ics of the Earth’s mantle and its thermal evolution (Steinbach et al., 1993; Breuer and Spohn, 1995; Allegre, 1997). Re-cently there have been several important developments in seismology from anisotropy (Montagner and Kennett, 1996; Vinniket al., 1997), seismic phase analysis (Kawakatsu and Niu, 1994; Le Stunff et al., 1995; Niu and Kawakatsu, 1997; Castle and Creager, 1998) and tomography (Obayashi et al., 1995; Widiyantoro and van der Hilst, 1996; Zhou, 1996; Widiyantoro, 1997) which reveal layered structures with sharp reflective properties from a depth of 800 km down to around 1000 to 1100 km under some regions in the Pacific. Bent plume-like structures have also been visualized in re-cent tomographical models by Bijwaard and Spakman (1998) and Bijwaardet al. (1998). Using arguments drawn from mineral physics, Karato (1998) has pointed out the poten-tial important relationship between seismic anisotropy in the transition zone and the shear flow in the boundary layer under the 660 km seismic discontinuity. Both laboratory (Bercovici and Mahoney, 1994; Griffithset al., 1995; Guillou-Frottieret
Copy right cThe Society of Geomagnetism and Earth, Planetary and Space Sciences (SGEPSS); The Seismological Society of Japan; The Volcanological Society of Japan; The Geodetic Society of Japan; The Japanese Society for Planetary Sciences.
al., 1995) and numerical experiments (Davies, 1995; Chris-tensen, 1996; Nakakuki et al., 1997; Olbertz et al., 1997; Steinbach and Yuen, 1997; Cizkova and Cadek, 1997; Brunet and Machetel, 1998) have revealed the complicated dynam-ics in the transition zone region, caused by impinging plumes from the lower mantle and by slab interaction due to surface trench migration. Most of the focus has been directed at the endothermic nature of the phase transition at 660 km depth and not much attention has been devoted on the underlying viscosity structure below this depth. All of these recent ef-forts have strongly underscored the multidisciplinary nature of the transition-zone dynamics.
Mantle viscosity structure between 400 and 1000 km is ex-tremely complex (e.g. Forteet al., 1994). Recently there is an accumulating evidence from the inversion of geoid anoma-lies, which argue for the plausible existence of a low viscosity zone under the 660 km discontinuity (Ravine and Phipps-Morgan, 1996; Cadeket al., 1997; Kido and Cadek, 1997; Kidoet al., 1998; Quinn and McNutt, 1998). Such a low viscosity zone may be due to the grain-size reduction across the phase transition (Riedel and Karato, 1997) and to the dynamics of partial-layered convection in which the wide lateral flow of hot lower-mantle plumes impinging at the in-ternal boundary layer at 660 km may conceivably cause a low viscosity zone under the transition zone because of the temperature dependence of mantle rheology. This second asthenosphere may have similar origins to the top
sphere near oceanic ridges, which may be caused by the hot horizontal flow coming out from the rising sheet-like structure in high Rayleigh number convection (Olson and Corcos, 1980). Three-dimensional numerical modelling of mantle convection with such a second asthenosphere under an endothermic phase change at 660 km depth (Cserepes and Yuen, 1997) has shown the important effects associated with the channel-flow and secondary instabilities developed in the top part of the lower mantle. Recent work by Cserepeset al. (1998) has further emphasized the significant effects caused by the presence of this second asthenosphere, interacting with the 440 km phase change.
From a fluid dynamical standpoint, the presence of any sort of internal boundary layer or regions with some sort of
flow blockage would likely to produce secondary instabili-ties, such as diapirs or secondary upwellings (Liuet al., 1991; Steinbach and Yuen, 1997). The objective of this paper is to employ large-scale numerical modelling as a tool to demon-strate some new ideas about the boundary layer dynamics potentially present in the zone between 660 and 1000 km depth. Geochemists, in fact, have often raised the issue of some source material being able to be derived from this par-ticular portion of the top lower mantle (Allegre and Turcotte, 1985; White and McKenzie, 1989; Fittonet al., 1997). In this paper we will illustrate that secondary upper-mantle plumes emanating from a primary lower-mantle plume, as suggested previously (Maruyama, 1994), are indeed dynamically fea-sible. Here we hope to convey to researchers in otherfields the different possibilities of dynamical mesoscale features in the transition zone, which would help them to interpret better their own data.
2.
Description of the 2-D and 3-D Models
To study the dynamics of mantle flow in the transition zone, we have employed two different types of models: (1) a two-dimensional axisymmetric, spherical-shell model and (2) a three-dimensional Cartesian model with an aspect-ratio of 4×4×1, with unity being the depth. With model (1) we can investigate closely the interaction between the mesoscale
flow from the transition zone in the presence of the global circulation. On the other hand, for examining the birth of small-scale plumes and downwellings in the transition zone, we have employed model (2) which is a local Cartesian model in 3-D with high spatial resolution.
2.1 Two-dimensional spherical-shell model
The 2-D spherical-shell model is based on the extended-Boussinesq approximation (Christensen and Yuen, 1985; Steinbachet al., 1989) in which the background density is constant and has two phase transitions built-in at 400 and 660 km depth with the enhanced thermal expansivity ap-proach for simulating the effects of phase transitions (Christensen and Yuen, 1985). The phase transitions are the olivine to spinel and the spinel to perovskite transition with the respective Clapeyron slopes of+3 MPa/K and−3 MPa/K and density changes of 8% and 10%. The radius of the Earth is set to be 6380 km and the radius of the core to 3480 km. A depth-dependent background thermal expansivity, which decreases by a factor of 5 across the mantle (Chopelas and Boehler, 1992), is employed. An analytical form of this ther-mal expansivity can be found in Steinbach and Yuen (1994).
The thermal conductivity is constant. The dimensionless sur-face temperatureT0is 0.2 and the surface dissipation number
is 0.4. A depth-dependent viscosityηtakes the dimension-less form:
denotes an average over the latitude. In the lower mantle A takes the form:
jump across the 660 km discontinuity, A0, andA1are
rheo-logical parameters. The form of the upper mantle viscosity is not varied and the jump in viscosityηtakes place at the 660 km boundary (see Fig. 1(a)). The dimensionless surface temperature T0, here taken to be 0.2. And F(z), applying
only in the lower mantle, is
F(z)=1
andd, the width of the interface zone situated at 660 km depth, is taken to be 20 km.
This form of the rheology is similar to that employed in van Keken and Yuen (1995) and Steinbach and Yuen (1998). Values of A0andA1are chosen such that a decrease of
vis-cosity by a factor of 10,000 due to the temperature difference across the mantle alone and a factor of 40 increased due to the depth dependence of the viscosity from 660 km depth to the core-mantle boundary (CMB).
We have employed the stream-function and temperature formulation for solving the momentum and energy equa-tions. The momentum equation is given by a fourth-order bi-harmonic equation in polar coordinates with the Rayleigh number being the control variable governing the buoyancy driving force, while the energy equation is a second-order partial differential equation in space andfirst-order in time with both the adiabatic and viscous heating terms included. Except for one case, there is no internal heating. The la-tent heat term in phase transition is simulated by the en-hanced thermal expansivity in the adiabatic heating term. The sudden increase in the buoyant forces during a phase transition is modelled by the enhanced thermal expansiv-ity (Christensen and Yuen, 1985) in the thermal buoyancy term in the bi-harmonic momentum equation. The equations can be found in Breueret al.(1997). A sixth-orderfi nite-difference method (Fornberg, 1990) has been employed. A description of this discretization scheme as applied to both two- and three-dimensional convection problems can be found in Larsenet al.(1997). In this study we have employed 160 points in the radial direction and 550 points along the tangential direction for the spherical-shell model. Table 1 summarizes the characteristics and physical parameters for the 2-D and 3-D models.
2.2 Three-dimensional Cartesian model
Fig. 1. Viscosity profiles used in the modelling: (a) The formula is given in Eq. (1) for this horizontally averaged temperature-dependent and depth-dependent viscosity andηrepresents the viscosity jump at 660 km depth. This viscosity is used in the 2-D axisymmetric model. (b) The viscosity profile with two low viscosity zones used in the 3-D Cartesian model.
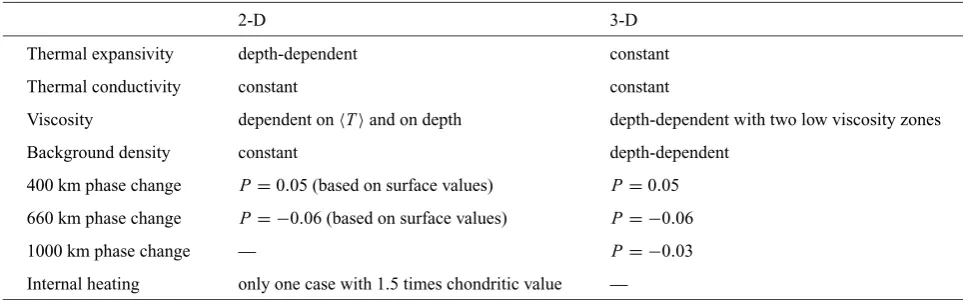
Table 1. Physical properties of the two models.
2-D 3-D
Thermal expansivity depth-dependent constant
Thermal conductivity constant constant
Viscosity dependent onTand on depth depth-dependent with two low viscosity zones
Background density constant depth-dependent
400 km phase change P=0.05 (based on surface values) P=0.05
660 km phase change P = −0.06 (based on surface values) P= −0.06
1000 km phase change — P= −0.03 Internal heating only one case with 1.5 times chondritic value —
in which the background density is a function of depthz. The viscosity is strictly depth-dependent (see Fig. 1(b) below). The effective thermal expansivity and compressibility vary strongly in the depth interval where each phase change oc-curs. The 3-D equations for thermal convection are solved by the poloidal potential, which automatically satisfies the con-tinuity equation, and the temperature approach. The momen-tum equation for the poloidal potentialis a bi-harmonic equation (e.g. Travis et al., 1990) in which the inhomoge-neous forcing terms contain both the thermal and phase tran-sitional buoyant forces, while the energy equation is a partial differential equation forT in time and space (Cserepeset al., 1988). The latent heat is treated in the same way as for the two-dimensional formulation, i.e. in the enhanced ther-mal expansivity. Also included are the adiabatic and viscous heating contributions. The background thermal expansivity, however, is a constant for the 3-D model, as is the thermal conductivity. A surface temperatureT0of 0.1 is used along
with a dissipation numberDof 0.5. The background density variation is given by
ρ=exp
Dz γ
exp
k
ρ
ρ
k χk
(4)
where γ is the Grueneisen parameter, taken to be 1.4, (ρ/ρ)k is the relative density jump across the kth phase change and χk is the phase function (e.g. Christensen and Yuen, 1985) in thekthtransition zone. See Table 1 for
addi-tional details.
this hypothetical phase transition at 1000 km to study its potential effects, acting in concert with the second astheno-sphere, in producing mesoscaleflows beneath the 660 km discontinuity. At the same time, this transition can also rein-force layering so that secondary plumes can be produced in the transition zone. The viscosity profile, shown in Fig. 1(b), has a low viscosity channel between 100 and 250 km and a second low viscosity channel between 660 and 1000 km depth. From 1000 km to the CMB, the viscosity increases exponentially by two orders in magnitude.
The momentum and energy equations have been solved nu-merically by a combined second-orderfinite-difference (ver-tical) and spectral (horizontal directions) method (Cserepes et al., 1988). For further details concerning the equations, we refer the reader to Cserepes and Yuen (1997) and Cserepes et al.(1998). The grid 3-D configuration used consists of 320×320×160 points. Such a large grid is needed to cap-ture all of the multiple-scale feacap-tures produced within the complicated region between 660 and 1000 km depth. By putting enough points across this region, we can resolve the small secondary plumes developing there.
3.
Results
In this section we will present results taken from both the axisymmetric (2-D) spherical-shell and the 3-D Cartesian models. These high-resolution simulations will aim to illus-trate the different facets of the mesoscale dynamics generated in the transition zone and the region immediately below. 3.1 Axisymmetric (2-D) spherical-shell model
We begin with a case in which the averaged Rayleigh num-ber of the purely basally heated spherical-shell system is 5×10⁶. The averaged Rayleigh number is defined on the
basis of the averaged viscosity and surface value of the other physical parameters. There is no viscosity contrast across the 660 km discontinuity. The run has been started from a case without the two phase transitions. About 80,000 timesteps (about 5 overturns in the upper mantle) have been taken to reach a statistically steady-state situation. Figure 2 shows a global shot along with a sequence of zoomed-in view of the plume-plume collision process (panel 1 and 2), leading to a laterally spreading hot region under the 660 km discon-tinuity. A rising secondary instability is observed in both panel 4 and the global shot at the bottom of Fig. 2. In panel 4 one also sees the juxtaposition of cold descending sheet overlying the hot spreading wings of the plume. Thus near the 660 km discontinuity a shearflow develops between the cold and hot boundary layers, which come respectively from the upper- and lower-mantle. Because of the nature of the horizontally averaged temperature-dependent viscosity (see Eq. (1)), there is no low viscosity zone developed under the 660 km discontinuity. We note from the bottom panel in Fig. 2 that in this Rayleigh number regime the style of man-tle convection is not strictly layered. In some regions there is mass circulation through the 660 km phase change in the downwelling. The hot upwelling is blocked more by the 660 km phase change at this time instant.
The next case has a viscosity jump of a factor of 5 across the 660 km discontinuity. Figure 3 shows the case in which a viscosity contrast of 5 has been imposed across the tran-sition. The averaged Rayleigh number is now decreased to
2×10⁶. The lower mantle plumes become thicker and there is
a more violent interaction between the plume and the 660 km phase transition than for the case without the viscosity jump (Fig. 3). This nonlinear amplification mechanism is due to the viscosity jump (van Kekenet al., 1992). This process is further enhanced by the release of latent heat from the per-ovskite to spinel transition and by the enhancement in the upward buoyancy during the phase transition of the denser to lighter phase. Again we note from the bottom panel that the style of mantle convection is not wholly layered. In some regions penetration of theflow across the 660 km boundary is easier.
Figure 4 shows the case with a viscosity jump of 20 im-posed across the 660 km discontinuity. The averaged Rayleigh number decreases now to 3×10⁵. There is now a
difference of more than an order in magnitude between the averaged Rayleigh number in the upper mantle and that in the lower mantle. This disparity in the Rayleigh numbers of the two systems causes a separation of scales between the upper and lower mantle convectiveflows. The lower mantle features become much greater in size, especially the large plumes. The plume widths are reduced upon crossing the 660 km, because of the reduction by twenty fold in the vis-cosity. This gives rise to small scale instability rising at the edge of the wing of the plume (panel 1 and 2). We observe again there is a sharp thermal contrast between the horizon-tal cold boundary layer coming from a descending current in the upper mantle and the hot boundary layer from the bent lower-mantle plume. We note that the dark region near the bottom of the polar plume (bottom panel) has very high tem-perature, exceeding that at the CMB, thus suggesting some melting there (Helmbergeret al., 1998). This local build-up of the temperature comes from the long-lasting viscous heating at the base of a relatively stationary plume.
Viscous dissipation yields important information about the thermo-mechanical state of mantleflow, whether or not some regions are severely deformed, as in the plume impingement process. From the viscosity distributionηand viscous dissi-pationfieldF, one can calculate the second-invariant of the stressfieldτ, with the relationshipτ =√ηF. The second-invariant of the stress tensor is a valuable diagnostic quantity for revealing the potential of seismic anisotropy induced by mantleflow (Ribe, 1992). Figure 5 shows the viscous dis-sipation distribution of the global frame shown in Fig. 4. Most of the dissipation takes place in the plume along the polar axis, since the polar region is the site for 3-D type of deformation, which produces much greater amount of dis-sipation than for motions off the polar axis. Strong viscous heating is observed near the 660 km discontinuity and also at the bottom of the plumes, which can help to cause local-ized melting at the base of plumes near the CMB (Garnero and Helmberger, 1996; Helmbergeret al., 1998; Wen and Helmberger, 1998). Values of viscous heating surpassing 500 corresponds to around 50 times the chondritic heating value. With a greater contrast in the temperature-dependent viscosity, larger shear heating rates can be expected (Thomp-son and Tackley, 1998).
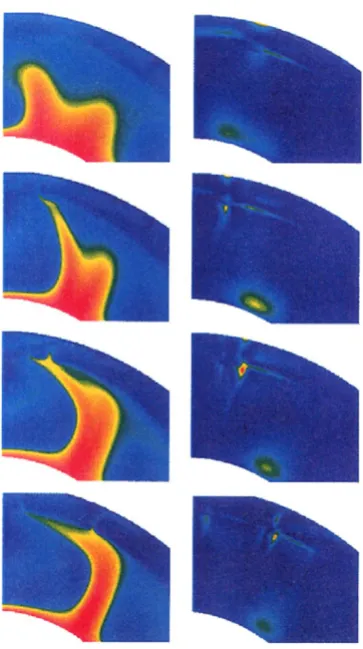
non-Fig. 2. Temperaturefields of axisymmetric spherical shell convection with two phase transitions and a temperature- and pressure-dependent vis-cosity under the extended Boussinesq approximation. A sixth-orderfi -nite-difference method has been employed. Viscosity is given in Fig. 1(a). Five snapshots in sequence are shown with the global shot representing thefinal view. Time intervals are 4 million years between the frames. The averaged Rayleigh number of the entire system is about 5×10⁶. There is no internal heating.
Fig. 3. The same as for Fig. 2 except there is a viscosity jump of a factor of 5 at the 660 km discontinuity. Time intervals are around 2 million years apart. The averaged Rayleigh number is around 2×10⁶.
linear feedback between internal-heating and viscous dissi-pation, which further enhanced the plume strength. These models did not include any phase transitions. In Fig. 6 we show a sequence of the zoomed-in snapshots of the temper-ature and viscous heatingfields of an internally heated case (strength being 1.5 times the chondritic radioactive abundance) with a viscosity jump of 20 across the 660 km dis-continuity. The basal heating and internal heating averaged Rayleigh numbers are respectively 4×10⁵and 8×10⁶. The
Fig. 4. The same as for Fig. 2 except there is a viscosity jump of a factor of 20 across the endothermic phase change. Time intervals are around 1.5 million years apart. The averaged Rayleigh number is 3×10⁵.
time sequence is from top to bottom. We observe that there is a large megaplume developed in the lower mantle, which rises toward the 660 km phase change and is then deflected. Secondary rising instabilities are produced by the interaction of the large plume with the endothermic phase change. There can be a large separation, more than 1600 km, between the major plume under the lower mantle and the surface hotspot produced by the secondary plume (bottom row). Maximum peaks of viscous heating (right column) can be found at the bottom of the lower-mantle plume, under the transition zone and right under the lithosphere. At all of these sites it is conceivable that one mayfind significant amounts of stress focusing and perhaps some traces of seismic anisotropy de-veloped.
3.2 Three-dimensional Cartesian model
Previous results of this Cartesian model with one endother-mic phase transition and two low viscosity zones can be found in Cserepes and Yuen (1997). This particular 3-D model, which we will focus here, is a new result. It is heated from below (i.e. no internal heating) and has two low viscosity zones and three phase transitions, one exothermic at 400 km depth and the other two exothermic transitions at 660 and 1000 km depth. This model at a surface Rayleigh number of 2×10⁷was started from an already convecting solution with
2 phase transitions and 2 low viscosity zones (Cserepeset al., 1998) and was integrated in time, until the solution became statistically steady-state. We proceed now to examine vari-ous aspects of this 3-Dflow, going from the global view to detailed images of the secondary plumes in the upper man-tle. The multiplicity of spatial scales in theflow demands this kind of detailed and high-resolution scientific visuali-zation.
Fig. 5. The viscous heating distribution associated with the last (global) frame in Fig. 4. Regions of intense viscous heating are shown by the localized features in the transition zone by the plume impingement and at the bottom of the lower mantle upwellings near the CMB.
Fig. 6. The zoomed-in views of both the temperature of a large lower-mantle upwelling (left) and the associated shear-heating distribution (right). The case has the same viscosity jump of a factor of 20 as in Fig. 4 but has an internal heating strength, which is 1.5 times the chondritic radioactive heating value.
that the many plumes emanate from the 660 km surface but none come directly from the lower mantle. These plumes are supported by afinite temperature increase across the 660 km phase transition. Some of these plumes, which are situated in the rear of the box, are hotter than others, as shown by the second isosurface (T =0.5) almost reaching the surface. The close-up views of two of these strong plumes are dis-played in Fig. 8. Here one can discern the different degree of upward penetration by theT =0.5 isosurface, embedded within the T = 0.3 surface, which delineates the general shape of the rising secondary plume in the upper mantle.
Fig. 8. Zoomed-in views of two different upwellings originating from the 660 km discontinuity. The two temperature isosurfaces represent
T = 0.3 (outer surface) andT = 0.5 (inner surface). The hot inner column represents material drawn directly from the second asthenosphere under the 660 km discontinuity. There is a pool of hot mass withT=0.5 right under the spinel-perovskite phase change. Same time frame as in Fig. 7.
Fig. 9. Zoomed-in view of the transition zone region between 660 and 1000 km. Here one notices that small sinking instabilities (top panel) are associated with theT =0.3 surface, as contrasted with the upwelling carrying the same temperature value upwards in the bottom panel. The plume in the background with the two isosurfaces is the same plume in the bottom panel of Fig. 7. Same time step as in Fig. 7.
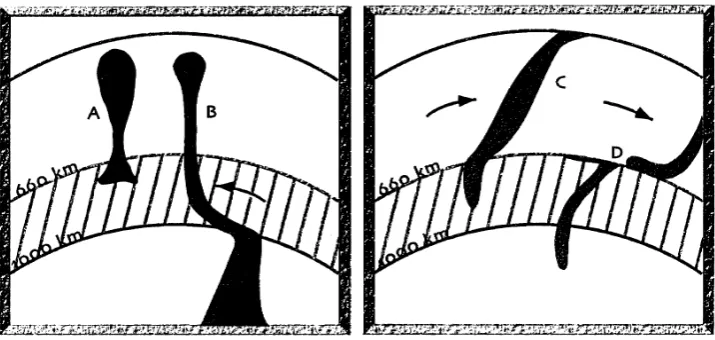
Fig. 11. Schematic diagram summarizing the different mesoscale features involving both upwelling (A and B) and downwelling (C and D) features. Plume deflection may be facilitated by the presence of a second low viscosity zone, which induces a channelflow. The hatched region marks the locale of interest, right below the proverbial 660 km discontinuity.
In Fig. 9 we show two snapshots, which reveal the small-scale downwellings (withT =0.3) penetrating into the sec-ond asthenosphere. One notices that the same temperature (T =0.3) can be associated with an upper-mantle plume or with a downwelling into the shallow part of the lower mantle. This phenomenon reflects the nature of the internal thermal boundary layer developed at 660 km depth in certain regions. Some of these downwellings can merge in the second LVZ, to form a bigger downwelling, which then can penetrate into the lower mantle deeper than 1000 km.
At times the secondary plume can erupt in a spectacular fashion, as shown by the snapshots in Fig. 10, taking from different angles. We note especially that the large plume head produced by this burst has a diameter near the surface, which exceeds 2000 km. This type of large-scale plume eruption is not due to deep mantle plumes, but rather is caused by an instability in the transition zone from an earlierflushing event. This process sent forth a large pool of cold material with T = 0.3 into the deep lower mantle. In this sense, the origin of this plume instability is different from the sec-ondary instability shown above for the spherical-shell model (see Figs. 2 to 6), which does not have a low viscosity zone nor a phase transition at 1000 km depth for trapping both cold and hot material there. We note that the cylindrical form of the 3-D instability enables more hot material to be brought up than by the sheet-like upwellings in 2-D models (Steinbach and Yuen, 1997). Thus the potential presence of a second LVZ and a deeper phase transition would generate a whole new suite of multiscale features in the mid-mantle with dynamical consequences for both the upper-mantle and deep lower-mantle. Recently we have found that the same phenomenon of plumes developing right under the 660 km phase change can also take place just with the presence of the second asthenosphere (Cserepes and Yuen, 1998) and without the phase transition at 1000 km.
We have provided a detailed visualization display of the dynamical features found in mantle convection with phase transitions and different viscosity structures. Previous stud-ies of 3-D mantle convection with phase transitions (Honda
et al., 1993; Tackleyet al., 1993, 1994; Yuenet al., 1994a) did not focus into the dynamics at the transition zone because of the coarser spatial resolution than thefine grid employed here for both the 2-D and 3-D calculations. In these previous models (e.g. Tackleyet al., 1993; Hondaet al., 1993) no mas-sive gushing events were found because there were no second low viscosity zones imposed. The presence of a low viscos-ity zone under the 660 km boundary offers such possibilities. Indeed there is a window in the parameter space of Rayleigh number in which such massive plume events coming from the shallow lower mantle are feasible, as this phenomenon was not detected previously by Cserepes and Yuen (1997), who have imposed a second low-viscosity zone into their model. Increasing the magnitude of the viscosity well in the second asthenosphere would enhance the likelihood for producing these types of shallow lower-mantle plumes. We emphasize here that sufficient grid points, at least 30 to 40, are required in the transition zone for detecting the multiscale secondary instabilities arising from an internal thermal boundary layer in a layered convective system with a second low viscosity zone at high Rayleigh number.
phase boundary. With the 3-D model we have studied the influences from the presence of a low viscosity zone and an additional weaker endothermic phase change at 1000 km depth. Both models indeed reveal the wide complexity to be encountered in both the upwellingflows and the descending currents.
The 2-D axisymmetric model has demonstrated that the upwellings can be bent by their shear interaction with the endothermic phase transition at 660 km and that diapiric up-wellings can develop some distance away from the lower-mantle large plume. Recent high-resolution tomographic reconstruction by Bijwaardet al.(1998) and Bijwaard and Spakman (1998) have indeed revealed the bent nature of the plume in the lower mantle under Iceland with a diameter of around 500 km. Furthermore, their images show that the upwellings in the upper mantle do not align exactly with the lower-mantle plume.
A low-viscosity zone under the 660 km discontinuity fa-vors the formation of many plumes with origins in the tran-sition zone, because of its tendency to cause decoupling be-tween the upper and deep mantle circulation, which results in the formation of an internal thermal boundary layer. In a system with a large surface Rayleigh number but an in-creasing viscosity in the lower mantle, the plumes developed in the lower mantle are large and stationary and they may be deflected at the 660 km discontinuity. Secondary plumes may then arise upward from the transition zone at some hori-zontal distance away from the lower-mantle plume. In some sense, the second low viscosity zone serves as a thoroughfare under the 660 km discontinuity for transporting hot material laterally in a rapid fashion. This scenario accords well with the ideas of plume tectonics based on geological arguments (Maruyama, 1994). Mantle plumes, which originate at the thermal boundary layer associated with the 660 km discon-tinuity, can entrain shallow lower mantle material into its central portion (see A in Fig. 11). Geochemical data (Fitton et al., 1997) have argued for the Icelandic plume to have origins at the transition zone. Geochemical evidence, es-pecially that derived from noble gases, favors some type of layered convection but one in which the layers are not com-pletely isolated (Hofmann, 1997). The history of deep man-tle plume activities may well have been episodic and linked to theflushing event involving an unusually large instability as in the Cretaceous period (Maruyama, 1994; Yuenet al., 1994b). The question concerning the depth of origin of hot upwellings can be posed for the Hawaiian plume in the upper
shown in Fig. 10 has a diameter of well over 2000 km. Alter-natively, ultrafast plumes (Larsen and Yuen, 1997) can also explain the synchroneity of the volcanism caused by the enor-mous Icelandic plume around 63 Ma ago. Such a large di-mension of the plume would be not possible from steady-state boundary layer predictions (Olson and Corcos, 1980) or from starting plume models (e.g. Griffiths and Campbell, 1990), where there is no available reservoir of trapped material. This megaplume burst is afluid-dynamical manifestation of what is known in physics as a threshold process, as found in the percolation phenomenon (e.g. Stauffer and Aharony, 1991). This non-linear process causes a sudden upward discharge of the accumulated hot material, which has been trapped in the region between the 660 km discontinuity and the base of the second asthenosphere. One can regard this second low-viscosity zone as a potentially important geochemical reservoir, sampled by such a gushing event. This spectacular outpouring phenomenon is intrinsically nonlinear in nature and is somewhat akin to the flushing instability involving massive amounts of cold material descending into the lower mantle (Tackleyet al., 1993; Hondaet al., 1993; Solheim and Peltier, 1994). A two-dimensional Cartesian version of this massive upwelling of hot material from the lower to the upper mantle has also been found by Steinbach and Yuen (1998). In this regard, the second asthenosphere plays the analogous role of a non-linear capacitor in storing up hot lower-mantle material, which is poised for a rapid takeoff upwards upon an excitation by an external perturbation, either by deep mantle plumes or by nearby cold downwellings able to sink into deep lower mantle. More work is still needed to delve into this tantalizing issue of the underlying physical mechanism for dispatching large amounts of hot material from the shallow lower mantle to the upper mantle. Important effects, such as internal heating and lateral variations of the viscosity, should be studied in the future.
In the Pacific region the upper mantle and transition zone under the Ontong-Java plateau offer an excellent venue for such a long-term study of the thermal-mechanical structure in the top portion of the lower mantle. The observation sites of the OHP project can be gainfully employed for this purpose. Both the seismic and electrical conductivity studies will be extremely useful in this endeavor of studying the mid-mantle structure in the western Pacific, between 660 and around 1200 km depth.
committee of OHP for inviting him to the OHP symposium. Stimu-lating discussions about megaplumes and internal thermal boundary layers with Shige Maruyama, Tetsu Seno, Motoyuki Kido and Wal-ter Mooney are gratefully acknowledged. Comments from the three reviewers and Alex Forte have helped to improve this manuscript. He also thanks Jerry Schubert for a conversation about plumes from the 660 km discontinuity and Josh Collins for technical assistance. This research has been supported by the Hungarian National grant OTKA T015966, the geophysics program of the National Science Foundation and the J.S.P.S. Brigit A. Schroeder thanked E.R.I., Univ. Tokyo for support during her visit to Japan in 1996 and N.S.F. for a REU award in summer of 1997.
References
Allegre, C. J., Limitation on the mass exchange between the upper and lower mantle: the evolving convection regime of the Earth,Earth Planet. Sci. Lett.,150, 1–6, 1997.
Allegre, C. J. and D. L. Turcotte, Geodynamic mixing in the meso-sphere boundary layer and the origin of oceanic islands,Geophys. Res. Lett.,12, 207–210, 1985.
Bercovici, D. and J. Mahoney, Doubleflood basalts and plume head separa-tion at the 660-kilometer discontinuity,Science,266, 1367–1369, 1994. Bijwaard, H. and W. Spakman, Tomographic evidence for a narrow whole mantle plume below Iceland,Earth Planet. Sci. Lett., 1998 (in press). Bijwaard, H., W. Spakman, and E. R. Engdahl, Closing the gap between
regional and global travel time tomography,J. Geophys. Res., 1998 (in press).
Birch, F., The earth’s mantle: elasticity and constitution,Trans. Am. Geo-phys. Union,35, 79–85, 1954.
Breuer, D. and T. Spohn, Possibleflush instability in mantle convection at the Archaean-Proterozoic transition,Nature,378, 608–610, 1995. Breuer, D., D. A. Yuen, and T. Spohn, Phase transitions in the Martian
mantle: Implications for partially layered convection,Earth Planet. Sci. Lett.,148, 457–469, 1997.
Brunet, D. and P. Machetel, Large-scale tectonic features induced by man-tle avalanches with phase, temperature and pressure lateral variation of viscosity,J. Geophys. Res.,103, 4929–4945, 1998.
Bunge, H.-P. and M. A. Richards, The origin of large scale structure in mantle convection: effects of plate motions and viscosity stratification,
Geophys. Res. Lett.,23, 2987–2990, 1996.
Cadek, O., H. Ciskova, and D. A. Yuen, Can long-wavelength dynamical signatures be compatible with layered convection?,Geophys. Res. Lett.,
24, 2091–2094, 1997.
Castle, J. C. and K. C. Creager, Topography of the 660-km seismic dis-continuity beneath Izu-Bonin: Implications for tectonic history and slab deformation,J. Geophys. Res., 1998 (in press).
Chalmers, J. A., L. M. Larsen, and L. Pedersen, Widespread Paleocene volcanism around the northern Atlantic and Labrador Sea: evidence for a large, hot, early plume head,J. Geol. Soc., London,152, 965–969, 1995. Chopelas, A. and R. Boehler, Thermal expansivity of the lower mantle,
Geophys. Res. Lett.,19, 1983–1986, 1992.
Christensen, U. R., The influence of trench migration on the slab penetration into the lower mantle,Earth Planet. Sci. Lett.,140, 27–39, 1996. Christensen, U. R. and D. A. Yuen, Layered convection induced by phase
transitions,J. Geophys. Res.,90, 10,291–10,300, 1985.
Cizkova, H. and O. Cadek, Effect of a viscosity interface at 1000 km depth on mantle convection,Studia geoph. et geod.,41, 297–306, 1997. Cserepes, L. and D. A. Yuen, Dynamical consequences of mid-mantle
vis-cosity stratification on mantleflows with an endothermic transition, Geo-phys. Res. Lett.,24, 181–184, 1997.
Cserepes, L. and D. A. Yuen, Mantle plumes developing in a second low viscosity zone below the 660 km discontinuity, A.G.U. abstract, Fall meeting, 1998.
Cserepes, L., M. Rabinowicz, and C. Rosemberg-Borot, Three-dimensional infinite Prandtl number convection in one or two layers with implications for the Earth’s gravityfield,J. Geophys. Res.,93, 12,009–12,025, 1988. Cserepes, L., D. A. Yuen, and B. A. Schroeder, Effects of the mid-mantle viscosity and phase-transition structure on 3-D mantle convection,Phys. Earth Planet. Inter., 1998 (submitted).
Davies, G. F., Penetration of plates and plumes through the mantle transition zone,Earth Planet. Sci. Lett.,133, 507–516, 1995.
Fitton, J. G., A. D. Saunders, M. J. Norry, B. S. Hardarson, and R. N. Taylor, Thermal and chemical structure of the Iceland plume,Earth Planet. Sci. Lett.,153, 197–208, 1997.
Fornberg, B., High-orderfinite differences and the pseudospectral method on staggered grids, S.I.A.M.,J. Numer. Anal.,27, 904–918, 1990. Forte, A. M., R. L. Woodward, and A. M. Dziewonski, Joint inversions of
seismic and geodynamic data for models of three-dimensional mantle heterogeneity,J. Geophys. Res.,99, 21875–21897, 1994.
Garnero, E. J. and D. V. Helmberger, Seismic detection of a thin laterally varying boundary layer at the base of the mantle beneath the central-Pacific,Geophys. Res. Lett.,23, 977–980, 1996.
Griffiths, R. W. and I. H. Campbell, Stirring and structure in mantle starting plumes,Earth Planet. Sci. Lett.,99, 66–78, 1990.
Griffiths, R. W., R. I. Hackney, and R. D. van der Hilst, A laboratory inves-tigation of effects of trench migration on the descent of subducted slabs,
Earth Planet. Sci. Lett.,133, 1–17, 1995.
Guillou-Frottier, L., J. Buttles, and P. Olson, Laboratory experiments on the structure of subducted lithosphere,Earth Planet. Sci. Lett.,133, 19–34, 1995.
Helmberger, D. V., L. Wen, and X. Ding, Seismic evidence that the source of the Iceland hotspot lies at the core-mantle boundary, Nature, 396, 251–255, 1998.
Hofmann, A. W., Mantle geochemistry: the message from oceanic volcan-ism,Nature,385, 219–229, 1997.
Honda, S., D. A. Yuen, S. Balachandar, and D. Reuteler, Three-dimensional instabilities of mantle convection with multiple phase transitions,Science,
259, 1308–1311, 1993.
Irifune, T., T. Koizumi, and J. Ando, An experimental study of the garnet-perovskite transformation in the system MgSiO3-Mg3Al2Si3O12,Phys. Earth Planet. Inter.,96, 147–157, 1996.
Jarvis, G. T. and D. P. McKenzie, Convection in a compressiblefluid with infinite Prandtl number,J. Fluid Mech.,96, 515–583, 1980.
Karato, S., Seismic anisotropy in the deep mantle, boundary layers and the geometry of mantle convection,Pure Appl. Geophys.,151, 565–587, 1998.
Kawakatsu, H. and F. Niu, Seismic evidence of a 920-km discontinuity in the mantle,Nature,371, 301–305, 1994.
Kesson, S. E., J. D. Fitz Gerald, J. M. G. Shelley, and R. L. Withers, Phase relations, structure and crystal chemistry of some aluminous silicate per-ovskites,Earth Planet. Sci. Lett.,134, 187–201, 1995.
Kido, M. and O. Cadek, Inferences of viscosity from the oceanic geoid: Indication of a low viscosity zone below the 660-km discontinuity,Earth Planet. Sci. Lett.,151, 125–138, 1997.
Kido, M., D. A. Yuen, O. Cadek, and T. Nakakuki, Mantle viscosity derived by genetic algorithm using oceanic geoid and seismic tomography for whole-mantle versus blocked-flow situation,Phys. Earth Planet. Inter.,
107, 307–326, 1998.
Larsen, T. B. and D. A. Yuen, Ultra-fast upwelling bursting through the upper mantle,Earth Planet. Sci. Lett.,146, 393–400, 1997.
Larsen, T. B., D. A. Yuen, J. Moser, and B. Fornberg, A higher-orderfi nite-difference method applied to large Rayleigh number mantle convection,
Geophys. Astrophys. Fluid Dyn.,84, 53–83, 1997.
Le Stunff, Y., C. W. Wicks, and B. Romanowicz, P’P’precursors under Africa: evidence for mid-mantle reflectors,Science,270, 74–77, 1995. Liu, M., D. A. Yuen, W. Zhao, and S. Honda, Development of diapiric
structures in the upper mantle due to phase transitions,Science,252, 1836–1839, 1991.
Maruyama, S., Plume tectonics,J. Geol. Soc. Japan,100, No. 1, 24–49, 1994.
Montagner, J. P. and B. L. N. Kennett, How to reconcile body-wave and normal-mode reference earth models,Geophys. J. Int.,125, 229–248, 1996.
Nakakuki, T., D. A. Yuen, and S. Honda, The interaction of plumes with the transition zone under continents and oceans,Earth Planet. Sci. Lett.,
146, 379–392, 1997.
Niu, F. and H. Kawakatsu, Depth variation of the mid-mantle seismic dis-continuity,Geophys. Res. Lett.,24, 429–432, 1997.
O’Neill, B. and R. Jeanloz, MgSiO3-FeSiO3-Al2O3 in the Earth’s lower
mantle: Perovskite and garnet at 1200 km depth,J. Geophys. Res.,99, 19,901–19,915, 1994.
Obayashi, M., T. Sakurai, and Y. Fukao, The 3-D structure of the mantle from travel time inversion,J. Geography,104, No. 7, 934–940, 1995 (in Japanese).
Olbertz, D., M. J. R. Wortel, and U. Hansen, Trench migration and subduc-tion zone geometry,Geophys. Res. Lett.,24, 221–224, 1997.
Steinbach, V. and D. A. Yuen, Effects of depth-dependent properties on the thermal anomalies produced inflush instabilities from phase transitions,
Phys. Earth Planet. Inter.,86, 165–183, 1994.
Steinbach, V. and D. A. Yuen, The influences of temperature- and pressure-dependent lower-mantle rheology on the interaction of upwellings with phase transitions,Phys. Earth Planet. Inter.,103, 85–100, 1997. Steinbach, V. and D. A. Yuen, The influences of surface temperature on
upwellings in planetary convection with phase transitions,Earth Planet. Sci. Lett.,160, 1998.
Steinbach, V., U. Hansen, and A. Ebel, Compressible convection in the earth’s mantle: a comparison of different approaches,Geophys. Res. Lett.,16, 633–635, 1989.
Steinbach, V., D. A. Yuen, and W. Zhao, Instabilities from phase transitions and the timescales of mantle evolution,Geophys. Res. Lett.,20, 1119–
1122, 1993.
Tackley, P. J., D. J. Stevenson, G. A. Glatzmaier, and G. Schubert, Effects of an endothermic phase transition at 670 km depth on spherical mantle convection,Nature,361, 699–704, 1993.
Tackley, P. J., D. J. Stevenson, G. A. Glatzmaier, and G. Schubert, Effects of multiple phase transitions in a three dimensional spherical model of convection in Earth’s mantle,J. Geophys. Res.,99, 15,877–15,902, 1994. Thompson, P. F. and P. J. Tackley, Generation of mega-plumes from the core-mantle boundary in a compressible core-mantle with temperature-dependent viscosity,Geophys. Res. Lett.,25, 1999–2002, 1998.
Travis, B., P. Olson, and G. Schubert, The transition from two-dimensional
1998.
White, R. and D. P. McKenzie, Magmatism in rift zones: the generation of volcanic continental margins andflood basalts,J. Geophys. Res.,94, 7685–7729, 1989.
Widiyantoro, S., Studies of seismic tomography on regional and global scale, Australian National University, 246 pp., 1997.
Widiyantoro, S. and R. D. van der Hilst, Structure and evolution of litho-spheric slab beneath the Sunda Arc,Science,271, 1566–1570, 1996. Yuen, D. A., D. M. Reuteler, S. Balachandar, V. Steinbach, A. V. Malevsky,
and J. L. Smedsmo, Various influences on three-dimensional mantle con-vection with phase transitions,Phys. Earth Planet. Inter.,86, 185–203, 1994a.
Yuen, D. A., O. P. Cadek, R. Boehler, J. Moser, and C. Matyska, Large cold anomalies in the deep mantle and mantle instability in the Cretaceous,
Terra Nova,6, 238–245, 1994b.
Zhang, S. and D. A. Yuen, Various influences on plumes and dynamics in time-dependent, compressible, mantle convection in 3-D spherical shell,
Phys. Earth Planet. Inter.,94, 241–267, 1996.
Zhou, H.-W., A high-resolution P wave model for the top 1200 km of the mantle,J. Geophys. Res.,101, 27,791–27,810, 1996.