P R O C E E D I N G S
Open Access
Use of Bayesian networks to dissect the
complexity of genetic disease: application to the
Genetic Analysis Workshop 17 simulated data
Jia Kang
1,4, Wei Zheng
2,4, Lun Li
2,3,4, Joon Sang Lee
2,4, Xiting Yan
2,4, Hongyu Zhao
1,2,4*From
Genetic Analysis Workshop 17
Boston, MA, USA. 13-16 October 2010
Abstract
Complex diseases are often the downstream event of a number of risk factors, including both environmental and genetic variables. To better understand the mechanism of disease onset, it is of great interest to systematically investigate the crosstalk among various risk factors. Bayesian networks provide an intuitive graphical interface that captures not only the association but also the conditional independence and dependence structures among the variables, resulting in sparser relationships between risk factors and the disease phenotype than traditional correlation-based methods. In this paper, we apply a Bayesian network to dissect the complex regulatory
relationships among disease traits and various risk factors for the Genetic Analysis Workshop 17 simulated data. We use the Bayesian network as a tool for the risk prediction of disease outcome.
Background
Recent genome-wide association studies have identified many DNA variants (e.g., single-nucleotide polymorph-isms [SNPs]) that affect complex human diseases. How-ever, because currently identified genetic variants collectively explain only a small proportion of disease phe-notypic variance [1,2], it is important to consider not only genetic factors but also various environmental variables, such as sex, age, and smoking for disease etiology. There-fore it is of great interest to delineate how the complex interactions among the environmental variables, genetic factors, and quantitative traits such as gene expressions lead to disease outcome.
Inferring the dependency structures for multiple inter-acting quantities is a challenging task, however. Without sophisticated analysis tools, it is difficult to discern condi-tional independence from dependence of two variables in the data. Bayesian networks are a promising tool for this purpose. First, they provide useful information that describes processes composed of locally interacting
components. Second, statistical foundations for learning Bayesian networks from observations and computational algorithms to do so are well developed and have been used successfully in many applications. Finally, although Bayesian networks are mathematically defined strictly in terms of probabilities and conditional independence state-ments, a connection can be made between this characteri-zation and the notion of direct causal influence [3-6].
By definition, a Bayesian network is a representation of a joint probability distribution, which consists of two com-ponents:E, which is a directed acyclic graph (DAG) whose vertices correspond to the random variablesX1, …, Xn;
andθ, which describes a conditional distribution for each variable, given its parents inE. Together, these two com-ponents specify a unique distribution onX1,…,Xn. The
graphErepresents conditional independence assumptions that allow the joint distribution to be factorized, econo-mizing the number of parameters. The graphEencodes the Markov assumption, which states that each variableXi is independent of its nondescendants, given its parents in E[6].
To fully specify a joint distribution, we also need to specify each of the conditional probabilities in product form. In this paper we treat the variable X and its * Correspondence: [email protected]
1
Interdepartmental Program in Computational Biology and Bioinformatics, Yale University, PO Box 208009, New Haven, CT 06520-8114, USA Full list of author information is available at the end of the article
parentsU1,…,UKas continuous variables, and a natural
choice for multivariate continuous distributions is Gaus-sian distributions. These can be represented in a Baye-sian network by using linear GausBaye-sian conditional densities. In this representation the conditional density ofXgiven its parents is given by:
P X u uk N a a ui i i
( | 1,..., ) ~ ( 0+
∑
,s2) (1)When including both quantitative traits and genetic variants in the network analysis, Bayesian networks pro-vide a natural platform for the mining of quantitative trait loci (QTLs). As a result of the small effect size of causal SNPs (mean OR < 1.4 for most common human diseases) and the multiple testing burden, many SNPs identified through genome-wide association studies are false positives if multiple comparisons are not properly taken into account. Because SNPs often exert their effects on quantitative traits, such as gene expressions, which in turn leads to the manifestation of downstream disease phenotypes, the QTL signals are enriched in the true disease causal variants, as suggested by emerging evidence. Therefore QTLs identified for disease-asso-ciated quantitative traits are more likely to be true risk factors for the disease and are natural candidates for disease risk prediction.
Functionally, not all SNPs are equally important in caus-ing the disease. Because nonsynonymous SNPs produce a different peptide sequence, they are more likely to be dis-ease causal variants than synonymous SNPs are. There-fore, by incorporating functional annotations of SNPs into the association analysis, we can reduce signal dilution and improve the power of detection of disease variants. In our analysis, we integrate the functional annotation of SNPs by adopting a weighted average approach to generate gene-level scores. We then use data to determine the appropriate weight or contribution of synonymous or non-synonymous SNPs to the disease phenotype. We present more details in the Methods section.
In this paper, we apply a Bayesian network to dissect the complex regulatory relationships among disease traits and various risk factors for the Genetic Analysis Workshop 17 (GAW17) data and use a Bayesian net-work as a tool to predict the risk of disease outcome.
Methods
Gene-level score derivation
The effective sample size for rare variants is quite small, and association analyses performed at the single-SNP level for these rare SNPs often lack sufficient power. To address this issue, we systematically explored several grouping methods published in the literature for rare variants, including the collapsing method [7], the weighted-sum
method [8], the data-adaptive sum method [2], and the kernel method [9]. We found that the well-established weighted-sum method provided solid performance. There-fore we used the weighted-sum method to perform the groupwise analysis for the rare variants.
In the weighted-sum method, the gene-level genetic variable is the sum of minor alleles of all the variants within a particular gene, but each variant is weighted by its minor allele frequency in order to put more emphasis on rare variants.
To incorporate the functional annotation of SNPs into the analysis, for each gene i, we obtain two gene level scores Si and NSi using only synonymous SNPs and
nonsynonymous SNPs, respectively. We then generate a combined gene score:
CSi = −(1 w S) i+w NS( i), (2)
where w is the weight of nonsynonymous SNPs in causing the disease phenotype. Note that wis the same for all the genes in the data. Let Ps andPns denote the proportions of true positive genes using synonymous and nonsynonymous gene scores, respectively. Then w can be estimated by Ps/(Ps + Pns). For real data, the functional annotation of SNPs can be obtained from public databases such as SIFT. The R package locfdr is used to calculate the proportion of true positive genes.
Selection of top genes for network construction
To lessen the computational burden, we first perform vari-able selection to reduce the number of genes to be included in the network analysis. To accomplish this task, we construct simple regression models in which the weighted gene score (described in the previous subsection) and the smoking status are the explanatory variables. For each of the 200 simulated GAW17 replicates, we obtain a list of top genes passing thep-value cutoff threshold of 0.1, and those top genes that appear in greater than 100 replicates are retained. Recognizing that replicates may not be available in real data, in a separate analysis we com-bine 200 replicates into one pooled sample and generate 200 bootstrap samples from the combined sample. The 200 bootstrap samples are then treated as the 200 repli-cates, and we find that the gene list obtained from the bootstrap approach agrees closely with the genes selected from the replicate-based approach (96% overlap). These steps are repeated for each of the response variables of interest (Q1, Q2, Q4, and disease phenotype), and the union of the marginally associated genes for each response variable is taken, resulting in the selection of 548 genes.
Network construction
smoking status), disease phenotype, quantitative traits (Q1, Q2, Q4), and the gene-level scores for the genes selected in the previously described step.
The conditional likelihood of the variables given their parents is represented in a Bayesian network by using linear Gaussian conditional densities. To avoid biologi-cally uninterpretable directional edges in the network, we ban the following edges from appearing in the net-work: (1) edges that point from traits (Q1, Q2, Q4, dis-ease outcome) to genes, (2) edges that connect genes to environmental variables, and (3) edges among genes.
Network optimization
We optimize the Bayesian network using a Monte Carlo Markov chain. The steps are as follows: First, a random network structure using all the variables is initialized. Next, a node from the network is randomly selected. Then, one of the following three operations is performed on the selected node: (1) adding an edge between the selected node and a potential parent node if the selected node has no parents; (2) deleting the edge from an existing parent; or (3) reversing the direction of the edge between the selected node and one of its existing parents. Finally, the post-operational likelihood for the selected node is cal-culated. To do this, a random number from the uniform distribution (0, 1) is chosen; if the random number is smaller than the Metropolis-Hasting criterion, then the new network configuration is accepted; otherwise, we revert back to the original configuration. After the initiali-zation step, the process is repeated many times until the network likelihood stabilizes.
Network confidence score derivation
We estimate the confidence of the edges in the con-structed Bayesian network by counting the number of times they appear among the 200 replicates. More for-mally, the confidence score for an edge in the network is calculated as: from the network constructed from replicate data setGi. In our analysis, a cutoff of 5 (i.e., edges that appear in at least five replicates) is applied to the confidence score to select the final network. In real data, where replicates may not be available, the confidence score can be obtained from bootstrap samples generated from the ori-ginal data.
Disease phenotype prediction
We use half of the data (randomly selected 100 repli-cates) as the training cohort to obtain a Bayesian
network following the steps described earlier. Using the features selected by the Bayesian network, we use a sup-port vector machine to build the risk prediction model in which the response variable is the binary disease out-come and the environmental variables (smoking, sex, age) and the QTLs (which are connected to the quanti-tative traits in the Bayesian network) are the predictors. The performance of the prediction model is then aver-aged over the remaining 100 replicates.
Results
Network topology
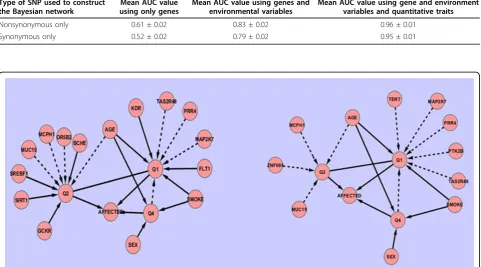
In Figure 1 we present the topologies of the Bayesian networks constructed from the true simulation model released in the post-GAW17 solution key and from our approach outlined in the Methods section.
To quantify the advantage of using a joint approach (e.g., Bayesian network) in which multiple traits are con-sidered simultaneously versus a marginal approach (e.g., least absolute shrinkage and selection operator [LASSO]) in which only one trait is considered, we tabulate the area under curve (AUC) value of both methods in Table 1. The calculated AUC values mea-sure how closely the detected genes agree with the true causal genes in the simulation model.
Disease phenotype prediction using a Bayesian network We assess the importance of the functional annotation of SNPs in disease risk prediction by separately building Bayesian networks using only nonsynonymous SNPs and synonymous SNPs. The prediction performance in terms of the AUC value is summarized in Table 2.
Discussion and conclusions
Figure 1Bayesian network topologies(A) The network topology generated from the true simulation model described in the GAW17 answer sheet. (B) The network topology inferred from the data using the Bayesian network approach. Dashed lines indicate false positive edges; solid lines indicate edges that agree with the true simulation model.
Table 1 AUC values of jointly identified QTLs using the Bayesian network and marginally identified QTLs using LASSO
Method AUC value
Bayesian network 0.61
LASSO 0.57
Table 2 Bayesian-network-based risk prediction performance using SNPs of different functional annotations
Type of SNP used to construct the Bayesian network
Mean AUC value using only genes
Mean AUC value using genes and environmental variables
Mean AUC value using gene and environment variables and quantitative traits
Nonsynonymous only 0.61 ± 0.02 0.83 ± 0.02 0.96 ± 0.01
Synonymous only 0.52 ± 0.02 0.79 ± 0.02 0.95 ± 0.01
the remaining three genes are moderately but significantly correlated with true causal genes. Furthermore, based on the results summarized in Table 1, it is quite evident that a joint approach in which multiple traits are considered simultaneously (e.g., Bayesian network) has substantial advantages over marginal methods such as the LASSO, in which traits are considered separately.
Our results suggest that the functional annotation of SNPs should not be overlooked in both association signal detection and disease risk prediction. In our analysis, we estimated the relative contribution of nonsynonymous SNPs versus their synonymous counterparts and found that the disease phenotype is predominantly driven by nonsynonymous SNPs, which closely agrees with the released simulation model. Therefore it is not surprising that the Bayesian network constructed with only synon-ymous SNPs fails to recover any of the true gene-trait rela-tionships (shown in Figure 2) and yields a much lower AUC value than that from the Bayesian network built with only nonsynonymous SNPs (Table 2).
Finally, we find that genetic variants collectively explain only a small proportion of the disease phenotype. The risk prediction model constructed with only genes as predic-tors gives an AUC value of only 0.61. However, after the environmental variables are added to the model, the AUC value is dramatically improved to 0.83. This result suggests that although the genetic variants may play an important role in disease etiology, because of their rare nature and because only a small proportion of the population carries these disease variants, their utility as disease risk predictors is limited.
Acknowledgments
Thanks are due to the Yale University Biomedical High Performance Computing Center and the National Institutes of Health (NIH) grant (RR19895) that funded the instrumentation. This work is supported in part by NIH grants R01 GM59507 and T15 LM07056 and by a fellowship award from the China Scholarship Council.
This article has been published as part ofBMC ProceedingsVolume 5 Supplement 9, 2011: Genetic Analysis Workshop 17. The full contents of the supplement are available online at http://www.biomedcentral.com/1753-6561/5?issue=S9.
Author details
1Interdepartmental Program in Computational Biology and Bioinformatics, Yale University, PO Box 208009, New Haven, CT 06520-8114, USA.2School of Epidemiology and Public Health, Yale University, New Haven, CT, 06520-8114, USA.3Hubei Bioinformatics and Molecular Imaging Key Laboratory, School of Computer Science and Technology, Huazhong University of Science and Technology, Wuhan 430074, China.4Keck Biotechnology Resource Laboratory, Yale University, 300 George Street, Room 2119, New Haven, CT 06511, USA.
Authors’contributions
JK conceived of Bayesian network study and performed the network based analyses outlined in this paper. WZ, LL, JSL, and XY pre-processed the data and compared different gene score methods. HZ supervised the study.
Competing interests
The authors declare that there are no competing interests.
Published: 29 November 2011
References
1. Willer CJ, Speliotes EK, Loos RJF, Li S, Lindgren CM, Heid IM, Berndt SI, Elliott AL, Jackson AU, Lamina C,et al:Six new loci associated with body mass index highlight a neuronal influence on body weight regulation.
Nat Genet2009,41:25-34.
2. Han FF, Pan W:A data-adaptive sum test for disease association with multiple common or rare variants.Hum Hered2010,70:42-54. 3. Cooper G, Heckerman D, Meek C:A Bayesian approach to causal
discovery.Technical Report MSR-TR-97-05Redmond, WA, Microsoft Research; 1997.
4. Pearl J, Verma TS:A theory of inferred causation.InPrinciples of Knowledge Representation and Reasoning: Proceedings of the Second International Conference.San Mateo, CA, Morgan Kaufmann;JA Allen, R Fikes, and E Sandewall 1991:441-452.
5. Spirtes P, Glymour C, Scheines R:Causation, Prediction, and Search.New York, Springer-Verlag; 1993.
6. Friedman N, Linial M, Nachman I, Pe’er D:Using Bayesian networks to analyze expression data.J Comput Biol2000,7:601-620.
7. Morris AP, Zeggini E:An evaluation of statistical approaches to rare variant analysis in genetic association studies.Genet Epidemiol2010,
34:188-193.
8. Madsen BE, Browning SR:A groupwise association test for rare mutations using a weighted sum statistic.PLoS Genet2009,5:e1000384.
9. Wu MC, Kraft P, Epstein MP, Taylor DM, Chanock SJ, Hunter DJ, Lin X:
Powerful SNP-set analysis for case-control genome-wide association studies.Am J Hum Genet2010,86:929-942.
doi:10.1186/1753-6561-5-S9-S37
Cite this article as:Kanget al.:Use of Bayesian networks to dissect the complexity of genetic disease: application to the Genetic Analysis Workshop 17 simulated data.BMC Proceedings20115(Suppl 9):S37.
Submit your next manuscript to BioMed Central and take full advantage of:
• Convenient online submission
• Thorough peer review
• No space constraints or color figure charges
• Immediate publication on acceptance
• Inclusion in PubMed, CAS, Scopus and Google Scholar
• Research which is freely available for redistribution