Magnetotail reconnection: Simulation predictions on magnetic time series
K. Arzner and M. Scholer
Centre for Interdisciplinary Plasma Science, Max-Planck-Institut f¨ur Extraterrestrische Physik, 85740 Garching, Germany
(Received June 5, 2000; Revised October 12, 2000; Accepted November 7, 2000)
In a recent kinetic computer simulation (Arzner and Scholer, 2001), magnetotail reconnection was studied with emphasis on the kinetic (particle) aspect. Complementary, we focus in the present paper on the magnetic fields. Examples of time series of the magnetic field at a fixed position, as predicted for spacecraft probes, are given. Different spatial regions are classified according to their signatures in these time series, and criteria for the proximity to the reconnection point, the post-plasmoid plasma sheet (PPPS) and the boundary layer are derived. The kinetic simulation reveals an instability of the PPPS, which is discussed in terms of an anisotropic 3-layer fluid model with the free energy is provided by the velocity anisotropy (T > T⊥) due to the simultaneous presence of inflowing lobe ions and outflowing ions deflected in the field reversal. In its nonlinear stage, this instability creates higher harmonics and finally leads to turbulence characterized by power law spatial and temporal spectra. The latter allow a direct comparison with GEOTAIL and AMPTE observations. It is found that the simulated and observed turbulence spectra agree well.
1.
Introduction
Spacecraft observations of the magnetic fields during plasma sheet passages have revealed a complex structure with enhanced turbulence during substorms (e.g., Borovsky et al., 1997). On time scales of 10 minutes up to hours, a bistable structure in Bx is observed, which is attributed to
flapping motions of the tail, exposing the spacecraft alter-nately to the north- and south half of the plasma sheet. On time scales of∼10 minutes, well-localized disturbances ap-pear which are connected to bursty bulk flows (Angelopou-loset al., 1992; Hoshinoet al., 1994); they may be related to plasmoid passages and caused by elementary reconnection events. On time scales of minutes or smaller, the behavior is found to be turbulent.
In order to understand these observations, both analyti-cal (e.g., Sundaram and Fairfield, 1995; Milovanovet al., 1996; Karimabadiet al., 1999; Kropotkinet al., 1999) and numerical studies have been performed. Among the lat-ter, so-called hybrid simulations (e.g., Krauss-Varban and Omidi, 1995; Kuznetsovaet al., 1996; Lin and Swift, 1996) with macroparticle ions and massless electron fluid allow the investigation of collisionless plasmas if electron dynam-ics can be neglected, i.e. when the electrons are still frozen to the magnetic field but the ions are allowed to decouple. This technique is particularly suitable for large-scale mag-netotail simulations since the Earth magmag-netotail is almost collisionless and the omission of electron inertial scales al-lows the modeling of substantial parts of the whole tail. In hybrid simulations, the microscopic cause of field line diffu-sion is considered as a ‘black-box’ process represented by an anomalous resistivity, or reconnection is modeled by a
non-Copy right c The Society of Geomagnetism and Earth, Planetary and Space Sciences (SGEPSS); The Seismological Society of Japan; The Volcanological Society of Japan; The Geodetic Society of Japan; The Japanese Society for Planetary Sciences.
diagonal electron pressure tensor or a finite electron mass.
2.
Kinetic Magnetotail Simulations
The simulation model used by Arzner and Scholer (2001) covers a range of 500λ0×125λ0 with λ0 the ion inertial length, corresponding to about 100 RE×25 RE, and it runs over 600−i1 withi the ion lobe angular gyrofrequency,
corresponding to about 10 minutes in real time. The above physical scaling assumes a lobe number density of 0.05 par-ticles per cm3 and a lobe magnetic field strength of 7 nT. The coordinate system is righthand cartesian with +x tail-ward,+znorthward and+ydawnward. Distances are mea-sured in units of the ion inertial length atz=0, and time is measured in units of−i1withi the lobe angular
gyrofre-quency. In simulation units, the initial Alfv´en velocity drops fromvA =1.6 at the Earthward lobe (x=0) tovA=0.6 at
the tailward lobe (x =500λ0). The initial configuration is a tail equilibrium (e.g., Birnet al., 1975; Zwingmannet al., 1990) with a magnetic normal component across the equa-torial plane. The initial current sheet density exceeds the lobe density by a factor 2.5. Reconnection is initiated by a anomalous resistivity at xη = 100λ0 andz = 0, which is localized within 2λ0and decays exponentially in time with a decay time of 250−i 1. The boundary conditions for par-ticles and electromagnetic fields are reflecting at the Earth-ward side and open at the north- and south boundaries. At the north- and south boundaries, a buffer zone of numerical resistivity is applied which damps in- and outgoing waves. Further details of the simulation configuration can be found in Lottermoser and Scholer (1999) and Arzner and Scholer (2001); the numerical code is described in Matthews (1994). The magnetic field is normalized to its lobe value atx =0,
B = (±1,0,0). Within the simulation time and for the frequencies considered, any spacecraft motion can be ne-glected, so that spacecraft time series are approximatively
656 K. ARZNER AND M. SCHOLER: SIMULATED MAGNETIC TIME SERIES IN THE MAGNETOTAIL RECONNECTION LAYER
time series at fixed positions in the simulation frame of ref-erence.
3.
Instability of the PPPS
During the simulation, a plasmoid is formed and ejected tailwards with bulk velocity in the order ofvA. The
equato-rial region behind the plasmoid contains a new, thin current layer; the so-called post-plasmoid plasma sheet (PPPS) with an enhanced out-of-plane current jy. This is illustrated in
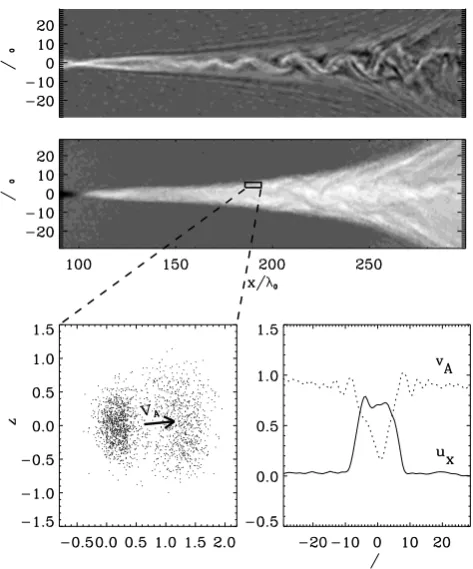
Fig. 1, showing jy (top) and the bulk velocityux (middle)
at timet = 500−i1, together with an example of the ve-locity distribution in the PPPS (bottom left) and the bulk-and Alfv´en velocity profiles at x = 190λ0 (bottom right). In the course of the simulation, the PPPS becomes unsta-ble, warps and filaments in the wake of the plasmoid (Fig. 1 top). The instability is approximatively convective, i.e. the oscillations are convected tailwards with the reconnection outflow. In the boundary layer of the PPPS and the adjacent lobe, the perturbations are Alfv´enic, whereas in the center of the PPPS a simple mode association fails due to the inho-mogeneity of the system. A similar instability has also been observed by Karimabadiet al. (1999) in two-dimensional hybrid simulations of reconnection starting from a Harris equilibrium.
3.1 Linear stage
The linear stage of the instability was discussed by Arzner and Scholer (2001) in terms of a simple 3-layer fluid model combining the anisotropic velocity distribution (T>T⊥) in the PPPS with the shear flow across the PPPS boundary. In
Fig. 1. Top: out-of-plane current jy. Middle: bulk velocityux. Bottom: velocity distribution with field-aligned beams (left) and local Alfv´en ve-locity (arrow), bulk- and Alfv´en veve-locity profiles atx =190λ0(right). All graphs represent snapshots att=500−i1; the reconnection point is atx=100λ0.
the following, we briefly repeat the argumentation given by Arzner and Scholer (2001). The velocity anisotropy results from the simultaneous presence of incoming lobe ions and outgoing ions deflected in the field reversal; the responsi-ble electric field is Ey ∼uxBzand the process is similar to
Speiser-type acceleration. There is an about equal number of in- and outflowing ions with relative velocity2vlocalA which form a pair of dense, field-aligned beams (Fig. 1 bottom left). From a kinetic point of view, this two-beam configu-ration drives a nonresonant ion-ion instability (Gary, 1993), whose properties are quite similar to the firehose instabil-ity driven by a bi-Maxwellian with equivalent temperature anisotropy. An anisotropic fluid description thus applies. The dispersion relation of the 3-layer fluid model is obtained by requiring that the total pressure and thez-displacement are continuous across the PPPS boundaries. The perturba-tions are assumed to be Alfv´enic and propagate along x. The dispersion relation can be solved analytically, and yields (simulation frame)
ω= V kx±kx
(ξ+1)(ξχlv2Al+χsv2As)−ξV2
ξ +1 (1)
where the subscripts l,s refer to lobe and PPPS, n is the density, V is the outflow (PPPS) velocity,vA is the Alfv´en
velocity,ξ =(nl/ns)sinhkxL/(1+coshkxL)is a
geometri-cal parameter depending on the density ratio and the diame-ter of the PPPS, 2L, andχ=(β⊥−β+2)/2 is the firehose parameter. In a homogeneous plasma,χ =1 describes (sta-ble) Alfv´en waves, andχ <0 indicates firehose instability. In the 3-layer model, instability occurs if
ξV2> (ξ+1)(ξχlv2Al+χsv2As). (2)
From Eq. (2) one recognizes that both the shear flow (V) and the velocity anisotropy (χ) contribute to instability. For the parameters relevant to the simulation, the free energy is mainly provided by the velocity anisotropy, whereas the bulk velocity shear is insufficient to drive a pure Kelvin-Helmholtz instability, but plays a auxiliary role. The physi-cal reason for this is that in our two-dimensional simulation the instability propagates along the magnetic field and there-fore needs to bend the magnetic field lines, which requires more energy than available in the shear flow. The growth rate γ predicted by Eq. (1) has a maximum at k kmax and vanishes atk>kmax, wherekmaxdepends onL and the density ratio nl/ns. The wavelength of maximum growth
increases with increasing L, in agreement with the simula-tion (Fig. 3 below). The propagasimula-tion properties are deter-mined by the modes of the complete 3-layer model, and sat-isfyωr(kx)V kxat the wavelength of maximum growth.
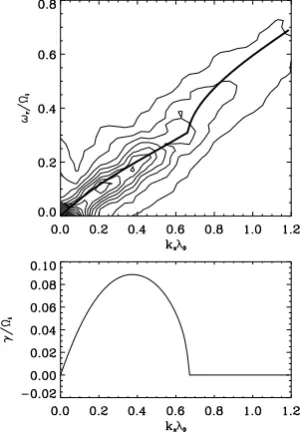
The dispersion relation of the anisotropic 3-layer fluid model (Eq. (1)) is shown in Fig. 2 (boldface line), together with the dispersion relation found from the hybrid simula-tion (contours). Both refer to the simulasimula-tion frame of refer-ence. The parameters used in the 3-layer model are:nl/ns =
0.57, vAl = 0.9λ0i, vAs = 0.4λ0i, V = 0.7λ0i,
χl = 1, χs = −1.5,L = 4.0λ0. They correspond to a
Fig. 2. Top: the dispersion relation (real frequency vs. wave number) of the PPPS instability found in the hybrid simulation (contours), and according to the 3-layer model (boldface line). Bottom: the growth rate of the 3-layer model. The parameters used in Eq. (1) are:nl/ns=0.57,
vAl =0.9λ0i,vAs =0.4λ0i,V =0.7λ0i,χl =1,χs = −1.5,
L=4.0λ0.
z0, 170λ0≤x≤320λ0, and 240i−1≤t ≤500−i1. It was verified that the choice of a particular field component and of z0 does not affect the dispersion relation, as long asz0 is within the region of instability. As can be noticed, there is a good agreement between the 3-layer model prediction and the simulation with regard to the real frequency and the excited wave lengths. The temporal growth rate in the hy-brid simulation can be inferred from the spatial growth rate; it is found thatγ ∼0.05, in qualitative agreement with the 3-layer model prediction γ ∼ 0.08 (Fig. 2 bottom). The difference in the growth rates can be explained by nonlinear saturation.
3.2 Nonlinear stage
The instability of the PPPS is particularly distinctly seen inBy, hereafter called the Hall field (Fig. 3 top). The
pres-ence of a significant Hall field|By|<∼0.4 is a consequence
of ion inertia included in the hybrid simulation and the Alfv´en theorem of Hall MHD (e.g., Arzner and Scholer, 2001). As the instability is convective, its temporal evolu-tion can be studied by a sequence of spatial power spectra S(kx)at cuts alongx(Fig. 3). In the calculation of the power
spectra shown in Fig. 3, a one-dimensional Welch window was applied with half widths marked in Fig. 3. The spectra were averaged over the timest = 490,495 and 500−i1, during which they do not change significantly. The left-hand plasmoid boundary, which separates particles originat-ing from the lobe and from the initial plasma sheet, is at x≈330λ0.
In its linear stage and atx ∼ 150λ0, the spectrum is al-most monochromatic withkxλ0 ∼0.3 (Fig. 3 bottom left)
but during propagation, nonlinear interactions create higher harmonics and mixing frequencies (Fig. 3 bottom middle), and lead finally to turbulence in the sense of power law-like
Fig. 3. Top: a snapshot of the Hall magnetic fieldByat timet=500−i1. Center: a close-up of the post-plasmoid plasma sheet showing its insta-bility and turbulence. Bottom: the spatial power spectra (linear scale) along the cuts marked in the center panel. The plasmoid (‘P’) moves to the right.
temporal/spatial wave spectra (Fig. 3 bottom right, Fig. 7 be-low). Superimposed to this cascading is a drift of the input (fundamental) scale to larger wave lengths, which is associ-ated to the increase of the linearly excited wavelength with increasing PPPS diameter in tailward direction (see above). Nonlinear saturation occurs due to energy transfer to smaller scales. Note that the transition to turbulence follows a clas-sical route of wave cascading. Within a fluid picture, this process can be described as follows. At the boundary of the PPPS, Alfv´enic perturbations are excited by the velocity anisotropy due to the field-aligned beams. In the center of the PPPS and in the wake of the plasmoid, the plasma beta is1, so that compressibility must be taken into account. As a result, the Alfv´en waves propagating along x couple to, and decay into, magnetosonic modes in the field rever-sal and in the wake of the plasmoid where the (weak) mag-netic field is directed alongz. This process leads to evolved MHD plasma turbulence in the sense of Tsytovich (1977). In our simulation there is no dissipation scale because par-ticle collisions are absent, so that the power law extends to the smallest resolved scales.
4.
Magnetic Time Series
658 K. ARZNER AND M. SCHOLER: SIMULATED MAGNETIC TIME SERIES IN THE MAGNETOTAIL RECONNECTION LAYER
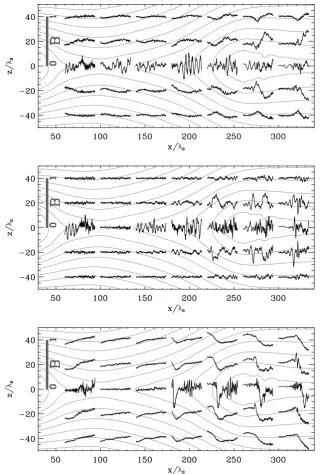
Fig. 4. Black curves: simulated magnetic time series (240−i1 ≤t≤500−i1) at different positions in thex z-plane. Gray: projection of the magnetic field lines onto thex z-plane att=360−i1. See text.
Figure 4 shows typical examples of time series of Bx
(top),By(middle) andBz(bottom) recorded at different
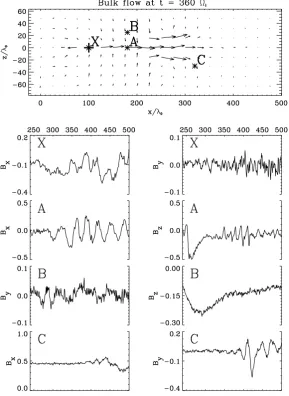
po-sitions in thex z-plane. The solid curves represent the time interval 240−i1≤t≤500−i1, ranging from 4 to 8.3 min-utes after reconnection onset in real time. For comparison, the field lines at an intermediate timet =360−i1are also given (dotted). Each curve corresponds to the position of their left starting point and all curves have the same scale for the magnetic field (gray bar: lobe field strength). A close-up of representative time series is shown in Fig. 5, together with the in-plane bulk velocity field att = 360−i1. The position of each time series (bottom) is marked by a star in the top panel.
From the study of an extended set of time series similar to Fig. 4, the following picture emerges. The magnetic field in
the inflow region (|z|>∼0.5|x−xη|; Fig. 5 top) is calm and carries only weak (≤ 0.05) statistical fluctuations. The im-mediate vicinity of the X point with nonvanishing resistivity (Fig. 5, ‘X’) is characterized by strong fluctuations inBxon
a time scale of 20−i1, whereasByandBzare only weakly
noisy with amplitude <∼ 0.05. In the downtail equatorial plane atx−xη >∼75 (Fig. 5, ‘A’), a plasmoid has evolved and is ejected tailwards; its passage manifests in a distinct peak in Bz and in quasi-coherent oscillations inBy (not shown)
andBx(shown in Fig. 5) in the post-plasmoid plasma sheet.
Contrary to the classical bipolar plasmoid signature in Bz,
Fig. 5. Top: In-plane velocity field att=360−i1and positions (star) of simulated magnetic time series X,A,B,C (bottom).
with increasing|z|, whereasBy remains fluctuating (Fig. 5,
‘B’). With increasing x, the quasi-periodic oscillations in Bx vanish and the plasmoid passage is most distinctly seen
inBy(Fig. 5, ‘C’).
Since the plasmoid moves into the+x-direction, its pas-sage appears delayed at subsequentx. The resulting signa-ture in the center (z =0) and lobe (z = 20) are shown in Fig. 6. All curves have the same scale, and different curves refer to differentx-positions (middle labels). In the center of the plasma sheet, the dominant feature is a negative peak inBzdue to piled-up field lines in the wake of the plasmoid,
whereasByandBx show merely an increase in the
fluctua-tions when the observer is passed by the post-plasmoid cur-rent sheet. The lobe signatures are much smoother, and the largest modulations occur in the Hall fieldBy.
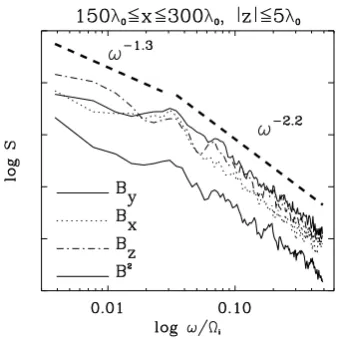
In order to characterize the turbulent pattern in the PPPS time series, their temporal power spectra were computed us-ing a Hannus-ing window (Fig. 7). The spectra represent spatial averages over the regions 150λ0 ≤x≤300λ, |z| ≤5λ0in logarithmic scale. They show moderate peaks atω∼ 0.03 and 0.07, which correspond to the distinct wavelengths in Fig. 3 bottom middle, advected with the bulk velocity (since
the shape of the spatial structures evolves in time, they do not transform to equally distinct peaks in the temporal spec-tra). The spectra can be represented by two power laws (boldface dashed lines), separated by a turnover frequency ω∗ ≈ 0.02i ∼ 0.03 Hz. At f < f∗, the power law
in-dex is about 1.3 and at f > f∗, the power law index is 2.2. Whereas power law behaviour at f < f∗can be questioned on grounds of the limited data points and windowing effects, the spectra follow at f > f∗a power law with remarkable accuracy. We interpret this as the signature of evolved or almost evolved MHD turbulence (Subsection 3.1), starting from the input scale prescribed by the linear instability of the PPPS. The simulated power law index (α ∼2.2) is in qualitative agreement with the theoretical estimate (α∼2) given by Tsytovich (1977) for the steady-state spectrum of fast magnetosonic turbulence.
660 K. ARZNER AND M. SCHOLER: SIMULATED MAGNETIC TIME SERIES IN THE MAGNETOTAIL RECONNECTION LAYER
Fig. 6. The simulated passage signature of the plasmoid at different posi-tions in space.
Fig. 7. The simulated power spectra ofBx,By, Bz andB2 time series, averaged over the turbulent range of the post-plasmoid plasma sheet. In real time,icorresponds to about 1.5 Hz.
power spectra of near-Earth AMPTE observations (Baueret al., 1995), yielding a turnover frequency of f ∼0.03 Hz with power law slopes of 1.5 below and 2 to 2.5 above f∗, although the latter observations were made on the Earthward side of, and thus closer to, the reconnection point.
5.
Summary and Conclusions
Hybrid simulations of magnetotail reconnection have re-sulted in highly anisotropic particle distributions within the reconnection layer. The kinetic cause of the velocity aniso-tropy is the simultaneous presence of inflowing lobe ions and outflowing ions deflected in the field reversal. The re-sulting velocity (T>T⊥) anisotropy drives a firehose type instability exciting mostly Alfv´enic perturbations, which couple to, and decay, into magnetosonic modes due to non-linear interaction and the inhomogeneity of the system. This process finally leads to a filamentation and disruption of the PPPS and to evolved or almost evolved MHD turbulence in the wake of the plasmoid. The linear stage of the instabil-ity can be described by an anisotropic 3-layer fluid model where the free energy is provided by the velocity anisotropy
in the PPPS and the wave vector of maximum growth is de-termined by the model geometry.
In the present paper we have analyzed magnetic time se-ries obtained from these hybrid simulations which can be compared with spacecraft observations. The diffusion re-gion manifests itself in strong fluctuations inBx, whereasBy
and Bz remain calm; the downtail equatorial region shows
a (unipolar) plasmoid signature in Bz, followed by
quasi-coherent oscillations inBxandBywith period∼1 minute,
which become turbulent at x −xη >∼ 150λ0. The plasma sheet boundary layer carries fluctuations in the Hall field By, whereasBxandBzshow smooth signatures of plasmoid
passage. In the lobe, all signatures become smooth and the largest modulations occur in By. It is found that temporal
power spectra of the PPPS turbulence at fixed position agree remarkably well with GEOTAIL (Hoshinoet al., 1994) and AMPTE (Baueret al., 1995) satellite observations.
The analysis of the full simulated space-time data reveals that the quasi-coherent oscillations in PPPS time series are due to the linear stage of the PPPS instability, which is char-acterized by quasi-monochromatic waves traveling tailwards with about the outflow velocity. This offers the possibility that the quasi-coherent oscillations seen in spacecraft obser-vations are not the signature of a sequence of plasmoids (ad-vected tearing modes), as might be suspected from the time series of an isolated probe in the equatorial plane (Hoshino, 2000), but are due to MHD waves excited by the mechanism described above.
We should finally stress that our simulation is limited with regard to its two-dimensionality and the neglection of elec-tron dynamics. It is to be expected that three-dimensional simulations including electron dynamics will reveal the lower hybrid drift instability, which is not resolved within the present simulation. Also, there are alternative explana-tions of turbulent appearance of the spacecraft time series, such as flapping motions of the whole magnetotail. Such alternative scenarios are not ruled out by the present simula-tion.
Acknowledgments. We thank Rudolf A. Treumann for helpful comments and discussions.
References
Angelopoulos, V., W. Baumjohann, C. F. Kennel, F. V. Coroniti, M. G. Kivelson, R. Pellat, R. J. Walker, H. L¨uhr, and G. Paschmann, Bursty bulk flows in the inner central plasma sheet,J. Geophys. Res.,97, 4027– 4039, 1992.
Arzner, K. and M. Scholer, Kinetic structure of the post-plasmoid plasma sheet during magnetotail reconnection,J. Geophys. Res.,106, 3827– 3844, 2001.
Bauer, T., W. Baumjohann, R. Treumann, N. Sckopke, and H. L¨uhr, Low-frequency waves in the near-Earth plasma sheet,J. Geophys. Res.,100, 9605–9617, 1995.
Birn, J., R. Sommer, and K. Schindler, Open and closed magnetospheric tail configurations and their stability,Astrophys. and Space Science,35, 389–402, 1975.
Borovsky, J. E., R. C. Elphic, H. O. Funsten, and M. F. Thomsen, The Earth’s plasma sheet as a laboratory for flow turbulence in high-βMHD,
J. Plasma Physics,57, 1–34, 1997.
Gary, P., Theory of space plasma microinstabilities, 181 pp., Cambridge Univ. Press, 1993.
Hoshino, M., A. Nishida, T. Yamamoto, and S. Kokobun, Turbulent mag-netic field in the distant magnetotail: bottom-up process of plasmoid formation?,Geophys. Res. Lett.,21, 2935–2938, 1994.
origin of MHD turbulence?,Adv. Space Res.,25, 1685–1688, 2000. Karimabadi, H., D. Krauss-Varban, and N. Omidi, Magnetic structure of the
reconnection layer and core field configuration in plasmoids,J. Geophys. Res.,104, 12,3131–12,326, 1999.
Krauss-Varban, D. and N. Omidi, Large-scale hybrid simulations of the magnetotail during reconnection,Geophys. Res. Lett.,22, 3271–3274, 1995.
Kropotkin, A. P., O. O. Trubachev, and A. T. Y. Lui, Nonlinear instability of the geomagnetic tail current sheet combining the features of tearing and cross-field current instabilities,J. Geophys. Res.,104, 371–381, 1999. Kuznetsova, M., M. Hesse, and D. Winske, Ion dynamics in a hybrid
simu-lation of magnetotail reconnection, J. Geophys. Res., 101, 27,351– 27,373, 1996.
Lin, Y. and D. W. Swift, A two-dimensional hybrid simulation of the mag-netotail reconnection layer,J. Geophys. Res.,101, 19,859–19,870, 1996. Lottermoser, R.-F. and M. Scholer, Hybrid simulation of magnetotail
re-connection,Phys. Chem. Earth (C),24, 275–279, 1999.
Matthews, A. P., Current advance method and cyclic leapfrog for 2D multi-species hybrid plasma simulations,J. Comp. Phys.,112, 102–116, 1994. Milovanov, A. V., L. M. Zelenyi, and G. Zimbardo, Fractal structures and power law spectra in the distant Earth’s magnetotail,J. Geophys. Res., 101, 19,903–19,910, 1996.
Sundaram, A. K. and D. H. Fairfield, Localized tearing modes in the mag-netotail driven by curvature effects,J. Geophys. Res.,100, 3563–3572, 1995.
Tsytovich, V. N., Theory of turbulent plasma, 535 pp., Consultants Bureau, New York, 1977.
Zwingmann, W., J. Wallace, K. Schindler, and J. Birn, Particle simulation of magnetic reconnection in the magnetotail configuration,J. Geophys. Res.,95, 20,877–20,888, 1990.
