R E S E A R C H A R T I C L E
Open Access
Implementation of the Robson classification
in clinical practice:Lithuania
’
s experience
Justina Kacerauskiene
*, Egle Bartuseviciene, Dalia Regina Railaite, Meile Minkauskiene, Arnoldas Bartusevicius,
Mindaugas Kliucinskas, Renata Simoliuniene and Ruta J. Nadisauskiene
Abstract
Background:To determine the cesarean section (CS) rate in Lithuania, identify the groups of women that influence it using the Robson classification and to determine the impact of implementing the use of the Robson classification on the CS rate.
Methods:The Robson classification was introduced in Lithuanian hospitals prospectively classifying all the deliveries in 2012. The overall CS rate, sizes of the Robson groups of women, CS rate in each group and contribution to the overall CS rate from each group was calculated and the results were discussed. The analysis was repeated in 2014 and the data were compared using MS EXCEL and SPSS 23.0.
Results:Nineteen Lithuanian hospitals participated in the study. They represented 84.1% of the deliveries (23,742 out of 28,230) in 2012 and 88.5% of the deliveries (24,653 out of 27,872) in 2014. The CS rate decreased from 26.9% (6379/23,742) in 2012 to 22.7% (5605/24,653) in 2014 (p< 0.001). The greatest contributions to the overall CS rate were made by groups 1, 2 and 5. The greatest decrease in the CS rate was detected in group 2. The absolute contribution to the overall CS rate decreased from 4.9% to 3.8%.
Conclusion:The Robson classification can work as an audit tool to identify the groups that have the greatest impact on the CS rate. It also helps to develop a strategy focussing on the reduction of the CS rate.
Keywords:Cesarean section, Rate, Robson classification, Audit, Intervention
Background
Cesarean section (CS) was introduced to obstetrical prac-tice as a lifesaving procedure both for mother and her child. Paradoxically, despite the increasing CS rate, there is no further improvement in the perinatal mortality rates. On the contrary, there is a growing body of literature claiming that excessive CSs increase the risk not only of maternal and infant morbidity but also of maternal and neonatal mortality [1–3]. Therefore, focussing on strat-egies to avoid unnecessary CSs need to be developed.
In order to identify the most significant groups of women contributing to the growing CS rate, a universal classification of all deliveries should be implemented. Some authors claim that simply classification of deliveries itself may act as a trigger and can reduce the CS rate [4– 6]. It gives an opportunity to evaluate the prevalence of
CSs among various groups of women, to compare data between institutions, learn from each other and to create strategies for better results. Based on the available know-ledge, the Robson classification (the Ten-group classifica-tion system) meets the current needs the best [7, 8].
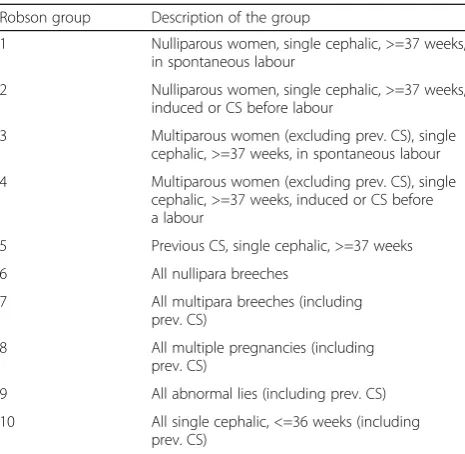
The aim of our study was to implement the Robson classification (Table 1) in all Lithuanian hospitals provid-ing obstetrical care, to identify the target groups of women who influence the CS rate the most and to de-termine if the implemented classification system might work as an audit tool to reduce the CS rate.
Methods
Study setting and design
A national interventional study was performed from January 1 to December 31 of 2012 (the first study period) at the Lithuanian hospitals providing obstetrical care. It was repeated from January 1 to December 31 in 2014 (the second study period). Before the study, the
* Correspondence:[email protected]
Lithuanian University of Health Sciences, Eiveniu str. 2, 50167 Kaunas, Lithuania
Robson classification was known by the Lithuanian obstetricians and gynecologists but it had not been for-mally endorsed nationally and wasn’t used in everyday practice. The increasing national CS rate encouraged the Lithuanian Society of Obstetricians and Gynecologists (LSOG) to organise a special meeting where obstetri-cians and gynecologists and the authorities of the Lithuanian hospitals were invited. The meeting was held in December 2011. The Cesarean Section Working Group of the LSOG reminded the participants of the principles of the Robson classification at the meeting, encouraged them to classify the deliveries routinely and invited them to join the study by sending relevant data to the study coordinators. There are 33 hospitals with labour and delivery units in Lithuania. Overall, 23 and 21 hospitals in 2012 and 2014 respectively, agreed to participate in the study and reported their data. Nine-teen hospitals participated in both years, while the remaining participated either in 2012 or in 2014. The reasons to withdraw participation in the study were that staff found the classification too complicated and were not interested in carrying out extra work. On the other hand the vast majority of hospitals found the study help-ful and were keen to continue to take part in the study. All pregnant women admitted to a labour and delivery ward were included in the study and were classified ac-cording to the Robson classification. Any deliveries with a gestational age less than 22 weeks or with a newborn weight under 500 g were excluded from the study. The study did not require any direct contact with a patient and it could not cause any harm to them.
During the first period, all the deliveries at a certain hospital were classified by its clinicians into one of the
ten classification groups. If any questions or difficulties in classifying a woman arose, two investigators (D.R.R. and E.B.) provided continuous educational assistance not only before but also during the study (in person, by e-mail or phone calls). Then summary data were sent on a monthly basis by e-mail or fax to the study investigators. In 2013 all the data from hospitals were analysed and a summit conference was organised specifically for this project. The attendees of the meeting included adminis-trators of the participating hospitals, members of the LSOG, the Lithuanian Health Ministry and the Lithu-anian Parliament. During the conference the CS rates among different hospitals and different groups of women were compared and discussed. The general consensus to try and reduce the CS rate was accepted. Moreover, it was decided that the Robson classification was clear, easy to use and a clinically valuable system which made it possible to identify the different groups of women contributing to the overall CS rate. During the second period, the classification of deliveries according to the Robson classification was repeated and the data were sent to the study investigators.
Statistical analysis
Data were analysed using MS EXCEL and IBM SPSS Statistics 23.0 for Windows. The classified deliveries in 2012 and 2014 were compared. The z-test was used to compare equality of probabilities. Minimum sample size of 1197 subjects per group needed to detect a 5% change in the CS rate with a power of 80% and a significance level of 5%.
Results
A total of 84.1% (23,742/28,230) of all hospital births in Lithuania in 2012 and 88.5% (24,653/27,872) of all hospital births in Lithuania in 2014 were analysed. The overall CS rate decreased from 26.9% (6379/ 23,742) in 2012 to 22.7% (5605/24,653) in 2014 (Table 2). This decrease was statistically significant (p < 0.001) (Table 2).
The greatest 1.1% decrease was detected in 2 group with an absolute decrease in the overall CS from 4.9% to 3.8%. The greatest contribution to the overall CS rate was made by groups 1, 2 and 5 (previous CS, single cephalic,≥37 weeks) (Table 2). These groups were iden-tified as “target groups” and were responsible for 67.5% (4303/6379) of all CSs in 2012. The study analysis revealed that the CS rate decreased in 9 of 10 groups in 2014. A statistically significant decrease was detected not only in the“target groups”, but also in groups 3, 4, 6 and 8 (Table 2). In addition to this, the absolute contri-bution of all groups to the overall CS rate decreased.
Of particular importance though the combination of Groups 1 and 2 (the single cephalic nulliparous Table 1The Ten-group classification system
Robson group Description of the group
1 Nulliparous women, single cephalic, >=37 weeks, in spontaneous labour
2 Nulliparous women, single cephalic, >=37 weeks, induced or CS before labour
3 Multiparous women (excluding prev. CS), single cephalic, >=37 weeks, in spontaneous labour
4 Multiparous women (excluding prev. CS), single cephalic, >=37 weeks, induced or CS before a labour
5 Previous CS, single cephalic, >=37 weeks
6 All nullipara breeches
7 All multipara breeches (including prev. CS)
8 All multiple pregnancies (including prev. CS)
9 All abnormal lies (including prev. CS)
pregnancy at term) and Groups 3 and 4 (the single cephalic multiparous pregnancy without a scar at term) also showed a statistically significant reduction in CS rate (Tables 3 and 4). After comparison of nul-liparous or multiparous with term single cephalic pregnancies and spontaneous or induced labours and prelabour cesarean sections in 2012 and 2014, we found a statistically significant decrease in the CS rate too (Tables 3 and 4).
Despite the statistically significant decrease in the CS rate in 2014, there was no statistically significant in-crease in overall perinatal mortality (Table 5) or in groups 1, 2 and 5, which made the greatest contribution to the overall CS rate (Table 6).
Discussion
We have interpreted our results following the recommen-dations provided by Robson et al. [8]. Groups 1, 2 and 5 normally account for two-thirds of the overall CS rate with group 5 as normally the largest contributor [8]. This was confirmed by our study and those groups were identified as
“target groups”. The results showed that Lithuanian hospi-tals managed to reduce the CS rate not only in the“target groups”, but in almost all groups. The only group in which the CS rate increased was Group 9 and this was a direct consequence of improved data collection and subsequent classification. The number of women in group 9 decreased from 107 to 68 in 2014 although the CS rate (98.5%) in this group was still short of the 100% it should be. This shows Table 2The number of CS in each group and their contribution to the overall CS rate in 2012 and 2014
Overall cesarean section (CS) rate (%) 6379/23,742 (26.9%) in 2012 and 5605/24,653 (22.7%) in 2014
2012 2014 2012 2014 2012 2014 2012 2014
Group Number of CS over total number of women in each group
Relative size of groups (%)
CS rate in each
group (%) p
value Absolute contribution to overall CS rate (%)
p value
1 1289/8057 1209/8646 33.9 35.1 16.0 14.0 p < 0.001 5.4 4.9 p= 0.009
8057/23,742 8646/24,653 1289/8057 1209/8646 1289/23,742 1209/24,653
2 1158/2217 938/2239 9.3 9.1 52.2 41.9 p < 0.001 4.9 3.8 p < 0.001
2217/23,742 2239/24,653 1158/2217 938/2239 1158/23,742 938/24,653
3 310/7701 225/7858 32.4 31.9 4.0 2.9 p < 0.001 1.3 0.9 p < 0.001
7701/23,742 7858/24,653 310/7701 225/7858 310/23,742 225/24,653
4 415/1180 280/1175 5.0 4.8 35.2 23.8 p < 0.001 1.8 1.1 p < 0.001
1180/23,742 1175/24,653 415/1180 280/1175 415/23,742 280/24,653
5 1856/2304 1764/2535 9.7 10.3 80.6 65.6 p < 0.001 7.8 7.2 p= 0.0056
2304/23,742 2535/24,653 1856/2304 1764/2535 1856/23,742 1764/24,653
6 473/494 420/493 2.1 2.0 95.8 85.2 p < 0.001 2.0 1.7 p= 0.018
494/23,742 493/24,653 473/494 420/493 473/23,742 420/24,653
7 250/283 245/286 1.2 1.2 88.3 85.7 p= 0.34 1.1 1.0 p= 0.516
283/23,742 286/24,653 250/283 245/286 250/23,742 245/24,653
8 210/312 176/305 1.3 1.2 67.3 57.7 p= 0.014 0.9 0.7 p= 0.035
312/23,742 305/24,653 210/312 176/305 210/23,742 176/24,653
9 105/107 67/68 0.5 0.3 98.1 98.5 p= 0.84 0.4 0.3 p= 0.0016
107/23,742 68/24,653 105/107 67/68 105/23,742 67/24,653
10 313/1087 281/1048 4.6 4.3 28.8 26.8 p= 0.31 1.3 1.1 p= 0.075
1087/23,742 1048/24,653 313/1087 281/1048 313/23,742 281/24,653
Table 3The number of CS in 1 and 2 groups and their absolute contribution to the overall CS rate in 2012 and 2014
2012 2014 2012 2014 2012 2014 2012 2014
Group Number of CS over total number of women in 1
and 2 groups
Relative size of 1 and 2 groups (%)
CS rate in 1 and 2 groups (%)
p value Absolute contribution to overall CS rate (%)
p value
1 and 2 2447/10,274 2147/10,885 43.3 44.2 23.8* 19.7* p < 0.001 10.3* 8.7* p < 0.001
10,274/23,742 10,885/24,653 2447/10,274 2147/10,885 2447/23,742 2147/24,653
that hospital staff still requires further training in correct classification. Although the “recommended” CS rate in group 1 is 10%, Lithuania’s hospitals did not manage to reach this rate in the course of two years, but decreased it from 16% (1289/8057) to 14% (1209/8646) [8]. Based on the ratio of group sizes between group 1 and group 2, the rate of inductions and pre-labour CSs in Lithuania was not high in 2012. Despite the fact, that the hospitals man-aged to reduce the CS rate in group 2, it still remained ap-proximately 10% higher (41.9%) than the“recommended” rate (Table 2) [8].
Our results showed an increase in the number of women in group 5 in 2014. This may be attributed to the growing primary CS rate in Lithuania or possibly an improvement in data collection. According to national data, the CS rate in Lithuania nearly tripled, from 9.6% in 1995 to 26.0%, in 2012 [9]. However now by carrying out fewer CSs in nulliparous women, there will be fewer repeat CSs in the future. The CS rate in group 5 went down at the end of our study, from 80.6% (1856/2304) to 69.6% (1764/2535), but didn’t reach the “ recom-mended”rate of 50–60% [8].
We have shown in our study that the Robson classifi-cation was useful not only for identifying the target groups of women who influence the CS rate the most, but seemed to work as an audit tool that significantly re-duced the CS rate without any statistically significant change in the perinatal mortality. No specific clinical intervention in clinical practice was implemented during the study period. Moreover, no internal audit of any spe-cific cases was performed. We analysed only the distri-bution of deliveries among Robson’s groups, according to the data presented by the individual hospital’s clini-cians. These data were analysed and presented to health care policy-makers and hospital staff who implemented
the Robson classification in their everyday clinical prac-tice, and then subsequently discussed the results.
All the institutions involved in the whole study agreed that this should not be a“one-day action”, but the begin-ning of a new national strategy. Therefore, the Robson classification and staff feedback helped to reduce the CS rate. This whole study in its entirety had a lot in com-mon with the original description of the Hawthorne ef-fect, that when an individual or a group of people know that they are being observed, their behaviour changes and productivity increases [10].
A similar positive effect of the clinical audit cycle has been reported by other researchers as well. Saha et al. reported a 10.6% decrease of the overall CS rate at the Obstetrics and Gynecology Department of the Calcutta National Medical College and Hospital [11]. The crease from 29% to 18.4% was observed after a new de-livery management protocol was implemented and a new classification system was introduced in clinical practice [11]. A 10.3% (from 36.8% to 26.5%) and a 2.5% reduction in the overall CS rate was reported at the Van Buren Hospital in Chile and at Pembury Hospital in the United Kingdom respectively, after the Robson classifica-tion was introduced [4, 12]. The Haga Hospital in the Netherlands introduced a cesarean section audit and during daily report meetings all the CS’s and their indi-cations were discussed [13]. A 4.7% decrease (from 23.4% to 18.7%) was achieved [13]. However, a study performed by Abdel-Aleem et al. has shown a 6% (from 32% to 38%) increase in the CS rate after the audit per-formed at Assiut University in Egypt [14]. According to the authors, this might have been due to the short dur-ation (two months) of that study.
As far as we are aware there are no published data on the impact of a national implementation of Robson’s classification leading to an effect on the national CS rate. The strength of our study is that we have included the vast majority of Lithuania‘s hospitals and analysed more than 80% of deliveries in Lithuania. Therefore, our data may be treated as representative of the whole country. Moreover, with the achievement of a decreased CS rate without a negative impact on the perinatal outcomes in our country, this classification has now become compul-sory in all Lithuanian hospitals by ministerial order as of 1 January 2016.
Table 4The number of CS in 3 and 4 groups and their absolute contribution to the overall CS rate in 2012 and 2014
2012 2014 2012 2014 2012 2014 2012 2014
Group Number of CS over total number of women in 3 and 4 groups
Relative size of 3 and 4 groups (%)
CS rate in 3 and 4 groups (%)
p value Absolute contribution to overall CS rate (%)
p value
3 and 4 725/8881 505/9033 37.4 36.6 8.2* 5.6* p < 0.001 3.1* 2.0* p < 0.001
8881/23,742 9033/24,653 725/8881 505/9033 725/23,742 505/24,653
*p < 0.05
Table 5Perinatal mortality in 2012 (total number of births 28,582) and 2014 (total number of births 28,200)
2012 2014 p value
Antepartum deaths 92 111 0.1527
Intrapartum deaths 21 19 0.7871
Not defined 5 3 0.4902
Early neonatal deaths 31 33 0.7642
A possible limitation of our study is that the deliveries were not classified by an expert in the Robson classifica-tion. Hospital clinicians carried out the classification of deliveries and it was their first experience in this field. Perinatal data were recorded by the Institute of Hygiene Health Information Centre of Lithuania. No independent audit was performed to verify that the deliveries had been classified correctly or the perinatal mortality related data were correct. Moreover, we did not analyse any other data related to pregnancy, delivery and fetal or qualitative feed-back from either the woman or the staff. Therefore, we are going to continue our project focusing on those fac-tors mentioned above and to try and improve our national perinatal audit going forward in the future.
Conclusion
The Robson classification can work as an audit tool to identify the groups that have the greatest impact on the CS rate. It also helps to develop a strategy focussing on the reduction of the CS rate.
Abbreviations
CS:caesarean section; LSOG: Lithuanian Society of Obstetricians and Gynecologists; LUHS: Lithuanian University of Health Sciences
Acknowledgements
The authors of the manuscript would like to thank Prof. M. Robson for his assisstance in writing this paper.
Funding
Not applicable.
Availability of data and materials
The datasets used and/or analysed during the current study are available from the corresponding author on reasonable request.
Authors’contributions
JK, EB and DRR were involved in study design, acquisition, analysis and interpretation of data, and drafting of the article. RS was involved in study data analysis. AB, MM, MK and RN were involved in conception and study design, interpretation of data, and critical revision of the article. All authors approved the final version for publication.
Ethics approval and consent to participate
An authorisation from the Kaunas Region Biomedical Research Ethics Committee (No. BEC-MF-328) was obtained based on the Helsinki declaration.
Consent for publication
Not applicable.
Competing interests
The authors declare that they have no competing interests.
Publisher’s Note
Springer Nature remains neutral with regard to jurisdictional claims in published maps and institutional affiliations.
Received: 15 May 2017 Accepted: 12 December 2017
References
1. Villar J, Carroli G, Zavaleta N, Donner A, Wojdyla D, Faundes A, et al. Maternal and neonatal individual risks and benefits associated with caesarean delivery: multicentre prospective study. BMJ. 2007;335(7628):1025. 2. Deneux-Tharaux C, Carmona E, Bouvier-Colle MH, Bréart G. Postpartum
maternal mortality and cesarean delivery. Obstet Gynecol. 2006;108(3):541–8. 3. MacDorman MF, Declercq E, Menacker F, Malloy MH. Neonatal mortality for
primary cesarean and vaginal births to low-risk women: application of an “intention-to-treat”model. Birth. 2008;35(1):3–8.
4. Scarella A, Chamy V, Sepúlveda M, Belizán JM. Medical audit using the ten Group classification system and its impact on the cesarean section rate. Eur J Obstet Gynecol Reprod Biol. 2011;154(2):136–40.
5. Villar J, Valladares E, Wojdyla D, et al. Caesarean delivery rates and pregnancy outcomes: the 2005 WHO global survey on maternal and perinatal health in Latin America. Lancet. 2006;367(9525):1819–29. 6. Poma PA. Effect of departmental policies on cesarean delivery rates: a
community hospital experience. Obstet Gynecol. 1998;91(6):1013–8. 7. Torloni MR, Betran AP, Souza JP, Widmer M, Allen T, Gulmezoglu M, et al.
Classifications for cesarean section: a systematic review. PLoS One. 2011;6:e14566. 8. Robson M, Hartigan L, Murphy M. Methods of achieving and maintaining an
appropriate caesarean section rate. Best Pract Res Clin Obstet Gynaecol. 2013;27(2):297–308.
9. Medical data of births 2011 Vilnius: institute of hygiene health information Centre; 2012. Availabe from: http://www.hi.lt.
10. Roethlisberger FJ, Dickson W, Wright H. Management and the worker: an account of a research program conducted by the western electric company, Hawthorne works Chicago. Cambridge: Harvard University Press; 1939. 11. Saha S, Saha S, Das R, Chakraborty M, Bala HS, Naskar P. Paradigm shift to
check the increasing trend of cesarean delivery is the need of hour: but how? J Obstet Gynaecol India. 2012;62(4):391–7.
12. Robson MS, Scudamore IW, Walsh SM. Using the medical audit cycle to reduce cesarean section rates. Am J Obstet Gynecol. 1996;174(1):199–205. 13. van Dillen J, Lim F, van Rijssel E. Introducing caesarean section audit in
regional teaching hospital in The Netherlands. Eur J Obstet Gynecol Reprod Biol. 2008;139(2):151–6.
14. Abdel-Aleem H, Shaaban OM, Hassanin AI, Ibraheem AA. Analysis of caesarean delivery at Assiut university hospital using the ten Group classification system. Int J Gynaecol Obstet. 2013;123(2):119-23.
Table 6The number of antepartum and intrapartum deaths in 2012 (total number of births 28,582) and 2014 (total number of births 28,200) in certain groups
Group 2012 2014 2012 2014
Number of antepartum deaths p value Number of intrapartum deaths p value
1 and 2 18 14 0.5029 2 3 0.6455
3 and 4 13 18 0.3472 5 2 0.2627
5 2 1 0.5687 0 0
Overall 33 33 0.9601 7 5 0.5823