Vol. 5, Issue 2, Februray 2016
Studies on Dielectric Behaviour and Second
Harmonic Generation (SHG) Efficiency of
Pure and Glycine Doped Bisthiourea Co
Oxalate: A Novel Semiorganic Nonlinear
Optical Material
Malhari N. Raste 1, Satish K. Pardeshi 2
Ph. D. Scholar, Department of Chemistry, Savitribai Phule Pune University, Ganeshkhind, Pune, Maharashtra, India1
Professor & Inorganic Section Head, Department of Chemistry, Savitribai Phule Pune University, Ganeshkhind, Pune,
Maharashtra, India2
ABSTRACT: A novel class of semiorganic nonlinear optical materials viz. pure and glycine doped bisthiourea cobalt oxalate have been synthesized by solvent free mechanochemical method. Chemical composition was confirmed by CHNS and chemical analysis. Incorporation of glycine in pure compound was confirmed by FTIR and EDAX. FTIR studies ascertained the coordination of metal ions to thiourea through sulphur atom. Thermal behaviour has been investigated by TG and DTA. Transmittance spectra reveal that lower cut-off wavelength for pure and doped materials are 300nm, 287nm respectively. SEM images shows compounds are porous and agglomerated. The dielectric measurements with varying frequencies at room temperature were studied which enhance the SHG efficiency. The SHG measured by Kurtz-Perry powder technique was found to be higher for doped materials which defines NLO nature and their suitability for NLO applications
KEYWORDS: Bisthiourea Co oxalate, Glycine doped bisthiourea Co oxalate, Mechanochemical method, Dielectric study, Second harmonic generation, Non linear optical nature
I. INTRODUCTION
In the recent years, search for Non Linear Optical (NLO) materials has been increased because of their applications like Second Harmonic Generation (SHG), frequency mixing, electro optic modulation and optical parametric oscillation [1]. These materials are attracting a great deal of attention due to their applications in optical devices such as optical data storage, optical switches, optical communications [2-3]. In search of new frequency conversion materials, recent interest focused in semiorganic materials which possess several attractive properties such as high NLO coefficient, high laser damage threshold and wide transparency range, high mechanical strength and high thermal stability [4]. Among the semiorganic NLO materials, the metal complexes of thiourea have a low UV cut-off wavelength which finds significant applications in the field of High frequency conversion and Second harmonic generation [5-7]. Thiourea is an inorganic matrix modifier due to its large dipole moment and its ability to form an extensive network of hydrogen bonds [8]. Thiourea being a naturally centro-symmetric molecule but when it forms complexes with metal ions, it shows NLO characteristics. Some of the potential thiourea complexes such as Zinc Thiourea Chloride (ZTC) [9], Zinc Thiourea Sulphate (ZTS) [10], Bisthiourea Cadmium Chloride (BTCC) [11], Bisthiourea Cadmium Acetate (BTCA) [12] have been reported.
Amino acids are interesting materials, as they contains proton donor carboxylic acid (-COOH) group and proton
acceptor amino (-NH2) group which provide the ground state charge asymmetry of molecule required for second order
is the simplest amino acid which on addition enhances the nonlinear optical property of material [16-17]. Hence glycine is used as dopant.
In this paper we report the synthesis of a new semiorganic nonlinear optical materials, Bisthiourea Cobalt Oxalate (BTCoOx) and Glycine doped Bisthiourea Cobalt Oxalate (BTCoOx-Gly), by solvent free mechanochemical method. Characterization of synthesized materials by various techniques, dielectric measurement and measurement of second
harmonic generation are also done.
II. MATERIALSANDMETHODS
2.1 Materials
In the present study cobalt acetate (assay 99%), oxalic acid (assay 99%), thiourea (assay 99%), glycine (assay 99%) and other required chemicals are of analytical grade, obtained from Research Laboratories Pvt. Ltd. Mumbai, Merck Specialties Pvt. Ltd. Mumbai, HIMEDIA Laboratories Pvt. Ltd. Mumbai, India respectively and were used without further purification.
2.2 Characterization techniques
Analysis of CHN was carried out using CHNS analyser, Flashea, 1112 series make Thermo-Electron Corporation.
Sulphur analysis by VarioEL CHNS analyser Mode. S. N. 11059102. Metal contents were determined by using known methods [18]. Pure and glycine doped BTCoOx were analyzed using Shimadzu FTIR-8400, Infrared spectrometer by
KBr pellet technique in the range 400-4000cm.-1. The FTIR spectroscopy studies were used to analyze qualitatively the
presence of functional groups in synthesized compounds and to determine thebonding between metal and thiourea. The
incorporation of glycine in compounds was also confirmed by FTIR spectra. The EDAX analysis has also been carried
out to confirm the presence of dopant in the material. JOEL-JSM-6360A scanning electron microscope was used.
Simultaneously morphology of compound was studied by using the same instrument. Thermogravimetric and differential thermal analysis was carried out by Shimadzu TG/DTA-60H thermal analyzer. Simultaneous
thermogravimetric and differential thermal analysis was carried out between 20 oC to 900 oC at a heating rate 10 oC/min.
in the air atmosphere. The optical transmittance spectrum was recorded using Shimadzu UV-1601 Spectrophotometer within the range of 200-1000nm. Dielectric measurements of compounds were carried out using HIOKI HITESTER model 3532-50 LCR meter. Nonlinear optical property was studied by measuring second harmonic generation (SHG) efficiency using modified Kurtz-Perry Powder technique [19]. Syntheses of compounds were carried out by solvent free mechanochemical method.
III.EXPERIMENTALWORK 3.1 Synthesis of pure and glycine doped bisthiourea cobalt (II) oxalates
In solvent free mechanochemical method, for pure compound, cobalt acetate tetrahydrate, oxalic acid, and thiourea were taken in stoichiometric ratio ( 1:1:2) while for glycine doped compound ratio was (1:1:2:0.5). Firstly cobalt acetate and oxalic acid in ratio (1:1) taken in agate mortar and mixture was hand ground for 15 minutes at room temperature to obtain semisolid paste of metal oxalate hydrate and acetic acid as by-product. Then 2 part thiourea was added and hand grinding process was continued for next 30 minutes. Thiourea coordinates with cobalt oxalate to form bisthiourea cobalt oxalate. This compound was frequently grinded and dried in air. After one hour, most of acetic acid
byproduct goes off from the reaction mixture and semisolid mass gradually turn into fine powder. This is pure
compound, bisthiourea cobalt oxalate. Similarly doped compound was prepared by adding 0.5 part glycine to semisolid paste of bisthiourea cobalt oxalate and hand grinding process was continued for next 20 minutes. Glycine coordinates with bisthiourea cobalt oxalate to form glycine doped bisthiourea cobalt oxalate. The reactions can be shown
as-Co(CH3COO)2.4H2O + C2H2O4.2H2O Co(C2O4) 4H2O + 2CH3COOH + 2H2O (1) Co(C2O4) 4H2O + 2[CS(NH2)2] Co[CS(NH2)2 ]2C2O4. 2H2O + 2H2O (2)
2Co[CS(NH2)2 ]2C2O4. 2H2O + NH2CH2COOH
Vol. 5, Issue 2, Februray 2016
3.2 Dielectric study of the materials
Dielectric study was carried out using instrument, HIOKI HITESTER model 3532-50 LCR meter. The surface of sample pellet was coated with silver paste for firm electrical contact. The capacitance was measured at room temperature in the frequency range 100Hz to 5MHz.
IV.RESULTSANDDISCUSSION 4.1 Elemental analysis
The observed values of elements are in good agreement with calculated values (Table 1). The result of elemental analysis confirmed the stoichiometry and hence the molecular formula of synthesized compounds, BTCoOx, BTCoOx-Gly.
Table 1. Elemental analysis of pure and glycine doped bisthiourea Cobalt oxalates.
Sr. No.
Complex Metal Carbon Hydrogen Nitrogen Sulphur
Cal. (%)
Obs. (%)
Cal. (%)
Obs. (%)
Cal. (%)
Obs. (%)
Cal. (%)
Obs. (%)
Cal. (%)
Obs. (%)
1 Co[CS(NH2)2]2.
C2O4. 2H2O 17.57 17.44 14.33 14.20 3.60 3.72 16.71 16.49 19.13 19.08
2 Co[CS(NH2)2]2C2O4.
1/2NH2CH2COOH.
1H2O
16.61 17.68 16.92 16.22 3.55 4.23 17.76 19.31 18.07 19.95
4.2 Fourier trasnform infrared spectral analysis
The FTIR spectroscopy studies were used to analyze qualitatively the presence of functional groups in synthesized compounds. FTIR spectrum of pure and glycine doped bisthiourea Co oxalates are shown in Fig. 1.
Fig.1. FTIR spectrum of (a) BTCoOx (b) BTCoOx-Gly
The comparison of assignments of various internal modes observed in these FTIR spectra with thiourea in the region
Table 2. Assignment of IR band frequencies (cm-1) of thiourea and complexes
Thiourea (cm-1)
BTCoOx (cm-1)
BTCoOx-Gly (cm-1)
Assignment
3376 3383 3390 υs (NH2)
3167 3186 3178 υs (NH2)
1627 1615 1624 δ (NH2)
1472 1418 1422 υs (C=S)
1089 1096 1089 υs (C-N)
740 732 726 υs (C=S)
494 514 494 δs (C-N-S)
Extra peaks - 907 CH2 - rocking
υs= symmetric stretching, υas= asymmetric stretching, δs= symmetric bending
In the complexes, there are two possibilities by which the coordination of metals Co with thiourea can occur. The coordination with metals may occur either through nitrogen or through sulphur of thiourea [20]. The high frequency
N-H absorption bands in the region 3100- 3400cm-1 in spectrum of thiourea have not been shifted to lower frequencies
on the formation of metal thiourea complex which indicates that bonding is only between metal (Co) and sulphur
atoms and not of metal and nitrogen [21].The bands observed in the region 3000-3500cm-1 in FTIR spectra are
characteristics of NH2 symmetric and asymmetric stretching vibrations and are in agreement with other compounds
containing thiourea molecules [22-23]. The strong NH absorption peaks at 3279cm-1 and 3249cm-1 in the spectrum of
glycine doped compounds BTCoOx which may increases with doping. As glycine is doped, more NH stretch vibrations are introduced resulting in strong NH absorption peak. The strong band at 1627cm-1 of thiourea corresponds to the
bands at 1615cm-1 of pure BTCoOx and 1624cm-1of glycine doped BTCoOx which is attributed to NH2 bending
vibration. The peak at 1472cm-1 and 740cm-1 assigned to C=S stretching vibration in thiourea is shifted to 1418cm-1,
1422cm-1 and 732cm-1, 726cm-1 in pure BTCoOx and glycine doped BTCoOx compounds respectively. Thus doping of
BTCoOx with glycine is indirectly established through the shift in peaks. From the FTIR spectra of glycine doped BTCoOx there is additional peak appeared at 907cm-1, it is mainly because of presence of glycine which is in agreement with earlier report by N. R. Dhumane et al. [24].
4.3 Scanning electron microscope (SEM) and Energy dispersive X-ray analysis (EDAX)
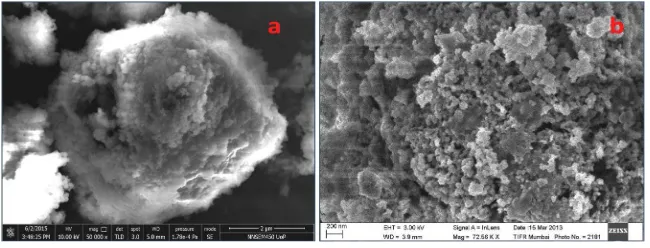
Scanning electron microscope (SEM) analysis was carried out to investigate the morphology of compounds. The SEM
images of pure and glycine doped BTCoOx compounds are shown in Fig. 2(a), (b).It shows that both compounds are
porous and agglomerated in nature.
Energy dispersive X-ray analysis (EDAX) is important tool for determining the elements present in the compounds.
Vol. 5, Issue 2, Februray 2016
The recorded EDAX spectra for pure and glycine doped BTCoOx are shown in Fig.3. (a) and (b) respectively which confirms the presence of glycine in the compounds.
4.4. Thermal analysis
Thermogravimetric analysis (TG) anddifferential thermal analysis (DTA) gives information regarding phase transition,
water of crystallization and different stages of decomposition of the materials [25]. Fig. 4 (a) shows TG and DTA curves of BTCoOx.
1 0 0 2 0 0 3 0 0 4 0 0 5 0 0 6 0 0 7 0 0 8 0 0 9 0 0
1 0 2 0 3 0 4 0 5 0 6 0 7 0 8 0 9 0 1 0 0 1 1 0
7 0 .6 6 %
2 5 5 .0 7OC
8 9 .2 7 %
1 8 7 .5 0OC
4 5 .7 2 %
3 8 6 .8 2OC
3 4 .8 3 %
4 3 4 .9 5OC
2 4 .7 5 %
5 2 3 .2 8OC
2 2 .7 5 %
7 0 9 .2 2OC
1 6 7 .2 0OC 2 1 3 .8 7OC
3 0 8 .3 0O
C 4 7 2 .5 8O
C
4 0 2 .5 2OC
1 0 0 % (1 3 4 .6 6OC )
b a
D T A u V a = T G
b = D T A
W
e
ig
h
t
lo
s
s
(
%
)
T e m p e ra tu re (OC )
-4 0 -3 0 -2 0 -1 0 0 1 0 2 0 3 0
It is seen that TG curve plateau upto 134 oC suggesting that compound is thermally stable upto 134 oC. Two stage
decomposition of BTCoOx is observed. In the first stage from temperature 134 oC dehydration of BTCoOx takes place
which is followed by decomposition of thiourea upto 386oC. In this stage weight loss is 54.28%. This weight loss is attributed to water of crystallization and release of remaining acetic acid as by-product upto 167 oC and after this temperature thiourea molecules. The acetic acid molecules easily volatilized into air during the process of hand
grinding. However, it has boiling point of 118 oC, so remaining acetic acid can only be totally removed at a temperature
Fig. 3. EDAX of (a) BTCoOx (b) BTCoOx-Gly
higher than its boiling point. Endothermic peak at 213 oC temperature registered on DTA was assigned to
decomposition of thiourea molecule. From temperature 134 oC to 386 oCweight loss is attributed to decomposition of
thiourea molecule coordinated to Co into carbondisulphide (CS2), isothiocyanic acid (HNCS), and ammonia (NH3)
[26].
In the second stage from temperature 386 oC to 709 oCdecomposition of oxalate moiety CoC2O4 of BTCoOx to cobalt
oxide (CoO) takes place. The 22.97% weight loss is observed in TG curve which is attributed to elimination of CO2 and
CO gases. This is seen in terms of sharp exothermic peak at 402 oCand broad exothermic peak at 472 oCin DTA curve.
The final stable product CoO is formed at 709 oC.
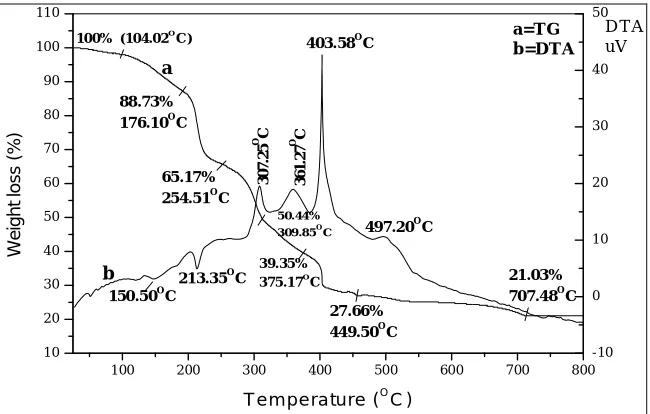
Fig. 4 (b) shows TG and DTA curves of BTCoOx-Gly. This compound also shows two stage decomposition. In first
stage from temperature 104 oC dehydration of BTCoOx-Gly takes place which is followed by simultaneous
decomposition of thiourea and glycine upto 375 oC.
1 00 2 00 3 00 400 50 0 60 0 7 00 8 00
1 0 2 0 3 0 4 0 5 0 6 0 7 0 8 0 9 0 10 0 11 0
21 .03 % 70 7.4 8OC 27 .66 %
44 9.5 0OC
3 9.35 %
3 75 .1 7O
C 5 0.44 % 3 09 .8 5O
C 3 0 7 .2 5 O C 3 6 1 .2 7 O C
49 7.2 0OC 4 03.58OC
21 3.3 5OC 150 .5 0O
C 88 .73 % 17 6.1 0OC
65 .17 % 25 4.5 1OC
10 0% (10 4.0 2O
C )
b a
a= T G b = D T A
D T A u V W e ig h t lo s s ( % )
T e m p e ra tu re (OC )
-10 0 1 0 2 0 3 0 4 0 5 0
In this stepweight loss is 60.65%. This loss is attributed to water of crystallization and release of remaining acetic acid
as by-product upto 150 oC and after this temperature thiourea molecules. Endothermic peak at 213 oC registered on
DTA was assigned to decomposition of thiourea molecule. From temperature 104 oC to 375 oC weight loss is attributed
to decomposition of thiourea molecule coordinated to Co into CS2, HNCS and NH3 and simultaneously decomposition
of dopant glycine molecule takes place within the same temperature range as that of thiourea [[27]. In the second stage
from temperature 375 oC to707 oC decomposition of oxalate moiety CoC2O4 of BTCoOx-Gly to cobalt oxide (CoO)
takes place. The 18.32% weight loss is observed in TG curve which is attributed to elimination of CO2 and CO gases.
This is seen in terms of sharp exothermic peak at 403 oC and broad exothermic peak at 497 oC in DTA curve. The final
stable product CoO is formed at 707 oC.
From the thermal study, it is observed that, BTCoOx is more stable than BTCoOx-Gly.
4.5 Optical transmittance studies
Transmission spectra are very important for any NLO materials because a nonlinear optical material can be of practical use only if it has wide transparency window. To find the transmission range, optical transmission spectrum is recorded in the region 200-1000nm. The transmittance spectrum of pure and glycine doped BTCoOx complexes recorded in the UV-Visible region are shown in Fig.5. The lower UV cut-off wavelength of BTCoOx is 300nm while BTCoOx-Gly shows 287nm. The lower UV cut-off wavelength in doped material is lower than pure complex which shows wide
Vol. 5, Issue 2, Februray 2016
transmission range in the entire visible region which is essential requirement for nonlinear optical material. It adds the advantage in the field of optoelectronic applications [28].
2 0 0 3 0 0 4 0 0 5 0 0 6 0 0 7 0 0 8 0 0 9 0 0 1 0 0 0
0 1 0 2 0 3 0 4 0 5 0 6 0 7 0 8 0 9 0 1 0 0 1 1 0 1 2 0
b a
T
ra
n
s
m
it
ta
n
c
e
(
%
)
W a v e le n g th ( n m )
Fig. 5. UV-VISIBLE spectrum a) BTCoOx b) BTCoOx-Gly
4.6 Dielectric study
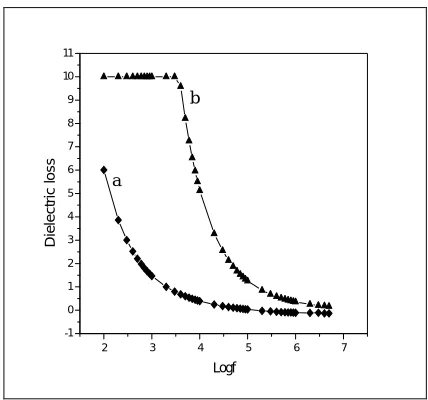
Dielectric properties are correlated with electro-optical properties of compounds [29]. Dielectric constant is one of the basic electrical properties of solids. It is the measure of how easily a material is polarized in an external electric field [30]. The variation of dielectric constant and dielectric loss with frequency for pure and glycine doped BTCoOx is shown in fig. 6 and 7. From the figure both dielectric constant and dielectric loss of materials decreases with increase in frequency. As the frequency increases dielectric constant decreases very rapidly and then slowly as frequency increases. This type of variation suggests high space charge polarizability at the lower frequency region. This behaviour is due to electronic exchange of number of ions in the compound giving local displacement of electrons in the direction of applied field, which gives the polarization. As the frequency increases, a point is reached where the space charge cannot sustain and comply with external field. This behaviour is similar to that of observed in zinc tartarate [31] and strontium tartarate [32]. The dielectric constant of pure and doped BTCoOx becomes almost constant over 200000Hz. Thus dielectric constant is low at high frequency. This is due to the fact that at higher frequencies the ionic and electronic polarizations are active [33].
According to Miller rule, the lower values of dielectric constant are a suitable parameter for enhancement of SHG
coefficient [34]. Glycine doped BTCoOx has low dielectric constant as compared to pure compound due to high
molecularizability of glycinate ion (NH2CH2COO-) in the compound.
1.5 2.0 2.5 3.0 3.5 4.0 4.5 5.0 5.5 6.0 6.5 7.0 7.5 0.0
0.2 0.4 0.6 0.8 1.0 1.2 1.4 1.6 1.8 2.0 2.2 2.4 2.6 2.8
b
a
D
ie
le
c
tr
ic
c
o
n
s
ta
n
t
Logf
Fig. 6. Variation of dielectric constant with log frequency (a) BTCoOx (b) BTCoOx-Gly
Dielectric loss was also studied with various frequencies at room temperature. From fig.7, it is observed that as the frequency increases the dielectric loss decreases. For fig.7 (b) glycine doped BTCoOx, dielectric loss remain constant from 100Hz to 3000Hz frequency and then it decreases with increase in frequency. The characteristic of low dielectric loss at high frequency for pure and doped BTCoOx suggests that compounds posses good optical quality with lesser defects and this parameter is of vital important for nonlinear optical applications.
2 3 4 5 6 7
-1 0 1 2 3 4 5 6 7 8 9 10 11
b
a
D
ie
le
c
tr
ic
l
o
s
s
Logf
Fig. 7. Variation of dielectric loss with log frequency BTCoOx (b) BTCoOx-Gly
4.7 Second harmonic generation (SHG) efficiency
Vol. 5, Issue 2, Februray 2016
was confirmed by emission of green radiation (λ=532nm). SHG efficiency was measured with respect to potassium
dihydrogen phosphate (KDP) as reference material. It is observed that glycine doped BTCoOx exhibit SHG conversion efficiency (92.15%) which confirmed the nonlinear nature of material. BTCoOx-Gly shows better efficiency than pure BTCoOx. However, it was found that efficiency of BTCoOx-Gly was 0.443times lower than that of KDP. The SHG activity is due to non-centrosymmetric structure of compound. The increased SHG efficiency can be taken as better candidate for NLO applications [28].
V. CONCLUSIONS
The complexes such as BTCoOx and BTCoOx-Gly are synthesized by solvent free mechanochemical method. FTIR
spectrum determines the various functional groups present in the compounds. The peak at 1412cm-1 and 740cm-1
assigned to C=S stretching vibration in thiourea is shifted to 1422 cm-1 and 726 cm-1 in BTCoOx-Gly. Thus shifting in
bands gives indirect evidence for doping of glycine in BTCoOx. FTIR spectrum of BTCoOx-Gly also shows additional
peaks at lower frequency 907cm-1 which is because of presence of glycine in compound. Transmittance spectra reveal
that lower UV cut-off wavelength for glycine doped BTCoOx is lower than pure compound which indicates material has good optical transmittance in entire visible region. Dielectric measurements of compounds shows very low dielectric constant and dielectric loss at higher frequencies indicating good optical quality with less defects in the samples. SHG efficiency of BTCoOx-Gly was found to be 0.443 times lower than that of KDP as reference which confirmed nonlinear optical nature of material and makes it a potential material for NLO applications.
ACKNOWLEDGEMENT
The author is thankful to Prof. P. K. Das , IPC lab of Indian Institute of Science, Bangalore, India for the SHG facility.
REFERENCES
[1] Chemla, D. S., and Zyss, J., “Nonlinear Optical Properties of Organic Molecules andCrystals”, Academic press, London, Vol. 2,Appendix I , PP. 221, 223, 247, 1987.
[2] Marcy, H. G., Waarren, L. F., Webb, M. S., Ebbrs, C. A., Velslo, S. P., Kennedy, G. C., and Catela, G. C, “Second- Harmonic Generation in Zinc Tris (thiourea) Sulfate” , Appl. Opt.,Vol. 31, Issue 24, PP. 5051-5060, 1992.
[3] Hou, B. W., Jang, M. H., Yuan, D. R., Xu, D., Zhang, N., Liu, M. G., and Tao, “The Preparation and Characterization of a New Organometallic Nonlinear Optical Material-Triallyl (thiourea) Mercury Bromide (ATMB)”, Mater, Res. Bul., Vol. 28, PP. 645-653, 1993. [4] Xing, G., Jiang, M., Shao, Z., Xu, D., “Bis (thiourea) Cadmium Chloride: A Novel NLO Crystal”, Chin, J. Lasers, Vol. 14, PP. 357-364, 1987. [5] Venkataraman, V., Subramaniam, C. K.., Bhatt, H. L., “Laser Induced Damage in Zinc Tris (thiourea) Sulfate and Bis (thiourea) Cadmium
Chloride”, J. Appl. Phys., Vol. 77, PP. 6049-6051, 1995.
[6] Ramajothi, J., Dhanuskodi, S., Nagarajan, K., “Crystal Growth, Thermal, Optical and Microhardness Studies of Tris (thiourea) Zinc Sulphate: A Semiorganic NLO Material”, Cryst. Res. Technol. Vol. 39, PP. 414-420, 2004.
[7] Ramabadran, U. B., Zelmon, D. E., Kennedy, G. C., “Electro‐optic, Piezoelectric, and Dielectric Properties of Zinc Tris (thiourea) Sulfate”, Appl. Phys. Lett., Vol. 60, Issue 21, PP. 2589-2591, 1992.
[8] Hellwege, K. H., Hellwege, A. H., “Diamagnetic Molecules’’, Landolt-Bornstein, Group- II, Vol. 14, ISBN: 978-3- 540-11365-2 , PP. 584, 1982.
[9] Venkataramanan, V., Dhanaraj, G., Wadhawan, V. K., Sherwood, J. N., Bhat, H. L., “Crystal Growth and Defects Characterization of Zinc Tris (thiourea) Sulfate: A Novel Metalorganic Nonlinear Optical Crystal”, J. Cryst. Growth, Vol. 154, PP. 92-97, 1995.
[10] Rajasekaran, R., Ushashree, P. M., Jayavel, R., Ramasamy, P., “Growth and Characterization of Zinc Thiourea Chloride (ZTC): A Semiorganic Nonlinear Optical Crystal”, J. Cryst. Growth, Vol. 229, No. 1- 4, PP. 563-567, 2001.
[11] Ushashree, P. M., Muralidharan, R., Jayavel, R., and Ramasamy, P., “Growth of Bis (thiourea) Cadmium Chloride Single Crystal: A potential Nonlinear Optical Material of Organometallic Complex”, J. Cryst. Growth, Vol. 218, Issue 2, PP., 365-371, 2000.
[12] Kannan, V., Rajesh, N. P., Bairava Ganesh, R., Ramasamy, P., “Growth and Characterization of Bisthiourea- Zinc Acetate: A New Nonlinear Optical Material”, J. Cryst. Growth,Vol. 269, Issue 2-4, PP. 565-569, 2004.
[13] Pal, T., Kar, T., “Optical, Mechanical and Thermal Studies of Nonlinear Optical Crystal L-Arginine Acetate”, Mater. Chem. Phys., Vol. 91, Issue 2-3, PP. 343-347, 2005,
[14] Malik, T., Kar, T., Bocelli, G., Musatti, A.,“Structural and Thermal Characterization of L-Arginine Dihydrate: A Nonlinear Optical Material”, Cryst. Res. Technol., Vol. 41, Issue 3, PP. 280-284, 2006.
[15] Parikh, K. D., Dave, D. J., Parekh, B. B., Joshi, M. J., “FT-IR and SHG Efficiency Studies of L-Arginine Doped KDP Crystals”, The Bulletin of Materials Science, Vol. 30, Issue 2, PP. 105-112, 2007.
[17] Dhumane, N. R., Hussaini, S. S., Dongre, V. G., Shirsat Mahendra, D., “ Influence of Glycine on the Nonlinear Optical (NLO) Properties of Zinc Tris (thiourea) Sulfate (ZTS) Single Crystal”, Optical Materials, Vol. 31, Issue 2, PP. 328-332, 2008.
[18] Vogel, A., “A Textbook of Quantitative Inorganic Analysis”, II Ed., Longman London, 1951.
[19] Kurtz, S. K., Perry, T. T., “A Power Technique for the Evaluation of Nonlinear Optical Materials”, J. Applied Physics, Vol. 39, PP. 3798, 1968.
[20] Ushashree, P. M., Jayavel, R., Subramanian, C., Ramasamy, P., “Coordination With Metal”, Bull. Electrochem., Vol. 14, PP. 407-410, 1998. [21] Nakamoto, K., “IR Spectra of Inorganic and Coordination Compounds”, II Ed, Wiley, New York, 1978.
[22] Kim, K. T., Kim, J. J., “Raman Studies of Thiourea [SC(NH2)2] Crystal”, Ferroelectrics, Vol. 105, Issue 1, PP. 243- 248, 1990.
[23] Abraham, S., Aruldhas, G., “Infrared and Polarized Raman Spectra of M(HCOO)2. 2(NH2)2CO [M is Cd, Mn]”, Spectrochim. Acta A, Vol. 51, PP. 79, 1995.
[24] Dhumane, N. R., Hussaini, S. S., Dongare, V. G., Karmuse, P. P., and Shirsat, M. D., “ Growth and Characterization of Glycine Doped Bis (thiourea) Cadmium Chloride Single Crystal”, Cryst. Res. Technol, Vol. 44, Issue 3, PP. 269-274, 2009.
[25] Meng, F. Q., Lu, M. K., Yang, Z. H., Zeng, H., “Thermal and crystallographic properties of a New NLO Material, Urea-(d) Tartaric Acid Single Crystal”, Mater. Lett., Vol. 33, Issue 5-6, PP. 265-268, 1998.
[26] Wang, S., Gao, Q., Wang, J., “Thermodynamic Analysis of Decomposition of Thiourea and Thiourea Oxide”, J. Phys. Chem. B Vol. 109, PP. 17281-17289, 2005.
[27] Hussaini, S. S.,Dhunane, N. R., Dongare, V. G., Shirsat, M. D., “Effect of Glycine on the Optical Properties of Zinc Thiourea Chloride (ZTC) Single Crystal”, Optoelectronics and Advanced Materials-Rapid Communications, Vol. 2, Issue No. 2, PP. 108-112, 2008.
[28] Bairava Ganesh, R., Kannan, V., Sathyalakshmi, R., Ramasamy, P., “The Growth of L-Glutamic Acid Hydrochloride Crystals by Sankaranarayanan–Ramasamy (SR) method”, Mater. Lett., Vol. 61, Issue 3, PP. 706- 708, 2007.
[29] Boomadevi, S., Dhanasekaran, R., “Synthesis, Crystal Growth and Characterization of L-Pyrrolidone-2- Carboxylic Acid (L-PCA) Crystals”, J. Gryst. Growth, Vol. 261, Issue 1, PP. 70-76, 2004.
[30] Goma , S., Padma, C. M., Mahadevan, C. K., “Dielectric Parameters of KDP Single Crystals Added With Urea”, Mater Lett., Vol. 60, Issue 29-30, PP. 3701-3705, 2006.
[31] Lopez, T., Stockel, J., Peraza, J., Torres, M. E., and Yanes, A. C., “Infrared Spectroscopic, Thermal and Electromagnetic Studies of Zinc Tartrate Single Crystals Grown by the Silica-Gel Technique”, Cryst. Res. and Technol., Vol. 30, Issue 5, PP. 677-683, 1995.
[32] Arora, S. K., Patel, V., Amin, B., and Kothari, A.,“Dielectric Behaviour of Strontium Tartrate Single Crystals”, Bull. Mater. Sci., Vol. 27, Issue 2, PP. 141-147, 2004.
[33] Rajendran, V., Gnanam, S., “Growth and Characterization of Urea Lead Nitrate (ULN) Single Crystal by Slow Evaporation Process”, Der. Pharma Chemica, Vol. 3, Issue 6, PP. 606, 2011.