ISSN(Online): 2319-8753 ISSN (Print): 2347-6710
International Journal of Innovative Research in Science,
Engineering and Technology
(A High Impact Factor & UGC Approved Journal) Website: www.ijirset.com
Vol. 6, Issue 8, August 2017
PMU Implementation in a Modern Power
System
Prabhash Nanda 1, C.K.Panigrahi 2, Abhijit Dasgupta 3
Research Scholar, School of Electrical Engineering, KIIT University, Bhubaneswar, India1
Professor, School of Electrical Engineering, KIIT University, Bhubaneswar, India2
Professor, School of Electrical Engineering, KIIT University, Bhubaneswar, India3
ABSTRACT: Communication between consumer and supplier in both the direction is the essence of Smart Grid. For such two way communication, advanced sensors are being used in the present grid to collect and analyze data from the grid network. Moreover, Critical events in the grid require real-time identification and real time response. Phasor Measurement Unit(PMU) is such an intelligent sensors which can help in making of a modern power system.
Real time Data from field is of utmost importance to resolve any power quality issues in a large area. Again, more attention in current study has been made to implement Phasor Measurement Unit (PMU) for recording the real time data, voltage, current signal at various places in a power network. Out of various techniques used for Phasor estimation, Non-recursive Discrete Fourier Transform (DFT) algorithm has been used in this paper due to its stability. Simulation of PMU implementation is done by making a PMU model on NI LabVIEW platform.
KEYWORDS:Phasor measurement unit, Smart Grid; non-recursive DFT algorithm, NI LabVIEW
I. INTRODUCTION
To gain more reliability in modern day power system, more advanced sensors and monitoring systems are being implemented in the field. Wide Area Measurement Systems (WAMS) is an example where Synchrophasors/ PMU are the key monitoring system. Phasor Measurement Units (PMU) gives the phasor values of both voltage and current. To make a large area of power system observable at a particular time, the phasor outputs from all the PMUs in the area are GPS time stamped. The monitoring of the grid on real-time basis can ensure a more stable grid operation. With all the features mentioned above , PMU becomes an obvious choice which can make the power system fully observable with respect to voltage, current and power flow between buses . The data obtained from the PMUs can be used for complete analysis of the power system. Therefore, PMU is one of the key constituent in modern power system or the Smart Grid(SG) system.
Major constraint in PMU implementation is its cost which is very high at present therefore they need to be placed optimally to make the whole power system observable. In this regard many algorithms are present in various literature. A brief literature survey related to present work is presented here.
PMU basics, Phasor estimation techniques viz.DFT Algorithm and various applications of PMU are presented in [1]. Application of PMU the grid system is also presented in [2][4]. Simulation and Implementation of PMU by use of MATLAB software is given in [3]. Use of FACTS controllers with PMU is described in [4]. Transmission line faults protection is presented in [5]. Monitoring of Power system by using Microprocessors is described in [6].Various PMU algorithms based on wide frequency range are presented in [7].
At present, Supervisory Control and Data Acquisition (SCADA) system is being used widely in the remote terminal unit (RTU) for monitoring. But, SCADA has following shortcomings:
The necessary data from various locations are not taken precisely at the same instant.
The magnitude of voltage (V), Active Power (P), Reactive power (Q) do not change hurriedly except under the condition of large disturbance. So the close monitoring could not be achieved during disturbance and transients.
ISSN(Online): 2319-8753 ISSN (Print): 2347-6710
International Journal of Innovative Research in Science,
Engineering and Technology
(A High Impact Factor & UGC Approved Journal) Website: www.ijirset.com
Vol. 6, Issue 8, August 2017
PMU’s overcome the above shortcomings and give time synchronised phasor values of voltages & currents.
The main objective of this paper is to present modelling and implementation of PMU using DFT Non-recursive Algorithm by using National Instruments LabVIEW software. Paper is organized as follows. Section II describes in brief about the Phasor Measurement Unit (PMU) and III describes about the phasor estimation techniques, especially the non-recursive DFT technique used in this paper for PMU modelling. The flow diagram represents the step of the algorithm. Section IV presents the simulation result of the PMU model working validated by the mathematical analysis. Finally, Section V presents conclusion.
II. PHASOR MEASUREMENT UNIT (PMU)
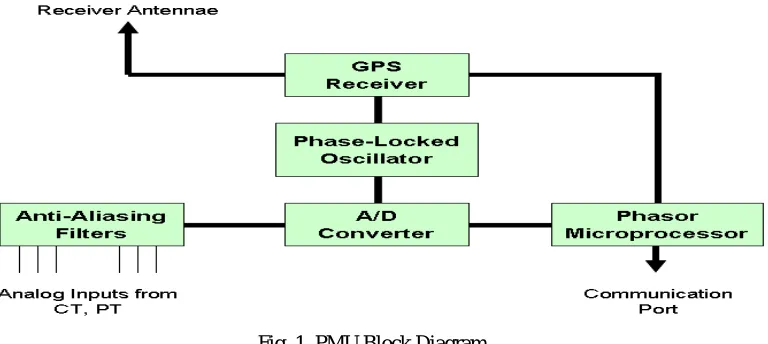
To gain more reliability in a modern power system, PMUs are getting more scope to be used widely. Its a device (Synchrophasor) which measures ‘Magnitude’ & ‘Phase’ of the electrical signals in a power system[8-9]. The time stamping of the phasors with respect to an extremely precise and accurate time reference enables the PMUs to provide real-time measurement of necessary electrical data across the power system. The block diagram of PMU is given in Fig. 1.3. These synchrophasors are transmitted to the nearest receiver at a speed up to 60 sample/sec. The real-time monitoring of the power system is getting more importance for ensuring the stable operations[10].Therefore, for full observability of power system, PMU has become a necessity.
Fig. 1. PMU Block Diagram
At present PMUs are costly to be placed at every bus in the system. Therefore, the number of PMUs are to be kept minimum so that costing can be as low as possible. Complete observability by using minimum numbers of PMU in a network is taken care by the optimization techniques.
III.PMUMODELLING
1. Phasor Estimation Technique
In Literature, there are various methods used for phasor estimation. Some of the phasor estimation techniques are mentioned below:
Zero Crossing
Discrete Fourier Transformation(DFT)
Sliding DFT
Least Error Squares
Kalman Filters
ISSN(Online): 2319-8753 ISSN (Print): 2347-6710
International Journal of Innovative Research in Science,
Engineering and Technology
(A High Impact Factor & UGC Approved Journal) Website: www.ijirset.com
Vol. 6, Issue 8, August 2017
Phasor measurement angle changing
2. Discrete Fourier Transformation(DFT)
Out of all the above methods for phasor estimation, DFT technique has been used in this research for modelling of PMU with the help of NI LabVIEW software.
DFT is used when the signals are known only at N instants separated by a sample times T(i.e. a finite sequence of data). DFT converts a time domain signal to frequency domain without making any changes in the information carried by the input signal.
DFT has two types of estimation techniques depending upon the use of data from the previous window. The two types of algorithms are recursive and non-recursive .The recursive DFT algorithm takes the reference of previous data window while the non-recursive algorithm do not take any reference of previous data. Therefore, rrecursive DFT algorithm computational time is more which makes it rather unstable. While the Non-recursive DFT algorithm is more stable and requires relatively lesser computational time and therefore it has been used in research for implementation of PMU.
3. Non-Recursive DFT Algorithm
In non-recursive DFT (NDFT) algorithm all the phasor estimate are considered from a fresh window and the reference from previous window data are not considered[12]. A sinusoid can be written as in (1).
(1)
The above sinusoid is represented in Phasor form as mentioned below in (2)
(2)
If, M is number of samples per cycle in a 50 Hz signal then the phasor estimate is given by the (3) below:
gle SamplingAn M where m M m xm 2 , ) sin( 2 ) 2 sin( 2 (3)
Therefore, phasor estimate of successive window of Mth and (M-1)th phasor samples are given below in (4) and (5):
(4)
(5)
The sampling frequency is M * fundamental frequency. The two successive windows of sample (m) and (m-1) are selected and the phasor values are calculated by using NDFT algorithm.
By taking the mathematical values , let the number of samples(M) is 12, so sampling angle ɵ = (2π/12) = 30° (φ) is the angle for first sample window. Next sample window will have angle (φ +ɵ) i.e. 60° and so on. Final phasor estimate is obtained by averaging all the phasor values. It shows that there is no change in the magnitude of the phasor value while the phase angle θ only changes for each window in anticlockwise direction by an angle equal to sampling angle. The flowchart of non-recursive DFT algorithm is shown in the Fig.2.
)
(sin
2
)
(
t
X
t
x
)
sin
(cos
j
X
j
e
X
X
m
m
m m j M m m e x M
x
2 .
1 0 1 m m j M m me x M
x
ISSN(Online): 2319-8753 ISSN (Print): 2347-6710
International Journal of Innovative Research in Science,
Engineering and Technology
(A High Impact Factor & UGC Approved Journal) Website: www.ijirset.com
Vol. 6, Issue 8, August 2017
Fig.2. Flowchart for Non-recursive DFT Algorithm
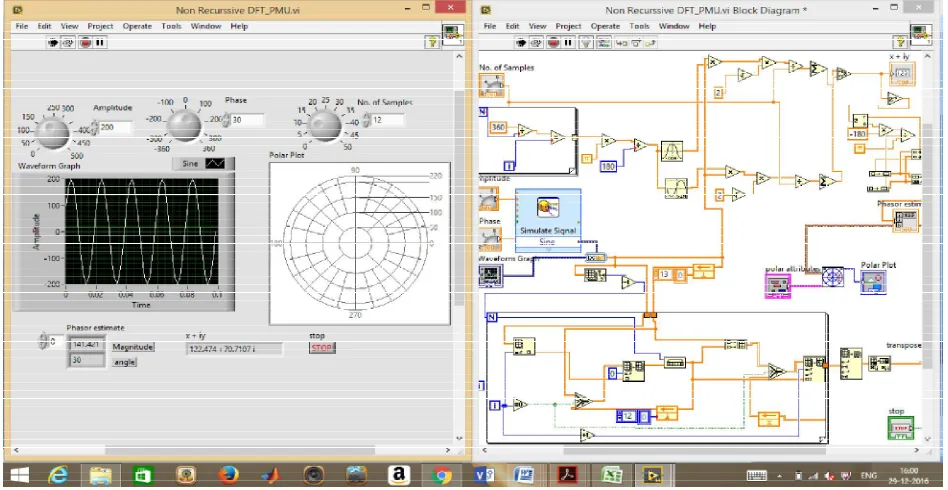
Fig. 3. LabView Model for Single Phase Non-recursive Algorithm
IV.PMUMODELLING WITH LABVIEW
LabVIEW[13] software from National Instruments is used for simulation in this paper. The programs made on LabVIEW are called Virtual Instruments (VI). In the algorithm used for non-recursive DFT phasor estimation, the input signal is generated from library VI i.e. Simulate Signal VI. The signal can also be real time acquired by any data
Input Signal
A/D conversion at a sampling rate of f0× M Hz
Get the samples in every window
Phasor = Average(√2 ×Xm) ×e⁻ᶨᶱ
Where n=0, 1, 2... (M-1), θ= (2π/M)
ISSN(Online): 2319-8753 ISSN (Print): 2347-6710
International Journal of Innovative Research in Science,
Engineering and Technology
(A High Impact Factor & UGC Approved Journal) Website: www.ijirset.com
Vol. 6, Issue 8, August 2017
acquisition platform which is compliant with LabVIEW like NI cRIO. As per the algorithm used , the phasor calculation is converted into polar form and displayed along with the complex output. The algorithm is repeated for subsequent data samples.
As newer estimate of phasor are performed, the phasor rotates anticlockwise by an angle Ө due to delay of each sample by one sampling angle. The non-recursive LabVIEW model is given in the Fig. 3, where both the Front panel and block diagram are shown.
V. PMUMODEL SIMULATION RESULT VALIDATED WITH MATHEMATICAL ANALYSIS
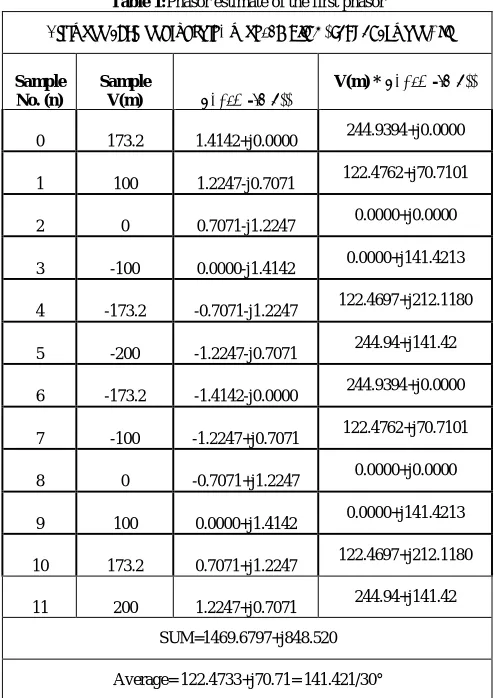
In the Fig. 3, knobs are provided in the Front panel to change the values of magnitude, phase angle of the input signal and number of samples so that the model can be in all the conditions. For Simulating a test case , a single phase 230 V , 50Hz system is assumed with a signal, X (t)= 200 cos(100πt+π/6) .The sampling frequency is taken as 600Hz which is 12 samples per cycle . The data window is of 12 samples. It was found that the phasor estimation performed over first waveform cycle of sinusoid i.e. first 12 samples or one complete first cycle has a phasor value 141.421/30° as given in Table 1. Thereafter, First 20 samples are obtained and phasor values are evaluated as per algorithm flowchart mentioned in Fig 2. The phasor values calculated by the use of algorithm is given in the Table 2 .
Table 1:Phasor estimate of the first phasor
V(t)= 200 cos(100πt+π/6), N=12, Sampling Frequency= 600Hz.
Sample No. (n)
Sample
V(m) √2*e^(-jmθ))
V(m) * √2*e^(-jmθ))
0 173.2 1.4142+j0.0000 244.9394+j0.0000
1 100 1.2247-j0.7071 122.4762+j70.7101
2 0 0.7071-j1.2247 0.0000+j0.0000
3 -100 0.0000-j1.4142 0.0000+j141.4213
4 -173.2 -0.7071-j1.2247 122.4697+j212.1180
5 -200 -1.2247-j0.7071 244.94+j141.42
6 -173.2 -1.4142-j0.0000 244.9394+j0.0000
7 -100 -1.2247+j0.7071 122.4762+j70.7101
8 0 -0.7071+j1.2247 0.0000+j0.0000
9 100 0.0000+j1.4142 0.0000+j141.4213
10 173.2 0.7071+j1.2247 122.4697+j212.1180
11 200 1.2247+j0.7071 244.94+j141.42
SUM=1469.6797+j848.520
Average= 122.4733+j70.71= 141.421/30°
ISSN(Online): 2319-8753 ISSN (Print): 2347-6710
International Journal of Innovative Research in Science,
Engineering and Technology
(A High Impact Factor & UGC Approved Journal) Website: www.ijirset.com
Vol. 6, Issue 8, August 2017
Table 2: Phasor estimate of sampling windows
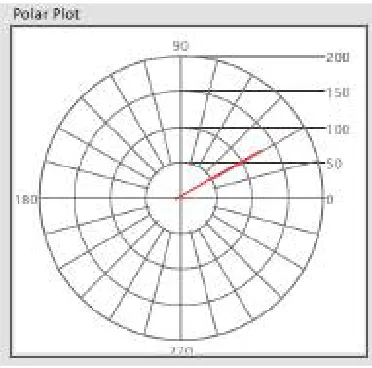
The phasor output in polar form obtained from LabVIEW simulation are shown in Fig. 4 and Fig. 5. From Fig.5, it is clear that the new phasor shifted by 30 degrees anticlockwise from the phasor in Fig. 4.
Fig. 4. Simulation result for first sample window Fig. 5. Simulation result for second sample window
Sampl e No. (n)
Sample X(m)
Phasor Estimate by using Non-Recursive
DFT Algorithm
Remarks
0 173.20 141.421/30°
First 12 samples calculated by using Non-Recursive DFT Algorithm and are found to be same i.e.141.421/30° 1 100.00 141.421/30°
2 000.00 141.421/30° 3 -100.00 141.421/30° 4 -173.20 141.421/30° 5 -200.00 141.421/30° 6 -173.20 141.421/30° 7 -100.00 141.421/30° 8 000.00 141.421/30° 9 100.00 141.421/30° 10 173.20 141.421/30° 11 200.00 141.421/30° 12 173.20 141.421/60°
After 12th sample the magnitude remain constant ,only angle changes. 13 100.00 141.421/90°
ISSN(Online): 2319-8753 ISSN (Print): 2347-6710
International Journal of Innovative Research in Science,
Engineering and Technology
(A High Impact Factor & UGC Approved Journal) Website: www.ijirset.com
Vol. 6, Issue 8, August 2017
VI.CONCLUSION
In this paper, non-recursive DFT algorithm for phasor estimation is used to simulate the data by PMU model made using NI LabVIEW software. The validation of simulated results of PMU model is done by the mathematical analysis and are proven to be identical. This validates the proper functioning of the PMU model which is being utilized in future researches using National Instruments cRIO, a smart grid prototype.
REFERENCES
[1] J. S. Phadke, A.G. and Thorp, "Synchronized Phasor Measurement and Their Application,". Springer, 2008.
[2] Electric Power Research Institute, “Assessment of Applications and Benefits of Phasor Measurement Technology in Power Systems,” GE Power System Engineering, 1997.
[3] Dotta, Daniel, Joe H. Chow, Luigi Vanfretti, Muhammad S. Almas, and Marcelo N. Agostini. "A matlab-based PMU simulator." In Power and Energy Society General Meeting (PES), 2013 IEEE, pp. 1-5. IEEE, 2013.
[4] Singh, Bindeshwar, N. K. Sharma, A. N. Tiwari, K. S. Verma, and S. N. Singh. "Applications of phasor measurement units (PMUs) in electric power system networks incorporated with FACTS controllers." International Journal of Engineering, Science and Technology 3, no. 3, 2011. [5] Neyestanaki, M. Kalantar, and A. M. Ranjbar. "An adaptive PMU-based wide area backup protection scheme for power transmission
lines." IEEE Transactions on Smart Grid 6, no. 3,pp. 1550-1559 , 2015.
[6] Roy, Ayindrila, Jitendranath Bera, and Gautam Sarkar. "A state-of-the-art PMU based monitoring system with Intelligent Electronic Device using microcontroller." In Power and Energy in NERIST (ICPEN), 2012 1st International Conference on, pp. 1-4. IEEE, 2012.
[7] Kamwa, S. R. Samantaray, and G. Joos, “Wide frequency range adaptive phasor and frequency PMU algorithms,” IEEE Transactions on Smart Grid, vol. 5, no. 2, pp. 569–579, 2014.
[8] Pinte, Bogdan, Michael Quinlan, Andy Yoon, Karl Reinhard, and Peter W. Sauer. "A one-phase, distribution-level phasor measurement unit for post-event analysis." In Power and Energy Conference at Illinois (PECI), 2014, pp. 1-7. IEEE, 2014.
[9] Du, Liang, Jin-kai Huang, and Qun-ying Liu. "A Realization of Measurement Unit for Phasor Measurement Unit Based on DSP." In Power and Energy Engineering Conference (APPEEC), 2012 Asia-Pacific, pp. 1-3. IEEE, 2012.
[10] Krishna, R. Vipin, S. Ashok, and Megha G. Krishnan. "Synchronised Phasor Measurement Unit." In Power Signals Control and Computations (EPSCICON), 2014 International Conference on, pp. 1-6. IEEE, 2014.
[11] Mathworks [Online]. Available: http://in.mathworks.com/help/signal/ref/butter.html .
[12] S. Mondal, Ch. Murthy, D. S. Roy, D. K. Mohanta ,” Simulation of Phasor Measurement Unit (PMU) Using Labview ”, 14th International Conference on Environment and Electrical Engineering (EEEIC), DOI: 10.1109/EEEIC.2014.6835857, 2014 .