DOI: 10.1534/genetics.106.064964
Combining Sperm Typing and Linkage Disequilibrium Analyses Reveals
Differences in Selective Pressures or Recombination Rates
Across Human Populations
Vanessa J. Clark,* Susan E. Ptak,
†Irene Tiemann,
‡Yudong Qian,* Graham Coop,*
Anne C. Stone,
§Molly Przeworski,* Norman Arnheim
‡and Anna Di Rienzo*
,1*Department of Human Genetics, University of Chicago, Chicago, Illinois 60637,†Department of Evolutionary Genetics, Max Planck Institute for Evolutionary Anthropology, Leipzig 04103, Germany,‡Department of Computational and Molecular Biology,
University of Southern California, Los Angeles, California 90089 and§School of Human Evolution and Social Change, Arizona State University, Tempe, Arizona 85287
Manuscript received August 17, 2006 Accepted for publication November 15, 2006
ABSTRACT
A previous polymorphism survey of the type 2 diabetes geneCAPN10identified a segment showing an excess of polymorphism levels in all population samples, coinciding with localized breakdown of linkage disequilibrium (LD) in a sample of Hausa from Cameroon, but not in non-African samples. This raised the possibility that a recombination hotspot is present in all populations and we had insufficient power to detect it in the non-African data. To test this possibility, we estimated the crossover rate by sperm typing in five non-African men; these estimates were consistent with the LD decay in the non-African, but not in the Hausa data. Moreover, resequencing the orthologous region in a sample of Western chimpanzees did not show either an excess of polymorphism level or rapid LD decay, suggesting that the processes underlying the patterns observed in humans operated only on the human lineage. These results suggest that a hotspot of recombination has recently arisen in humans and has reached higher frequency in the Hausa than in non-Africans, or that there is no elevation in crossover rate in any human population, and the observed variation results from long-standing balancing selection.
L
INKAGE disequilibrium (LD), the nonrandom as-sociation of linked alleles, has attracted great attention in human genetics because of the hope that LD-based association studies may help dissect the ge-netic basis of common diseases (Rischand Merikangas1996). Local LD patterns are influenced by a broad range of different factors, which include variation in recombination and mutation rate, natural selection, and demography (Pritchardand Przeworski2001).
Indeed, fine-scale variation in LD decay with distance between sites is well documented in the human ge-nome, and this variation was shown to exceed what is expected if mutation and recombination occurred at a uniform rate and all variation were evolutionarily neutral (Crawford et al. 2004; McVean et al. 2004;
Altshuler et al. 2005; Myers et al. 2005). Moreover,
recent analyses of LD using population-genetic ap-proaches have suggested that there is extensive het-erogeneity in recombination rates over the scale of kilobases (Crawford et al. 2004; McVeanet al. 2004;
Altshuleret al.2005; Myerset al.2005).
The notion that variation in LD decay is due largely to variation in recombination rates was bolstered by the analysis of recombinants in sperm samples (Hubert
et al.1994; Arnheimet al.2003). Sperm-typing studies
have demonstrated that crossover events cluster in narrow intervals of 1–2 kb corresponding to regions of localized breakdown of LD (Han et al.2000; Jeffreys
et al. 2001). Moreover, they showed that substantial interindividual variability in recombination rate exists, raising the possibility that hotspots may be short-lived features of the human genome (Yuet al.1996; Jeffreys
and Neumann2002). Recent cross-species comparisons
of LD patterns have further shown that there is little overlap between inferred hotspots in humans and closely related nonhuman primates (Wall et al.2003;
Ptaket al. 2004a, 2005; Winckler et al. 2005). These
findings suggest that hotspots evolve quickly, at least relative to the divergence time of human and chimpan-zee. However, even though recombination rates on a fine scale appear to have changed substantially over evolutionary time, on a larger scale recombination rates are relatively similar across populations and possibly across species (Myerset al.2005; Ptaket al.2005; Serre
et al.2005).
Despite the general concordance between LD-based estimates of recombination rate and empirical estimates
1Corresponding author:Department of Human Genetics, University of
Chicago, 920 E. 58th St., CLSC Room 507F, Chicago, IL 60637. E-mail: [email protected]
based on genetic maps or sperm typing, interesting deviations have also been detected. LD and sperm-typing analysis of a region of 206 kb on chromosome 1 revealed several hotspots in areas of strong LD (in addition to hotspots in regions of rapid LD decay) (Jeffreys et al. 2005). Because LD analyses estimate
average recombination rates over both sexes and over long-term evolutionary time, while sperm-based esti-mates are specific to a sample of contemporary males, the observed discrepancies may reflect the presence of hotspots that are too young to have left a signature in LD patterns. The opposite deviation,i.e., low sperm-typing estimates of recombination rate in regions of rapid LD decay, has also been observed (Jeffreys et al. 2005;
Kauppi et al. 2005). Proposed explanations for these
findings include unusually large differences in male-vs.
female-specific recombination rate, a polymorphic hot-spot that is absent in the men sampled for sperm analysis, or an extinct hotspot that was active in the rel-atively recent past, such that patterns of LD are still shaped by it. While these explanations are plausible, the possible role of natural selection in leading to appar-ent variation in recombination rate has received lit-tle attention (but see Reed and Tishkoff 2006 and
Stephanet al.2006).
A previous resequencing study ofCAPN10, a suscep-tibility gene for type 2 diabetes, detected a local excess of polymorphism levels in all populations examined; the same segment also showed localized breakdown of LD in one of the surveyed populations (Hausa of Cameroon) (VanderMolenet al.2005). This pattern
was shown to be inconsistent with a coalescent model with uniform recombination rate and neutral evolution; specifically, a sliding-window analysis of an estimate of the population crossover rate parameter showed that the ratio of the maximum to the median window value was significantly larger than expected by chance in a random-mating population of constant size (Vander
Molenet al.2005). We previously showed that a model
of long-standing balancing selection maintaining mul-tiple alleles fit theCAPN10Hausa data, for up to nine selected alleles (Takahata1990; VanderMolenet al.
2005). A selection scenario is particularly relevant because the genetic susceptibility to type 2 diabetes is widely thought to be the result of ‘‘thrifty’’ alleles that conferred a selective advantage by increasing the effi-ciency of energy use and storage. Diabetes risk variants may therefore be metabolic adaptations to an ancient lifestyle characterized by feast and famine (Neel1962).
Thus, it is plausible that balancing selection resulted in a local elevation of polymorphism levels and rapid LD decay in an ancestral human population prior to the dispersal out of Africa, with a signature in LD decay retained only in the African population.
An alternative scenario is that the pattern of LD at
CAPN10 is due to the presence of a recombination hotspot present in all populations, but detected only in
one. Testing this neutral explanation is the major focus of the work presented here. To this end, we used a combination of empirical and statistical approaches to evaluate whether the LD patterns could be due to a recombination hotspot. More specifically, we measured the crossover rate in sperm samples and analyzed the LD data to explicitly test for the presence of a hotspot; we show that the crossover rate estimates based on sperm typing are consistent with LD patterns in the non-African samples, but not in the Hausa data. In addition, by resequencing the orthologous region in a population sample of Western chimpanzees, we show that the excess of polymorphism levels and LD decay is human specific.
MATERIALS AND METHODS
DNA samples:DNA from 35 semen samples was extracted using the Puregene DNA isolation kit (Gentra Systems, Research Triangle Park, NC); these samples were from anonymous donors of non-African ancestry. DNA concentra-tions were determined spectrophotometrically. However, the number of amplifiable genomes per mass unit of DNA may vary from sample to sample due to a variety of reasons (including fragmentation) and, in turn, affect the number of effective recombinants detected in sperm-typing assays. Hence, we used kinetic (kt) PCR with primers upstream and downstream of the region of study to compare the number of amplifiable genomes of each sperm sample to a high-quality genomic DNA control (BD Biosciences). The number of genomes was then adjusted to the measured number of amplifiable genomes (see supplemental data at http://www. genetics.org/supplemental/). The use of sperm samples from anonymous donors was approved by the Institutional Review Boards of the University of Southern California and of the University of Chicago.
Whole blood samples (5–10 ml) were taken from 15 chimpanzees during routine veterinary examinations, and DNA was isolated using a standard phenol/chloroform-based extraction protocol. The chimpanzees in this sample are wild born and were exported from Africa prior to the Convention on International Trade in Endangered Species of Wild Fauna and Flora (CITES) enacted in 1975. The geographic origins of the individuals in the sample are unknown, except that two individuals were probably captured in Sierra Leone. Sub-species status was determined through mitochondrial DNA and Y chromosome sequences (Stone et al.2002 and our
unpublished data). All of the chimpanzees in this sample were identified as Western chimpanzees (Pan troglodytes verus) and were sequenced at intron 13 of CAPN10 to examine the patterns of polymorphism and LD in a close outgroup species. These results were compared to previously published rese-quencing data for a segment of 33,465 bp in 48 humans (Vander Molenet al.2005), comprising equal numbers of
Hausa of Cameroon, Han Chinese, and Italians. All nucleotide positions in this article refer to reference sequence AF158748.
Sequencing and haplotyping of sperm samples: Heterozy-gous individuals for two pairs of SNPs flanking each side of the region of study were identified by sequencing. The four SNPs selected were at positions 30952 (C/T) and 31449 (C/G) 59of the target region and 35020 (C/A) and 35309 (G/C) 39. Of the 35 sperm samples, we identified five heterozygotes at all four SNPs (test individuals) as well as two nonrecombinant homo-zygotes; the latter were used as negative controls.
phase for the internal SNPs at nt positions (pos.) 31,449 and 35,020, as well as all other SNPs present in these individuals (Figure 1). All test individuals have the same nonrecombinant haplotype configuration at the four flanking SNPs (C-C-C-G and T-G-A-C).
Recombination detection in sperm DNA:We measured the recombination fraction of a 4357-bp region in intron 13 of CAPN10located on chromosome 2q37 (centered on nt pos. 33,100 in AF158748,i.e., nt pos. chr2:241261505 in hg17) by counting the number of recombinant molecules in pools of 3000 sperm genomes each using long-range AS–PCR (Cheng
et al.1994; Hanet al.2000; Jeffreyset al.2001; Arnheimet al.
2003). The recombinant molecules were selectively amplified in two rounds of PCR using AS primers (Operon Biotechnol-ogies, Alameda, CA) (see supplemental data at http://www. genetics.org/supplemental/). AS primers were designed so that the 39 end of the primer forms a mismatch with the abundant nonrecombinant molecules and a perfect match with one of the recombinant alleles. This design allows for the preferential amplification of a single recombinant copy over the nonrecombinant genomes, at the appropriate di-lution. To increase the specificity of the PCR the last four phosphate bonds in the primer were phosphorothiolated and a mismatch substitution was added 2 or 3 bases from the 39 end of each second-round primer. However, because we were unable to achieve complete allele specificity for haplo-type T-G-C-G, the crossover rate could not be measured for this recombination product. Throughout, we assume that both products of a crossover are produced at the same frequency as observed in other sperm-typing studies in which both cross-over products were evaluated (Jeffreysand Neumann2002).
AS–PCR was performed on the informative individuals using the Expand Long Template PCR system (Roche, Indian-apolis) (see supplemental data at http://www.genetics.org/ supplemental/). For each of the five test sperm samples, we amplified in the same experiment multiple independent aliquots of each test sample, an equal number of negative controls (containing both nonrecombinant haplotypes), and a set of positive controls consisting of 13 aliquots with 1 recombinant molecule on average in 3000 nonrecombinants (1:3000 dilution controls) and 1 aliquot containing 30 recombinant molecules in 3000 nonrecombinants (1:10 di-lution control). For each sample, the total amount of sperm DNA used was adjusted to account for variation in the number of amplifiable genomes (as described above). In all experi-ments, the first round and the nested second round of PCR were set up in different biological safety cabinets to minimize cross-contamination.
Two methods were used to detect recombinant molecules: visualization of PCR products on an agarose gel or evaluation by kt–PCR. For the gel detection method, an experiment was considered successful if the 1:3000 dilution controls produced the Poisson-expected number of positives (50–65% positives) and there was little or no evidence of non-AS–PCR in the neg-ative or nonrecombinant controls (see supplemental Figure 1 at http://www.genetics.org/supplemental/). kt–PCR was per-formed on an ABI7700 or an ABI7900 real-time PCR machine (Applied Biosystems, Foster City, CA). Amplification plots were evaluated using Sequence Detection Systems (Applied Biosystems) software (v. 1.9 or 2.1) to determine the cycle threshold (Ct) (i.e., the cycle at which the PCR yield achieves a user-specified threshold) for each PCR reaction. A kt–PCR experiment was considered successful if there was a distinct difference between positive and negative PCR reactions (i.e., the latest positives reached the specified Ct value at least three cycles before the earliest negatives) and the expected propor-tions of 1:3000 dilution reacpropor-tions were positive (see supple-mental Figure 2 at http://www.genetics.org/supplesupple-mental/).
Resequencing survey in Western chimpanzees: A segment of 10,268 bp, which aligns to the human reference sequence AF158748 between nt pos. 26,079 and 36,346, was amplified and sequenced as previously described (VanderMolenet al.
2005). Where necessary, additional primers were designed on a chimpanzee reference sequence to fill in gaps. All sequences were aligned and visualized using the Phred/Phrap/Consed system and scored using Polyphred (Nickersonet al.1997);
sequence chromatograms were visually inspected to confirm the putative polymorphisms and all genotype calls. The total length of scored sequence was 10,171 bp.
Statistical analyses: Summary statistics of polymorphism were calculated using the online program SLIDER (http:// genapps.uchicago.edu/slider/index.html). The population crossover rate parameter (r¼4Nec, whereNeis the effective population size andcthe crossover rate) was estimated for the segment of10 kb centered on the peak of ˆr(VanderMolen
et al. 2005), using the online program MAXDIP (http:// home.uchicago.edu/rhudson1/source.html), which imple-ments the composite-likelihood estimator described in H ud-son(2001). Following Frisseet al.(2001), we assumed that
recombination events resolve either as gene conversion or as crossover and that the gene conversion tract lengths are exponentially distributed with mean lengthLbp. The model therefore has three parameters: the population crossover rate per base pair, r ¼ 4Nec; the ratio of gene conversion to crossover events, f; andL. Since simulations suggested that there is not enough information in polymorphism data from a single locus to coestimate the three parameters (Frisseet al.
2001; Ptaket al.2004b; Wall2004), we considered different
models of gene conversion and estimated r under each. Specifically, we setf¼0 (i.e., no gene conversion),f¼2 and L¼500 bp, orf¼5 andL¼60 bp (Jeffreysand May2004;
Ptaket al.2004b). In each case, we estimatedron a grid from 0
to 0.01 (with an increment of 105). We ran MAXDIP using the
ancestral allele information as inferred from outgroup se-quences and we excluded the two microsatellite loci in humans. The estimates ofrobtained in this way are denoted rLD. To derive an estimate of the crossover rate, we dividedrLD by 4Ne* for each population, whereNe* is an estimate of the effective population size (11,990 for Hausa, 9028 for Italians, 8323 for Chinese, and 8019 for Western chimpanzees). This estimate ofNe* was obtained from diversity (the number of segregating sites) and sequence divergence levels (using the orangutan) for the surveyed segment. We assumed 6 MYA to the common ancestor of human and chimpanzee and 25 and 15 years per generation for the two lineages, respectively.
The method of McVeanet. al.(2004) was used to examine
rate variation across the 33.5-kb segment surveyed in hu-mans (VanderMolenet al.2005) and the10-kb subsegment
surveyed in Western chimpanzees. As in McVeanet. al.(2004),
a smoothing parameter of 20 was used in the analysis. A range of smoothing parameters between 15 and 50 was investigated, and similar results were observed (results not shown).
We also assessed the support in polymorphism data for a recombination hotspot using the method of Crawfordet al.
estimated by PHASE to those obtained from sperm typing, we divided the estimate ofrfor the10-kb segment by 4Ne*.
It is important to note that all three methods for estimating recombination parameters rely on a simple model of a random-mating population of constant size, the method of McVean et al. (2004) and MAXDIP explicitly and PHASE
implicitly (Hudson2001; Liand Stephens2003). Simulations
suggest that the estimates ofrtend to decrease under a bot-tleneck model (Liand Stephens2003; Smithand Fearnhead
2005). Simulations of a two-island model gave similar results, whether sampling from each island was equal or not (Liand
Stephens2003); it was also shown that estimates ofrtend to
decrease under a four-island model with equal sampling from all islands (Smith and Fearnhead 2005). However, the
behavior of the estimators ofrunder more complex models of population structure that may apply to humans has not been investigated (Wakeley1999; Wakeleyet al.2001).
To assess whether the estimates of crossover rate obtained from LD data and sperm typing are consistent, we generated 1000 simulated polymorphism data sets under a model of uniform recombination, with the rate obtained from sperm-typing experiments. We then estimatedrusing MAXDIP and tabulated the proportion of simulated data sets for which the estimate was as high or higher than that observed for the actual polymorphism data. Simulations were run using the software MS (Hudson2002); the program produces a list of
haplo-types, which were randomly paired to form genotypes. In the simulations, we matched the actual number of individuals sequenced (16 for each of three human populations and 15 for Western chimpanzees), the length of the surveyed segment (10,268 and 10,171 bp in humans and chimpanzees, respec-tively), and the fraction of missing genotype calls (1%) or missing ancestral information (one site in humans). More-over, the value of u ¼ 4N0m (where N0 is the effective population size at present andmis the mutation rate) was chosen to yield the same average number of segregating sites as that observed. We considered the same three models of gene conversion as for the actual data and setr¼4N0c*, where c* is the upper 97.5th percentile estimate of crossover obtained from sperm typing. The point estimatesrLDwere obtained under the same gene conversion models as those under which the simulated data were generated.
We ran two sets of simulations: (1) under the standard neutral model of a random-mating population of constant size and (2) under random-mating models of population size change shown to provide a good fit to a 50-locus data set collected in the same populations (Voightet al.2005). The
latter allowed us to examine the effect that population size changes might have on our estimate ofrLD. Specifically, we assumed a model of a constant population size followed by
exponential growth to the present for the Hausa (Marjoram
and Donnelly1994; Pluzhnikovet al.2002; Voightet al.
2005), while for the Chinese and Italians we used a simple bottleneck model where a population size decreases and then recovers to the same size (Fayand Wu1999). Parameters were
as follows: 2.1-fold growth starting 1000 generations ago for the Hausa, a 60% reduction in population size from 3200 to 200 generations ago for the Chinese, and a 50% reduction from 3200 to 100 generations ago for the Italians (cf. Voight
et al.2005). We also tried other bottleneck parameters and the qualitative conclusions were unchanged (results not shown). It should be noted that we did not consider models of population structure. It was previously shown that, under a simplified model of population structure, estimates of abso-lute r tend to be lower than those under random mating models, but that there is a slightly higher probability of incorrectly inferring a hotspot (Li and Stephens 2003); it
remains possible that the latter effect is greater under more complex models of population structure (Wakeley1999).
RESULTS
Estimation of crossing-over rate based on sperm typing: We used the strategy for ‘‘recombination de-tection using total sperm DNA’’ described in (Arnheim
et al.2003) to measure the crossover rate in five infor-mative sperm samples in a segment of 4357 bp centered on nt pos. 33,100 of the reference sequence. Sequenc-ing of the AS–PCR products of the informative samples reveals a total of six different haplotypes (Figure 1). These haplotypes fall within three of the five major groups of haplotypes previously described in this seg-ment of the CAPN10 gene and include the deepest lineages in the gene genealogy (Clarket al.2005).
The AS–PCR experiments in the sperm samples yielded a total of three recombinants in 552,000 ge-nomes (meioses), comprised of 184 pools of an esti-mated 3000 amplifiable genomes each. The distribution of the recombinants detected and the number of ge-nomes queried in each individual are detailed in Figure 1. Since our AS–PCR assay recovers only one of the two possible recombination products, our results effectively correspond to finding six recombinants in 552,000 meioses. Therefore, the estimated crossover rate for Figure 1.—Visual haplotypes
of the five informative individuals assayed by sperm typing. The ancestral and derived alleles, inferred on the basis of a se-quence alignment of nine pri-mate species (Clarket al.2005),
the entire segment of 4357 bp is 1.093105. Since the
number of recombinants is expected to be binomially distributed, the 95% confidence interval for the cross-over rate is (5 3 106, 2.4 3 105) for the entire
segment or (1.2 3 109, 5.4 3 109)/bp. Note that
effectively this represents an estimate of the crossing-over rate,c, as gene conversion is unlikely to coconvert both SNPs targeted by the two rounds of AS–PCR.
Patterns of sequence variation in Western chimpan-zees and humans: A sliding-window analysis of rese-quencing data for the33.5 kb spanning theCAPN10
gene identified a peak of polymorphism levels and LD decay in the Hausa population in intron 13 (nt pos. 32,000–33,000 of reference sequence AF158748); a peak of polymorphism levels was observed also in the other three population samples at approximately the same position (VanderMolenet al.2005). Coalescent
simulations showed that these peaks of polymorphism and LD decay are not consistent with a neutral model with uniform mutation and recombination rate (Vander
Molenet al.2005). Here, we have collected
resequenc-ing data for an orthologous subsegment of 10,268 bp, centered on the peak, in 15 Western chimpanzees (P. troglodytes verus). This subspecies was chosen because a previous analysis of noncoding regions showed that patterns of variation are in rough accordance with the expectation of a standard neutral model (Fischeret al.
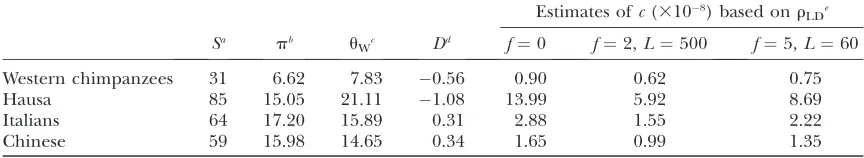
2004). Summary statistics of the polymorphism data in each sample are shown in Table 1. To compare poly-morphism levels across samples, we use the estimatoruW
of the population mutation rate parameteru¼4Nemthat
is based on the number of polymorphic sites and sample size (Watterson 1975), and for allele frequencies we
use a summary of the folded frequency spectrum, Tajima’s D (Tajima 1989a). The chimpanzees show
two- to threefold lower polymorphism levels compared to humans and a slight skew toward rare variants. Both polymorphism levels and the frequency spectrum are within the range of previous polymorphism surveys in this chimpanzee subspecies (Yuet al.2003; Fischeret al.
2004). Moreover, a sliding-window analysis ofuWin the
chimpanzee and human population samples shows distinct patterns of variation, with no prominent peak of polymorphism in the chimpanzees (data not shown). Estimation of crossing-over rate based on LD data: To characterize levels of LD in the surveyed segment, we estimated the population crossover rate parameter,r¼ 4Nec, under different models of gene conversion using
the program MAXDIP (Hudson 2001). To obtain
estimates of the crossing-over rate (c) (given in Table 1), each estimate ofrLDwas divided by 4Ne* (whereNe*
is an estimate of the effective population size based on levels of interspecies divergence and on the polymor-phism levels observed in each population sample). Consistent with previous analyses, the point estimates ofcfor the Hausa are higher than those for both non-African populations (for all rates of gene conversion). The point estimates for the Western chimpanzees are lower than those obtained for all human populations. The consistency between estimates ofcbased onrLDand
those based on sperm typing is assessed in the next section.
To investigate the fine-scale variation in LD decay across the surveyed segment, we use the method of McVean et al. (2004), which extends the
composite-likelihood estimator implemented in MAXDIP to esti-mate variation in r along the sequence. The method produces a smoothed map of the population crossover rate, with the smoothing parameter reflecting the prior assumption about the rate heterogeneity in the region. Consistent with previous analyses, this method detects a peak in estimates ofrin the Hausa data approximately at nt pos. 32,500 of the reference sequence (Figure 2). No substantial peak is observed in the other human population samples (Figure 2) and there is no evidence of rate variation in the Western chimpanzees (data not shown). Interestingly, the same statistical methodology applied to genomewide SNP genotyping data in a pool of ethnically diverse samples (Myerset al.2005) did not
find evidence for a hotspot inCAPN10.
TABLE 1
Summary statistics of polymorphism data in the subsegment of10 kb
Estimates ofc(3108) based onr
LDe
Sa pb u
Wc Dd f¼0 f¼2,L¼500 f¼5,L¼60 Western chimpanzees 31 6.62 7.83 0.56 0.90 0.62 0.75
Hausa 85 15.05 21.11 1.08 13.99 5.92 8.69
Italians 64 17.20 15.89 0.31 2.88 1.55 2.22
Chinese 59 15.98 14.65 0.34 1.65 0.99 1.35
aNumber of polymorphic sites.
bNucleotide diversity (3104) (Tajima1989b). c
Watterson’s estimator of the population mutation rate parameteru¼4Nem(3104) (Watterson1975). d
Tajima’sD(Tajima1989b). e
Estimate of the crossover rate (3108) based on the composite-likelihood estimate ofr
To investigate explicitly the hypothesis that the pattern of LD decay in the Hausa is due to the presence of a recombination hotspot, we used the method of Crawfordet al.(2004) to estimate the total crossover
rate, the intensity of the hotspot (l), and its location. An advantage of this method is that it provides an estimate of the uncertainty associated with estimates ofr, there-fore allowing for hypothesis testing. Table 2 reports the estimated 95% credible intervals for the total crossover rate (c), obtained by dividing the estimate of the total population recombination rate in the segment by 4Ne*
(see materials and methods). Consistent with the
results presented in Table 1, the credible interval forc
obtained under the hotspot model is higher in the Hausa than in the other samples and does not overlap with estimates from the other three populations. The credible intervals of the Italians, Chinese, and Western chimpanzees, however, do show substantial overlap. Hence, consistent with previous reports (Hudson
2001; Liand Stephens2003), the uncertainty around
the point estimates of rLD can be large and could
significantly affect the interpretation of statistical tests if not properly taken into account. In agreement with other analyses suggesting unusual heterogeneity of recombination rate (sliding-window analyses in Vander
Molenet al.2005 and Figure 2), the results of PHASE
provide moderate and very strong support, respectively, for a hotspot withl.10 andl.5 in the Hausa. In the non-African and Western chimpanzee data, in contrast, there is little support for a hotspot.
Comparison of crossing-over rates estimated on the basis of sperm-typing and LD data:As shown in Table 1, the point estimates ofcbased onrLDfall above the 95%
confidence interval (i.e., 1.2 3 109, 5.4 3 109/bp)
estimated by sperm-typing data for all population samples. However, when we consider an explicit hotspot model and the uncertainty of therLDestimates is taken into account (see Table 2), a discrepancy between estimates ofc is observed only in the Hausa LD data. Although estimates of c based on rLD depend on an
estimate of Ne, they remain inconsistent with those
based on sperm typing unless we assume a Ne* of
92,000, a value over seven times higher than that computed from diversity estimates and much higher than that estimated for other regions (Frisseet al.2001;
Voight et al. 2005). Hence, the difference between
estimates ofcis unlikely to reflect error inNe* alone.
In non-African populations, the estimate of c from sperm typing falls within the 95% credible intervals estimated from LD, using the hotspot model (Table 2). However, the point estimates obtained under the method of Hudson (2001) are almost an order of
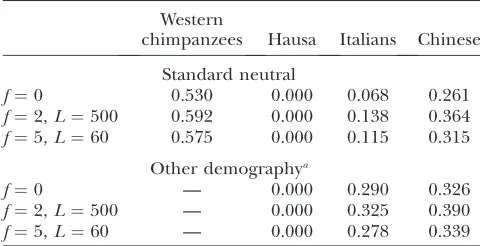
magnitude higher than expected (Table 1). To examine whether this reflects error in the estimator, we simulated data sets of sequence variation under a null model of uniform recombination rate and neutral evolution, assuming that crossover occurs at the highest rate compatible with our sperm-typing estimates (i.e., the upper boundary of the 95% confidence interval), and used MAXDIP to estimate r in each replicate. The simulations were performed under a standard neutral model of constant population size and random mating as well as under other demographic models shown to provide a reasonable fit to noncoding sequence varia-tion data for each of the non-African populavaria-tion samples (Voightet al.2005). We then calculated the
proportion of simulated data sets in whichrLDis as high
Figure2.—Estimates of the population
cross-ing-over rate parameter (r) per base pair across theCAPN10gene in Hausa, Italians, and Chinese. Estimates were obtained using the method of McVeanet al.(2004).
TABLE 2
Estimated crossing-over rate (c) per base pair (3108) based on a hotspot model as implemented in the program PHASE
Western
chimpanzees Hausa Italians Chinese
Total rate, 2.5th percentile
0 4.16 0.05 0
Total rate, 97.5th percentile
3.03 11.82 1.01 0.23
Pr (l.5) 0.06 0.98 0.22 0.24 Pr (l.10) 0.03 0.65 0.19 0.16
or higher than that observed. The results show that, under demographic models appropriate for the non-African samples, a point estimate ofrLDas high as that
reported in Table 1 for Italians and Chinese is not unusual (Table 3); this suggests that the difference between point estimates of rLD and the sperm-typing
estimates is due to chance. Moreover, the data in the Western chimpanzees are compatible with the estimates ofcobtained by sperm typing in humans (Table 3).
DISCUSSION
Our previous analysis of sequence variation in the
CAPN10 gene detected an excess of polymorphism levels in all population samples examined, a pattern shown to be consistent with the action of long-standing balancing selection (VanderMolenet al.2005).
Local-ized LD breakdown, also consistent with long-standing balancing selection in a randomly mating population, was observed only in the Hausa population sample. Here, we showed that the LD breakdown in the Hausa (but not in the non-African samples) is also consistent with the presence of a hotspot of recombination. Moreover, when we directly measured the crossover rate in five sperm samples of non-African descent, we obtained estimates that are too low to explain the rapid LD decay in the Hausa, but are consistent with LD data in non-Africans. Finally, resequencing data in a sample of Western chimpanzees showed that there is neither an excess of polymorphism levels nor localized LD break-down, suggesting that the processes underlying the patterns observed in humans operated only on the human lineage. These results may reflect the presence of a newly evolved hotspot that occurs at sufficiently different frequencies in Hausavs.non-African popula-tions to result in population-specific patterns of LD decay, with all variation being neutral. Alternatively, the pattern of LD in the Hausa may be due to the action of
long-standing balancing selection maintaining multiple alleles. Finally, although we considered demographic models that provide a good fit to patterns of noncoding variation observed in the same population samples (Voight et al. 2005), it is possible that additional
demographic models, such as complex models of population structure (Wakeley 1999), could generate
spurious evidence for a hotspot in the Hausa. These explanations are discussed in greater detail below.
Despite the close correlation between LD patterns and estimates ofr across human populations, marked differences in regions of rapid LD decay between African and non-African samples have previously been documented. For example, two large surveys of SNP variation in ethnically diverse populations showed that, at a global level, estimates of rare strongly correlated across populations, but regions of localized LD break-down are not always shared (Clarket al.2003; Evans
and Cardon 2005). Moreover, when Crawford et al.
(2004) specifically tested for the presence of recombi-nation hotspots in samples of African Americans and European Americans, they found that 16 of 35 hotspots show substantive evidence in one population, but not in the other. However, additional power analyses suggested that these hotspots may actually be present in both populations, but with insufficient information in the LD data to be detected in both populations (Crawford
et al. 2004). The LD pattern we observe atCAPN10 is similar to those of Crawfordet al.(2004) in that we find
statistical support for recombination rate heterogeneity only in the Hausa, but not in the non-African popula-tions. In our case, however, we also have direct estimates of crossover rate obtained by sperm typing in samples of non-African ancestry. These allow us to rule out the possibility that a hotspot with similar frequency and/or intensity is present in all human populations and we simply lack the power to detect it in our non-African samples. Thus, if there is a hotspot in the Hausa, it is truly population specific, at least relative to the pop-ulations we surveyed. More generally, our results suggest that typing of sperm samples from ethnically diverse individuals may provide important insights into the evolution of hotspots and will help with the interpreta-tion of LD patterns in human populainterpreta-tions.
The possibility of a hotspot with sufficiently different frequency and/or intensity across populations to gen-erate disparate LD patterns has important implications for the evolution of recombination. Previous work revealed that hotspots may vary not only between species but also across individuals. In particular, sperm-typing analysis showed that the DNA2 hotspot in the HLA region experienced different rates of recombination in individuals depending on the genotype at a SNP located near the center of the hotspot (Jeffreysand Neumann
2002). In light of these results, it is particularly inter-esting to note that SNP63, one of theCAPN10variants implicated in diabetes risk, exhibits unusually large
TABLE 3
The proportion of 1000 simulated data sets in which the es-timate ofrLDwas as high or higher than that observed
Western
chimpanzees Hausa Italians Chinese
Standard neutral
f¼0 0.530 0.000 0.068 0.261 f¼2,L¼500 0.592 0.000 0.138 0.364 f¼5,L¼60 0.575 0.000 0.115 0.315
Other demographya
f¼0 — 0.000 0.290 0.326
f¼2,L¼500 — 0.000 0.325 0.390 f¼5,L¼60 — 0.000 0.278 0.339
aIncludes a model of constant population size followed by
differences in allele frequencies between Africans and non-Africans (FST¼0.605) (Fullertonet al.2002). The
parallel between the divergence of SNP63 allele fre-quency and the marked differences in LD patterns between Africans and non-Africans raises the possibility that the allele found at high frequency in the Hausa might be associated with increased crossover rate. However, the only sperm sample heterozygous for this allele, man 3, has similar crossover rate estimates to the other samples. Thus, although we have low power to detect subtle changes in the rate of crossover in man 3, it seems unlikely that his genotype at SNP63 results in any substantial rate increase.
A caveat to the above analyses is that the evidence for a hotspot was assessed under models of random mating. Simulations of a simple two-island model showed that the estimates ofrtend to be lower compared to those obtained under random mating (Li and Stephens
2003); this might imply that our conclusion about the presence of a hotspot in the Hausa is robust to violation of the random-mating assumption. However, the same simulations showed that the type I error under this model is 0.07 (see Table 3 in Liand Stephens2003). If
more complex models of population structure (Wakeley
1999) result in a higher false-positive rate and such models fit the Hausa polymorphism data, the pattern observed at CAPN10 may be consistent with uniform recombination rate.
The alternative interpretation, i.e., long-standing balancing selection maintaining multiple alleles, is strengthened by considering the LD data together with polymorphism levels. Indeed, while we find a substantial elevation of polymorphism coinciding with rapid LD decay in Hausa, an analysis of resequencing data from 74 genes did not find that this is a common feature of recombination hotspots (Crawford et al.2004).
Like-wise, a resequencing study of theb-globin hotspot, a hotspot verified by sperm typing (Schneider 1999),
also did not reveal an elevation in polymorphism levels (Wallet al.2003). In contrast, we previously tested an
explicit model of long-standing balancing selection maintaining multiple alleles by coalescent simulations. We showed that this model can explain not only the observed LD breakdown in the Hausa, but also other features of the Hausa data, including the excess poly-morphism levels and the spectrum of allele frequency, without requiring changes in the underlying mutation and recombination rates (Takahata 1990; Vander
Molenet al.2005). As described by Takahata(1990),
this model is specified by two parameters: M, the number of alleles at the selected site maintained at equal frequency by selection, andQ, the rate at which alleles at the selected site are lost and replaced (‘‘turn-over’’). In our previous simulation analyses, we deter-mined that the Hausa data atCAPN10 are consistent with the above selection model for high turnover rates (Q¼1) and low number of alleles (M¼5–6); because
Q andM depend on the selection coefficient, varying their values implicitly varies the strength of selection (Takahata1990; VanderMolenet al.2005). As shown
by Takahata (1990), this model of long-standing
balancing selection results in a local deepening of an effectively neutral gene genealogy, hence allowing more mutation and recombination events than at neutrally evolving regions. Consistent with balancing selection maintaining multiple alleles, the gene genealogy for intron 13 of CAPN10 was shown to have five deep haplotype lineages (Clark et al. 2005). Moreover,
phylogenetic shadowing of the same region revealed several moderately to highly conserved sequence seg-ments immediately 59 to the apex of the peak of polymorphism and LD decay (Clark et al. 2005).
Because of the estimated time depth for this segment of intron 13 (2–3 MYA) (VanderMolenet al. 2005),
the signal in the data would reflect the onset of new selective pressures in an ancestral human population living in sub-Saharan Africa and possibly acting in all populations since the dispersal out of Africa. Subse-quent events during the history of non-African popula-tions may have eroded the signature of selection on patterns of LD decay but not on polymorphism levels, thereby generating the observed excess of polymor-phism in all populations and retaining the rapid LD decay only in the Hausa. A greater difference between Africans and non-Africans in LD levels compared to polymorphism levels is observed also at other genomic regions, supporting the notion that the pattern ob-served at CAPN10 may be due to differences in de-mographic history rather than in selective pressures (Frisse et al.2001; Voightet al. 2005). In particular,
bottleneck models predict a greater effect on LD levels than on polymorphism levels (Ardlieet al.2002; Wall
et al.2002).
A model of positive selection is particularly appro-priate forCAPN10because of its role in type 2 diabetes risk. A positional cloning study identified CAPN10 as a susceptibility gene for type 2 diabetes in Mexican Americans and proposed a complex model whereby heterozygosity for two haplotypes, defined by three diag-nostic variants (SNP43-INDEL19-SNP63), increased risk to disease (Horikawaet al.2000). In that respect, it is
worth noting that SNP63 (nt pos. 34,288) is located immediately 39to the region of excess polymorphism and LD decay; in addition, SNP30, just 1267 bp up-stream of SNP63 (nt pos. 33,021), is in perfect LD (r2.
0.8) with INDEL19 in all populations tested including Mexican American cases and controls (Fullertonet al.
2002; Clark et al. 2005). Thus, our population and
sperm-typing data may be compatible with long-stand-ing balanclong-stand-ing selection actlong-stand-ing on thrifty variants in an ancestral human population.
implications for using LD as a means of dissecting the genetic bases of common diseases and of type 2 diabetes in particular. If our results are due to a hotspot present in one population but at low frequency or absent in others, this implies that significant interethnic variation may be seen also in some fraction of the 25,000–50,000 hotspots estimated to occur in the human genome (al-though those estimates are based on LD data, not direct measurement of the recombination rate) (McVeanet al.
2004; Myerset al.2005). This may affect the association
signals between markers and disease causative variants observed in different populations and the ability to replicate a reported association in study populations with varying ethnic composition. Likewise, if multiple SNPs at a gene influence disease risk, the repertoire of haplotypes carrying those SNPs will also vary across pop-ulations. Although there is no shortage of unreplicated association signals in the literature, additional work is necessary to determine whether any of them result from variation in hotspot frequency across populations.
If instead our results are due to natural selection, this implies that crucial changes in selective pressures acting on the biological processes underlying diabetes risk occurred early in human evolution, possibly reflecting climate and diet changes associated with the onset of the Ice Ages (Millerand Colagiuri1994; Colagiuriand
BrandMiller2002; VanderMolen et al.2005), and
raises the possibility that a similar signature is present in other susceptibility genes for type 2 diabetes.
We thank the Riverside Zoo, the Sunset Zoo, the Detroit Zoo, the Primate Foundation of Arizona, and the New Iberia Primate Center for the Western chimpanzee samples. The chimpanzee sample collection and subspecies assignment were supported by grants from the Wenner–Gren Foundation for Anthropological Research (grant 6266) and the National Science Foundation (BCS-0073871) to A.C.S. This work was supported by National Institutes of Health (NIH) grant R01 DK56670 to A.D. G.C. was supported by NIH grant R01 HG02772. M.P. is supported by an Alfred P. Sloan fellowship in Computational Molecular Biology. V.J.C. is supported by a National Research Service Award postdoctoral fellowship (DK66974).
LITERATURE CITED
Altshuler, D., L. D. Brooks, A. Chakravarti, F. S. Collins, M. J.
Dalyet al., 2005 A haplotype map of the human genome.
Na-ture437:1299–1320.
Ardlie, K. G., L. Kruglyakand M. Seielstad, 2002 Patterns of
linkage disequilibrium in the human genome. Nat. Rev. Genet.
3:299–309.
Arnheim, N., P. Calabreseand M. Nordborg, 2003 Hot and cold
spots of recombination in the human genome: the reason we should find them and how this can be achieved. Am. J. Hum. Genet.73:5–16.
Cheng, S., C. Fockler, W. M. Barnesand R. Higuchi, 1994
Effec-tive amplification of long targets from cloned inserts and human genomic DNA. Proc. Natl. Acad. Sci. USA91:5695–5699. Clark, A. G., R. Nielsen, J. Signorovitch, T. C. Matise, S. Glanowski
et al., 2003 Linkage disequilibrium and inference of ancestral recombination in 538 single-nucleotide polymorphism clusters across the human genome. Am. J. Hum. Genet.73:285–300. Clark, V. J., N. J. Cox, M. Hammond, C. L. Hanisand A. DiRienzo,
2005 Haplotype structure and phylogenetic shadowing of a hypervariable region in the CAPN10 gene. Hum. Genet. 117:
258–266.
Colagiuri, S., and J. BrandMiller, 2002 The ‘carnivore
connec-tion’—evolutionary aspects of insulin resistance. Eur. J. Clin. Nutr.56(Suppl. 1): S30–S35.
Crawford, D. C., T. Bhangale, N. Li, G. Hellenthal, M. J. Rieder
et al., 2004 Evidence for substantial fine-scale variation in re-combination rates across the human genome. Nat. Genet.36:
700–706.
Evans, D. M., and L. R. Cardon, 2005 A comparison of linkage
dis-equilibrium patterns and estimated population recombination rates across multiple populations. Am. J. Hum. Genet.76:681– 687.
Fay, J. C., and C. I. Wu, 1999 A human population bottleneck can
account for the discordance between patterns of mitochondrial versus nuclear DNA variation. Mol. Biol. Evol.16:1003–1005. Fischer, A., V. Wiebe, S. Paaboand M. Przeworski, 2004 Evidence
for a complex demographic history of chimpanzees. Mol. Biol. Evol.21:799–808.
Frisse, L., R. R. Hudson, A. Bartoszewicz, J. D. Wall, J. Donfack
et al., 2001 Gene conversion and different population histories may explain the contrast between polymorphism and linkage dis-equilibrium levels. Am. J. Hum. Genet.69:831–843.
Fullerton, S. M., A. Bartoszewicz, G. Ybazeta, Y. Horikawa, G. I.
Bellet al., 2002 Geographic and haplotype structure of
candi-date type 2 diabetes susceptibility variants at the calpain-10 locus. Am. J. Hum. Genet.70:1096–1106.
Han, L. L., M. P. Keller, W. Navidi, P. F. Chanceand N. Arnheim,
2000 Unequal exchange at the Charcot-Marie-Tooth disease type 1A recombination hot-spot is not elevated above the ge-nome average rate. Hum. Mol. Genet.9:1881–1889.
Horikawa, Y., N. Oda, N. J. Cox, X. Li, M. Orho-Melanderet al.,
2000 Genetic variation in the gene encoding calpain-10 is asso-ciated with type 2 diabetes mellitus. Nat. Genet.26:163–175. Hubert, R., M. MacDonald, J. Gusella and N. Arnheim,
1994 High resolution localization of recombination hot spots using sperm typing. Nat. Genet.7:420–424.
Hudson, R. R., 2001 Two-locus sampling distributions and their
application. Genetics159:1805–1817.
Hudson, R. R., 2002 Generating samples under a Wright-Fisher
neutral model of genetic variation. Bioinformatics18:337–338. Jeffreys, A. J., and C. A. May, 2004 Intense and highly localized
gene conversion activity in human meiotic crossover hot spots. Nat. Genet.36:151–156.
Jeffreys, A. J., and R. Neumann, 2002 Reciprocal crossover
asym-metry and meiotic drive in a human recombination hot spot. Nat. Genet.31:267–271.
Jeffreys, A. J., L. Kauppiand R. Neumann, 2001 Intensely punctate
meiotic recombination in the class II region of the major histo-compatibility complex. Nat. Genet.29:217–222.
Jeffreys, A. J., R. Neumann, M. Panayi, S. Myersand P. Donnelly,
2005 Human recombination hot spots hidden in regions of strong marker association. Nat. Genet.37:601–606.
Kauppi, L., M. P. Stumpfand A. J. Jeffreys, 2005 Localized
break-down in linkage disequilibrium does not always predict sperm crossover hot spots in the human MHC class II region. Genomics
86:13–24.
Li, N., and M. Stephens, 2003 Modeling linkage disequilibrium and
identifying recombination hotspots using single-nucleotide poly-morphism data. Genetics165:2213–2233.
Marjoram, P., and P. Donnelly, 1994 Pairwise comparisons of
mitochondrial DNA sequences in subdivided populations and implications for early human evolution. Genetics 136: 673– 683.
McVean, G. A., S. R. Myers, S. Hunt, P. Deloukas, D. R. Bentley
et al., 2004 The fine-scale structure of recombination rate vari-ation in the human genome. Science304:581–584.
Miller, J. C., and S. Colagiuri, 1994 The carnivore connection:
dietary carbohydrate in the evolution of NIDDM. Diabetologia
37:1280–1286.
Myers, S., L. Bottolo, C. Freeman, G. McVeanand P. Donnelly,
2005 A fine-scale map of recombination rates and hotspots across the human genome. Science310:321–324.
Neel, J. V., 1962 Diabetes Mellitus: A ‘‘thrifty’’ genotype rendered
detrimental by ‘‘progress’’? Am. J. Hum. Genet.14:353–362. Nickerson, D. A., V. O. Tobeand S. L. Taylor, 1997 PolyPhred:
substitutions using fluorescence-based resequencing. Nucleic Acids Res.25:2745–2751.
Pluzhnikov, A., A. DiRienzoand R. R. Hudson, 2002 Inferences
about human demography based on multilocus analyses of non-coding sequences. Genetics161:1209–1218.
Pritchard, J. K., and M. Przeworski, 2001 Linkage disequilibrium
in humans: models and data. Am. J. Hum. Genet.69:1–14. Ptak, S. E., A. D. Roeder, M. Stephens, Y. Gilad, S. Paaboet al.,
2004a Absence of the TAP2 human recombination hotspot in chimpanzees. PLoS Biol.2:849–855.
Ptak, S. E., K. Voelpeland M. Przeworski, 2004b Insights into
re-combination from patterns of linkage disequilibrium in humans. Genetics167:387–397.
Ptak, S. E., D. A. Hinds, K. Koehler, B. Nickel, N. Patil et al.,
2005 Fine-scale recombination patterns differ between chim-panzees and humans. Nat. Genet.37:429–434.
Reed, F. A., and S. A. Tishkoff, 2006 Positive selection can create
false hotspots of recombination. Genetics172:2011–2014. Risch, N., and K. Merikangas, 1996 The future of genetic studies
of complex human diseases. Science273:1516–1517.
Schneider, J. A., 1999 Genetic recombination in the human
beta-globin gene cluster. Ph.D. Thesis, University of Oxford, Oxford. Serre, D., R. Nadonand T. J. Hudson, 2005 Large-scale
recombi-nation rate patterns are conserved among human populations. Genome Res.15:1547–1552.
Smith, N. G., and P. Fearnhead, 2005 A comparison of three
esti-mators of the population-scaled recombination rate: accuracy and robustness. Genetics171:2051–2062.
Stephan, W., Y. S. Songand C. H. Langley, 2006 The hitchhiking
effect on linkage disequilibrium between linked neutral loci. Ge-netics172:2647–2663.
Stone, A. C., R. C. Griffiths, S. L. Zegura and M. F. Hammer,
2002 High levels of Y-chromosome nucleotide diversity in the genus Pan. Proc. Natl. Acad. Sci. USA99:43–48.
Tajima, F., 1989a DNA polymorphism in a subdivided population:
the expected number of segregating sites in the two-subpopulation model. Genetics123:229–240.
Tajima, F., 1989b Statistical method for testing the neutral mutation
hypothesis by DNA polymorphism. Genetics123:585–595.
Takahata, N., 1990 A simple genealogical structure of strongly
bal-anced allelic lines and trans-species evolution of polymorphism. Proc. Natl. Acad. Sci. USA87:2419–2423.
VanderMolen, J., L. M. Frisse, S. M. Fullerton, Y. Qian, L.del
Bosque-Plata et al., 2005 Population genetics of CAPN10
andGPR35: implications for the evolution of type 2 diabetes var-iants. Am. J. Hum. Genet.76:548–560.
Voight, B. F., A. M. Adams, L. A. Frisse, Y. Qian, R. R. Hudsonet al.,
2005 Interrogating multiple aspects of variation in a full re-sequencing data set to infer human population size changes. Proc. Natl. Acad. Sci. USA102:18508–18513.
Wakeley, J., 1999 Non-equilibrium migration in human evolution.
Genetics153:1863–1871.
Wakeley, J., R. Nielsen, S. N. Liu-Cordero and K. Ardlie,
2001 The discovery of single-nucleotide polymorphisms—and inferences about human demographic history. Am. J. Hum. Genet.69:1332–1347.
Wall, J. D., 2004 Estimating recombination rates using three-site
likelihoods. Genetics167:1461–1473.
Wall, J. D., P. Andolfattoand M. Przeworski, 2002 Testing
mod-els of selection and demography inDrosophila simulans.Genetics
162:203–216.
Wall, J. D., L. A. Frisse, R. R. Hudson and A. Di Rienzo,
2003 Comparative linkage-disequilibrium analysis of the beta-globin hotspot in primates. Am. J. Hum. Genet.73:1330–1340. Watterson, G. A., 1975 On the number of segregating sites in
ge-netical models without recombination. Theor. Popul. Biol. 7:
256–276.
Winckler, W., S. R. Myers, D. J. Richter, R. C. Onofrio, G. J.
McDonaldet al., 2005 Comparison of fine-scale recombination
rates in humans and chimpanzees. Science308:107–111. Yu, J., L. Lazzeroni, J. Qin, M. M. Huang, W. Navidi et al.,
1996 Individual variation in recombination among human males. Am. J. Hum. Genet.59:1186–1192.
Yu, N., M. I. Jensen-Seaman, L. Chemnick, J. R. Kidd, A. S. Deinard
et al., 2003 Low nucleotide diversity in chimpanzees and bono-bos. Genetics164:1511–1518.