A Novel Approach to Predict Power
Generation using Raspberry Pi
Yamuna Yadwad 1, Vidyashri Kagale 2, Pooja Kademani 3, Nisha Shinde 4, Bahubali Akiwate 5
B. E Student, Department of Computer Science and Engineering, Kle’s KLE College of Engineering and Technology,
Chikodi, Karnataka, India1, 2, 3, 4
Professor, Department of Computer Engineering, Kle’s KLE College of Engineering and Technology, Chikodi,
Karnataka, India. 5
ABSTRACT: The installation cost of a wind mill is enormous installing one wind mill is a great deal of investment. Therefore selecting the best place to install the wind mill is extremely crucial. Selecting a wrong place can result in re-installation, which can be more expensive. Hence we are motivated with the fact that our system will avoid the situation of installing the wind mill in a wrong place. The proposed system deals with monitoring the wind speed. This is used in cases where one has to construct a wind mill/turbine wherein he will have to know wind speed at a particular location. The location of the wind turbine is crucial for maximizing its overall performance. Therefore we need this device to check whether there are any obstructions such as trees and buildings nearby (which slow the wind down and cause turbulence), the height above ground level. The purpose of this system is to measure average, minimum and maximum wind speed as well as how much turbulence there is at the site, store the details and send it to the server along with other details, like graphical representations of the time in a day is when wind speed is maximum.
KEYWORDS:Anemometer, IR sensor, Raspberry Pi and Wind mill.
I. INTRODUCTION
The purpose of this document is to give a technical view to the project "A Novel approach to predict power
generation using Raspberry Pi" and explain the working of the system from various perspectives.
Harvesting energy from various sources have been the agenda of the decade. Electric power can be harvested from multiple sources including Solar, Wind, Hydro, Nuclear etc. Wind power harvesting have been the most successful, hence has given rise to several wind farms. The investment required for setting up a wind mill or a farm is huge. Hence it is important to determine the best location for setting up a wind farm.
II. RELATEDWORK
The development of wireless data acquisition system (WDAS) for weather station monitoring is described. It is based on the Emitter/Receiver architecture and it does not require the physical connection of the monitored systems to the data collection server. The proposed system consists of a set of sensors for measuring meteorological parameters (solar radiation, temperature, humidity, pressure, windspeed & direction, rain fall, etc.). The collected data are first conditioned using precision electronic circuits and then interfaced to a PC using RS232 connection via wireless unit [1].
The proposed fault management system is design based on GSM (global system for mobile) communication. The system has been equipped with current sensor as field data interface devices, microcontroller as remote terminal unit, GSM as communication network, computer as master terminal unit and visual basic as human machine interface (HMI) software. A fault management strategy is also designed to find out the fault location effectively without human intervention after a fault occurred [2].
The Annex 32 Wind LiDAR systems for wind energy deployment (LiDAR) under the IEA Wind implementing agreement is dealing with wind LiDAR systems applied in wind energy. The aim is to address the very fast development of wind LiDAR technologies and their applicability for more accurate measurement of wind characteristics relevant for a more reliable deployment of wind energy power systems. The purpose is to bring together the present actors in the industry and research community to create synergies in the many R&D activities already on-going in this very promising and new remote sensing based measurement technology. The drivers for the new IEA Task based on wind LiDAR technology are:
Extensive research projects dedicated to the LiDAR technology have been performed during the last years (see for instance Upwind, NORSEWIND, WindScanner.dk, RAVELIDAR, etc.), however a consolidated multi-lateral and international exchange has to date not taken place.
The spread of several new commercial LiDAR systems with different specifications makes it very difficult for the community to keep up with the advances of this specific technology [4].
Planning and conducting a wind resource measurement program to support a wind energy feasibility initiative. These guidelines, which are detailed and highly technical, emphasize the tasks of selecting, installing, and operating wind measurement equipment, as well as collecting and analyzing the associated data, once one or more measurement sites are located who desires the planning framework and detailed procedures for conducting a formally structured wind measurement program. Personnel from the management level to field technicians will find this material applicable. The organizational aspects of a measurement program, including the setting of clear program objectives and designing commensurate measurement and quality assurance plans, all of which are essential to ensuring the program’s successful outcome, are emphasized. Considerable attention is also given to the details of actually conducting the measurement program in its many aspects, from selecting instrumental [6].
IEO2013 focuses exclusively on marketed energy. Non-marketed energy sources, which continue to play an important role in some developing countries, are not included in the estimates [7]. The IEO2013 projections are based on U.S. and foreign government laws in effect on September 1, 2012. The potential impacts of pending or proposed legislation, regulations, and standards are not reflected in the projections, nor are the impacts of legislation for which the implementing mechanisms have not yet been announced. The report begins with a review of world trends in energy demand and the major macroeconomic assumptions used in deriving the IEO2013 projections, along with the major sources of uncertainty in the projections. For the first time, projections extend through 2040[8].
Programmable controllers can communicate with each other and with other devices over a variety of networks. Supported networks include the Modicon Modbus and Modbus Plus industrial networks, and standard networks such as MAP and Ethernet [9]. Networks are accessed by built–in ports in the controllers or by network adapters, option modules, and gateways that are available from Modicon. For original equipment manufacturers, Modicon ModConnect ‘partner’ programs are available for closely integrating networks like Modbus Plus into proprietary product designs. The existing systems work as follows:
This method has problems, since these values are randomly taken at only few times in a day, it can result in choosing a wrong place for installing the Wind Mill.
Hand held Anemometers are expensive and can display values at real time, does not have recording facility.
III.PROPOSED SYSTEM
The system will be developed as a standalone system which will contain 3 modules. The main objective of the system will be “To design a system which would record the speed of wind at different times in a day and generate useful reports to decide best place to install the Wind Mills. To construct the windspeed monitoring device called the Anemometer."
This is used in cases where one has to construct a wind mill/turbine wherein he will have to know windspeed at a particular location. The location of the wind turbine is crucial for maximizing its overall performance. Therefore we need this device to check whether there are any obstructions such as trees and buildings nearby (which slow the wind down and cause turbulence), the height above ground level. The purpose of this system is to measure average, minimum and maximum windspeed as well as how much turbulence there is at the site, store the details and send it to the server along with other details, like graphical representations of the time in a day is when windspeed is maximum.
The system records real time Windspeed values.
The system displays these values to the user on web browser. The system stores the values in the database of the central server.
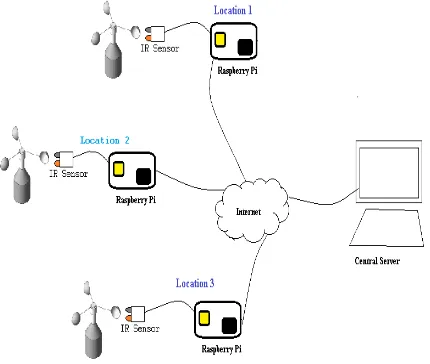
The following figure depicts the Overall System Architecture , here the Raspberry Pi and IR Sensor with propeller is placed in the different locations and a Central Server is wirelessly connected to these Raspberry Pi s, which has a python program running on it thus developing a Anemometer which periodically records the Windspeed of that particular location. In every location, IR Sensor is connected to Raspberry Pi and propeller is placed in front of IR Sensor. When propeller rotates the IR Sensor detects the cuts for every 5 seconds, and sends the data to the Central Server by Php file. On Central Server side, the data is saved in the database. The admin will login by giving user name and password. Thus the application will generate the graph depending on the data received and also give the comparison among the Average Windspeed of different locations.
System Overview
Fig 2: System Architecture
The following Figure System Architecture depicts the installation cost of a wind mill is enormous installing one wind mill is a great deal of investment. Therefore selecting the best place to install the wind mill is extremely crucial. Selecting a wrong place can result in re-installation, which can be more expensive. Hence we are motivated with the fact that our system will avoid the situation of installing the wind mill in a wrong place.
The project deals with monitoring the wind speed. This is used in cases where one has to construct a wind mill/turbine wherein he will have to know wind speed at a particular location. The location of the wind turbine is crucial for maximizing its overall performance. Therefore we need this device to check whether there are any obstructions such as trees and buildings nearby (which slow the wind down and cause turbulence), the height above ground level. The purpose of this system is to measure average, minimum and maximum wind speed as well as how much turbulence there is at the site, store the details and send it to the server along with other details, like graphical representations of the time in a day is when wind speed is maximum.
Modules
Anemometer module
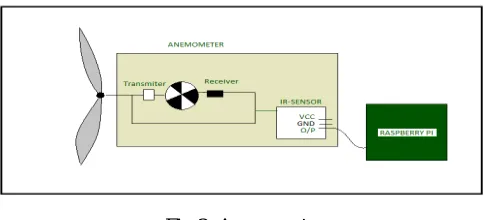
Fig 3: Anemometer
The above figure Anemometer depicts that it is a device which determines wind speed. Using the Raspberry Pi we propose to design and develop an anemometer which calculates wind speed. The Raspberry Pi primarily uses Linux-Kernel based operating systems. The Python program is written to calculate Wind Speed and thus Anemometer is developed.
Communication module:
The communication module will be responsible carrying the wind speed data from the Anemometer on the raspberry Pi to the Central Server. The Php file will be used to send the data from the Raspberry Pi to the Central Server.
Server module:
The Server module records the wind speeds at different times in the database. And generates reports on a User Interface. The admin will login into the application by giving the user name and password, thus Main Form is displayed. The new user can be created by User Creation form. For Wind Speed Menu there are two options, Average and Graph generation. The Average option will display the Wind Speed at different locations and thus give the comparison. The Graph generation will generate the graph of the Wind Speed at different locations.
IV.RESULTS
Figure 4 shows the Login Screen here we will enter user ID and Password. We can Login as normal user or super user. Figure 5 shows the Main Screen here we can view the Masters, Windspeed, System and Exit.
Fig 4: Login Screen Fig 5: Main Screen
Fig 6: Add Users Fig 7: Display Graph
Figure 6 shows the Add User screen, when we click on master button from main screen we view user option. After clicking on user will get add user screen. Privilege to add user is given only to the super user. The Users will be saved in the database.
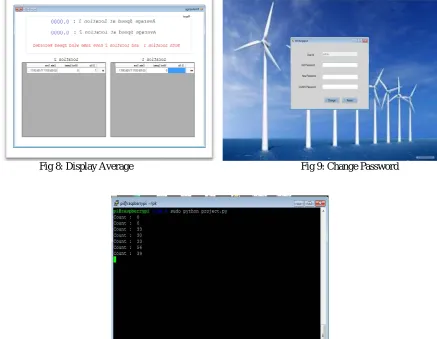
Figure 8 shows the Display average screen, we can view location1 as well as location 2 average speed. Also we can conclude that which is the best location to install the wind mill. We can view the data of location1 and location2 such as wind speed, date and time.
Figure 9 shows the change password screen, when we click onto change button the data will be updated. When we click onto reset button the text fields will be cleared.
Fig 8: Display Average Fig 9: Change Password
Fig 10: Cut Count Display
Figure 10 shows the cut count display. This cut count will display number of counts that the IR sensor will cut for every 5secs.
V. CONCLUSION
is a robust, flexible platform for wind data sensing, particularly suitable to remote locations where renewable energy plants are often located.
REFERENCES
[1] M. Benghanem, “A low cost wireless data acquisition system for weather station monitoring,”Renewable Energy, vol. 35, no. 4,pp. 862-872, 2010. [2] F. B. S. Rosiek, “A microcontroller-based dataacquisition system for meteorological station monitoring,” Energy Conversion and Management,
vol. 49, no. 12, pp. 3746-3754,2008.
[3] W. Wauben, “Wind Tunnel and Field Test of Three 2D Sonic Anemometers,” 2007.
[4] M. Harris, “Introduction to continuous-wave Doppler LiDAR”, in Remote Sensing for WindEnergy. Risøreport Risø-I-3068(EN), Risø National Laboratory for Sustainable Energy,Denmark.
[5] A. Harper, “Guidelines for converting between various wind averaging perionds in tropical cyclone conditions,” World Meteorological Organization, Geneva, 2010.
[6] AWS Scientific, Inc., “Wind ResourceAssessment Handbook,” AWS Truepower, New York, 2010. [7] J. Manwell, J. McGowan and A. Rogers, Wind Energy Explained, Wiley, 2003.
[8] U.S Energy Administration Administration,“Office Buildings,” U.S Energy Administration, 2010.