DOI: 10.1534/genetics.104.033431
Combining Mathematical Models and Statistical Methods to Understand and
Predict the Dynamics of Antibiotic-Sensitive Mutants in a Population of
Resistant Bacteria During Experimental Evolution
Leen De Gelder,* Jose´ M. Ponciano,
†Zaid Abdo,
†Paul Joyce,
†Larry J. Forney* and Eva M. Top*
,1*Department of Biological Sciences, Initiative in Bioinformatics and Evolutionary Studies (IBEST), University of Idaho, Moscow, Idaho 83844-3051 and†Department of Mathematics, Division of Statistics, Initiative in Bioinformatics and Evolutionary
Studies (IBEST), University of Idaho, Moscow, Idaho 83844-1103 Manuscript received November 5, 2003
Accepted for publication July 28, 2004
ABSTRACT
Temporarily discontinuing the use of antibiotics has been proposed as a means to eliminate resistant bacteria by allowing sensitive clones to sweep through the population. In this study, we monitored a tetracycline-sensitive subpopulation that emerged during experimental evolution ofE. coliK12 MG1655 carrying the multiresistance plasmid pB10 in the absence of antibiotics. The fraction of tetracycline-sensitive mutants increased slowly over 500 generations from 0.1 to 7%, and loss of resistance could be attributed to a recombination event that caused deletion of the tet operon. To help understand the population dynamics of these mutants, three mathematical models were developed that took into consider-ation recurrent mutconsider-ations, increased host fitness (selection), or a combinconsider-ation of both mechanisms (full model). The data were best explained by the full model, which estimated a high mutation frequency ( ⫽ 3.11 ⫻10⫺5) and a significant but small selection coefficient ( ⫽ 0.007). This study emphasized the combined use of experimental data, mathematical models, and statistical methods to better understand and predict the dynamics of evolving bacterial populations, more specifically the possible consequences of discontinuing the use of antibiotics.
T
ODAY, numerous pathogens have developed resis- the absence of antibiotics (GodwinandSlater1979; Helling et al. 1981; Bouma and Lenski 1988; Modi tance to one or multiple antibiotics (Cohen1992),and Adams 1991; Turner et al.1998; Dahlberg and to such an extent it is called “an epidemic of microbial
Chao2003). Therefore, when plasmid-free segregants resistance” (Gibbons 1992). Aside from the constant
emerge, they might be expected to replace the resistant search for new antibiotics that can be used against
multi-plasmid-containing population in the absence of selec-drug-resistant pathogens, another strategy is to lower or
tion for the plasmid. It has also been shown that the discontinue the use of a specific antibiotic against which
elimination of resistance genes from a plasmid can lower resistance is widespread (Levy1994;OTA1995;WHO
the burden of that plasmid. During an evolution experi-1995, 2003;Lenski1997). This approach assumes that
ment under glucose-limited conditions, Godwin and antibiotic resistance imposes a fitness cost to the host
Slater (1979) observed that an initial population of (Spratt1996;AnderssonandLevin1999;Bjorkman
Escherichia coli K12 that carried a multiple antibiotic
and Anderson 2000; Normark and Normark 2002)
resistance plasmid was replaced by a tetracycline-sensi-high enough for sensitive strains to have a selective
tive population that still carried a plasmid encoding advantage relative to resistant ones in the absence of the
the other resistance determinants. AlsoDahlbergand drug. Therefore, ending the use of a specific antibiotic
Chao(2003) andTurneret al.(1998) detected differ-would allow these sensitive strains to sweep through and
ent types of sensitive subpopulations in a multiresistant replace the resistant population (Levinet al.1997). An
parent population. In a similar experiment withE. coli
important mechanism by which bacteria acquire
antibi-JA104 (pBR322⌬5), a plasmid variant that possessed a otic resistance genes is through conjugative transfer of
2.25-kb deletion encompassing the tetracycline resis-plasmids on which they are encoded. Many authors have
tance operon arose, which resulted in a 10–20% fitness observed that the carriage of an antibiotic resistance
increase for the host compared to carriage of the wild-plasmid does indeed reduce the fitness of the host in
type plasmid (Modi et al. 1991). The population car-rying this mutated plasmid increased steadily from 5 to 99% between the 380th and 560th generation,
repre-1Corresponding author:Department of Biological Sciences, 252 Life
senting a clear selective sweep. These studies suggest
Sciences S., University of Idaho, Moscow, ID 83844-3051.
E-mail: [email protected] that drug-sensitive mutants could replace the resistant
et al.1966) in 50-ml flasks, which were shaken at 225 rpm at population after ending antibiotic treatment. In
con-30⬚. This medium supported a stationary-phase density of trast, other reports have clearly shown that coevolution ⵑ
4 ⫻ 109/ml. Five lineages were founded from E. coli between plasmid-encoded genes and the host (Lenski K12(pB10) and five fromE. coliK12::Km(pB10). Every 24 hr,
et al.1994) or compensatory mutations (Schraget al. 39l of each population was transferred to fresh media. The
regime permitted 8 generations of binary fission every day. 1997;AnderssonandLevin1999) may result in
resis-At 100-generation intervals a 1-ml sample of each population tant strains being equally as fit as or even fitter than
was mixed with 0.3 ml glycerol and archived at ⫺80⬚. The their sensitive counterparts.
founding populations were archived in the same way. Mutations in bacteria that result in loss of resistance Screening for tetracycline-sensitive clones:At weekly inter-to a particular antibiotic are typically infrequent. The vals from day 14 on, a sample from three lineages of each K12(pB10) and K12::Km(pB10) was plated on LB and colonies frequency of spontaneous mutations has been estimated
were picked onto LBTc, LBAmx, and LB. Colonies that scored to be in the range of 10⫺9–10⫺10per base pair and per
Tc⫺Amx⫹Sm⫹ were archived at ⫺80⬚. From both archived generation (Drake1991;AnderssonandHughes1996;
start cultures,E. coliK12(pB10) andE. coliK12::Km(pB10), a Drakeet al.1998) and only a fraction of these mutations sample was plated on LB, and 1000 colonies were picked onto will convert a resistant phenotype into a sensitive one. LBTc, LBAmx, and LB. Samples from the frozen cultures that were archived every 100 generations were plated onto LB and Due to these low frequencies and the lack of direct
detec-colonies (see Table 1 for sample size) were picked onto LBTc, tion of antibiotic-sensitive clones, such clones that arise
LBAmx, and LB. within a resistant population are usually observed only
Plasmid extraction and restriction enzyme analysis:Plasmids
once they sweep through the population due to a fitness were extracted from cells grown in LBTc or LBAmx using the advantage in the absence of the antibiotic. QIAprep spin miniprep kit according to the manufacturer’s instructions (QIAGEN, Valencia, CA) and digested with Hin-In this study, we monitored the loss of antibiotic
resis-dIII orNotI (Invitrogen, Carlsbad, CA). Samples were loaded tance inE. coliK12 populations that carried the
multire-on a 0.8% agarose gel and run for ⵑ16.5 hr at 30 V. The sistance IncP1-plasmid pB10 during a long-term
evolu-gels were stained with ethidium bromide and the bands were tion experiment in a medium without antibiotics. Our visualized by UV light.
goal was to identify the molecular basis of the tetracy- PCR and sequencing:PCR was used to assess the occurrence cline sensitivity observed in the mutant population and of recombination between the direct repeats that flank the tetra-cycline-resistance operon. These primers (forward, 5⬘-GACGG to develop a mathematical model based on the data
CGGCCTGGAGACAAGTC; reverse, 5⬘-TTTGCTCGGTGCCCT that helped explain the observed population dynamics,
TTCGGGTAA) targeted the regions on the plasmid (Schlu¨ter taking into account the associated mutation frequency
et al. 2003) just outside the direct repeat sequences as de-and selection coefficient. This model was further used scribed previously (Floreset al.2000). If no recombination to generate predictions concerning the effects of cycling has taken place and the tetracycline-resistance operon is still present in the plasmid, the annealed primers would be sepa-antibiotics on the decline of resistance levels.
rated by anⵑ6.4-kb stretch and the PCR reaction would not continue. If recombination has occurred and the tetracycline-resistance genes have been lost, the primers would be sepa-MATERIALS AND METHODS rated byⵑ900 bp and a PCR product of that size would be formed. PCR products were cleaned with the MiniElute PCR Experimental procedures
purification kit according to the manufacturer’s instructions (QIAGEN).
Media:Luria-Bertani broth (LB) medium and M9 minimal
To sequence the 900-bp fragment, 2l of PCR product was medium were prepared according toSambrookandRussel
mixed with 1l of either the forward or the reverse primer (2001). Unless otherwise stated, antibiotics were used in the
and 3l ddH2O and put at 95⬚for 5 min, after which it was following concentrations: 10 mg/liter tetracycline (Tc), 50
cooled down to 50⬚. Then, 4l of BigDye Terminator cycle mg/liter kanamycin (Km), 75 mg/liter amoxicillin (Amx),
sequencing ready reaction mix (Version 3.0; Perkin-Elmer, and 40 mg/liter streptomycin (Sm).
Foster City, CA) was added. Cycle sequencing conditions
(Pel-Bacterial strains and plasmid:The bacterial strains used
tier Thermal Cycler-200; MJ Research, Reno, NV) were as were E. coliK12 MG1655 (ATCC 47076) and a Km-resistant
follows: 95⬚ for 30 sec, 50⬚ for 20 sec, 60⬚for 4 min, with a variant (K12::Km) obtained by conjugation ofE. coliK12 with
total of 44 cycles performed. The sequencing products were E. coliS17/1pir (pUTminiTn5Km) and selection on M9⫹
cleaned with the DyeEx 2.0 spin kit (QIAGEN) for dye-termi-0.4% lactose⫹Km. The 64.5-kb plasmid pB10 was isolated
nator removal, followed by vacuum centrifuging for 10 min, from the bacterial community of a wastewater treatment plant
after which 10l formamide was added and the samples were in Germany (Dro¨ ge et al. 2000) and has been sequenced
put at 96⬚for 3 min. They were kept on ice before running (Schlu¨ teret al.2003). It has been identified as a
self-transmis-sible broad-host-range IncP-1plasmid and it mediates resis- on a POP6 polymer on a 3100 DNA automated capillary se-quencer (Applied Biosystems, Foster City, CA).
tance against the antibiotics tetracycline, amoxicillin,
sulfon-amide, and streptomycin and against mercury ions. The Electroporation: To obtain ancestral strains carrying evolved, mutated pB10 plasmids, E. coliK12 cells were pre-plasmid was transferred from its original hostE. coliDH5␣to
K12 and K12::Km through conjugation and selection on BBL pared for electroporation according toEnderleandFarwell (1998). Approximately 200 ng of plasmid DNA was added to MacConkey Agar supplemented with 15 mg/liter Sm and
LBKmTc, respectively. each of the cell suspensions and the mixtures were brought
into electroporation cuvettes (1 mm gap, 100l volume;
Ep-Evolution experiment:Experimental evolution of 10
inde-pendent lineages was accomplished by serial batch culture of pendorf, Hamburg, Germany) and electroporated at 2.5 kV (25F, 200⍀). The suspensions were then immediately trans-each lineage for 500 generations in 10 ml M9 with 2 g/liter
incu-bated for 1 hr at 37⬚, and plated on selective media after which 
lk(0,,)⫽ mlk
mlk⫹nlk
. (4)
the presence of the appropriate plasmid was confirmed.
Competition experiments:Competition experiments were
Solving this recursion (appendix b) results in the following performed by mixing overnight cultures of the two
competi-general equation: tors grown in M9⫹2 g/liter glucose⫹5 ml/liter stock E in
a 1/100 ratio. For each experiment, six to eight replicate cultures 
lk(0,,) were tested. The cultures were transferred every 24 hr into
fresh media (39l inocula into 10 ml of fresh media). After ⫽ 2lk0(2⫺(1⫺ ))⫹ (1⫺ 0)(2lk⫺(1⫺ )lk)
2lk0(2⫺(1⫺ ))⫹ (1⫺ 0)(2lk⫺(1⫺ )lk)⫹(1⫺ )lk(1⫺ 
0)(2⫺(1⫺ ))
. two transfers, the ratio of the two competitors was determined
(5) by selective plating. Using these data, the relative fitness (W)
was calculated as described previously (Lenski et al.1991). Equation 5 assumes that both mutation (at rate) and selec-Subsequently, the selection coefficient,s⫽W⫺1 (Lenskiet tion of mutants (represented by the selection coefficient) al.1991), was calculated and at-test was performed to deter- affect the population dynamics. This equation is readily inter-mine if thes-value was significantly different from zero. At-test pretable. The denominator is composed of three parts: was also performed to detect significant differences between 2lk
0(2⫺(1⫺ )) represents the growth of initial mutants,
differents-values. (1 ⫺ 
0)(2lk ⫺ (1 ⫺ )lk) represents the formation and growth of new mutants during evolution, and (1⫺ )lk(1⫺
0)(2⫺ (1⫺ )) represents the growth of TcR cells. The
Mathematical models and statistical methodology numerator involves the first two terms and describes the
forma-tion and growth of mutants. When there is no fitness
differ-Modeling the experimental evolutionary process:The
ex-ence between the mutants and the wild type we can set the perimental evolutionary process described above consisted of
selection coefficientto zero. Equation 5 becomes daily growth periods, wherein the populations multiplied in
a neutral environment forlgenerations (l⫽8), interspersed lk(0, 0,)⫽1⫺(1⫺ 0)(1⫺ )lk. (6) by daily bottlenecks of 39l/10,000l. We define a cycle as
Then the increase in fraction of mutants in the population is the combination of a growth period and a bottleneck and a
due solely to mutation. When there is no mutation effect, neutral environment as one that does not contain any
antibiot-can be set equal to zero, and the relative increase in mutants ics. The growth period of any cycle might encompass the event
is modeled only by the selective growth advantage: of a deletion mutation occurring at random and resulting in
a plasmid withouttetoperon. We refer to cells with a mutated
lk(0,, 0)⫽
02lk(1⫹) 02lk(1⫹)⫹2lk(1⫺ 0)
. (7)
plasmid as mutants.
We assumed the mutation process to be unidirectional;i.e.,
the cells can lose the Tc resistance but cannot gain it. We Modeling the sampling process:Samples were taken every denote the average number of mutants at a certain timetby 100 generations and diluted and plated to screen for tetracy-mtand the average of the remaining wild-type cells in period cline-sensitive clones. The used sample sizes, from 42 to 1000
tby nt. Therefore, the total population at timetis the sum colonies, were very small compared to the bottleneck imposed
ofmtandnt. At any generation, mutants increase due to (i) (ⵑ107transferred cells) and can result in a magnification of
growth of the mutants from the previous generation, which stochastic effects (Joyceet al.2005);i.e., the numbers of mu-occurs at a rate 21⫹ with being the selection coefficient tants observed on the basis of such a sampling method might and (ii) mutation of wild-type cells at rate. The following fluctuate merely due to the randomness of this sampling pro-recursive equation captures the average number of mutants cess. We call such an effect “observational error” and use a
at timet: stochastic model in the analysis of this process. A stochastic
model that fits such a process is a binomial sampling process. mt⫽21⫹mt⫺1⫹2nt⫺1. (1) In a sample of sizeDk, taken at thekth day, each individual
has a probabilitylkof being a mutant and 1⫺ lkof being
Using the no-back-mutation assumption, the average number a wild type. If 
lk is small we can approximate this model
of nonmutants at any timetis given by to a Poisson model with parameterD
klk, representing the
expected number of mutants in a sample. Letting this number nt⫽2(1⫺ )nt⫺1. (2)
of mutants from cultureiat the end of dayk,Sik, be a random
variable, thenSikis modeled by
The average fraction of mutants available at any timetis
SikⵑBIN(Dk,lk)⬇POI(Dklk)
t(0,,)⫽ mt
mt⫹nt
. (3)
P(Sik⫽sik)⫽
(Dklk)sike⫺Dklk
sik!
. (8)
0represents the fraction of mutants that might already be
available at the start of the experiment. Statistical analysis: Equation 8 presents the main model Every cyclekencompasseslgenerations.Joyceet al. (2005) used in our data analysis and provides the link between the showed that for the purposes of statistical analysis one can mathematical modeling and the statistical analysis, which pro-assume that the fraction of mutants at the end of each cycle, ceeded in three stages. First, the model was fitted to the data
lk, is deterministic and unaffected by the bottleneck. [While using a maximum-likelihood approach. We estimated the
to the general model by using a likelihood-ratio test and a various time points as by taking samples of sizenfor each of rreplicated experiments. Since replicating the experiment is parametric bootstrap approach.
Parameter estimation:To estimate the parameters,, and more time consuming and expensive than simply taking larger samples, one might think that our article argues against
repli-0, we used the method of maximum likelihood (Bainand
Engelhardt1991;Rice1995). The probability of a data set cation. However, one has a much better chance of detecting violations of model assumptions if one replicates the experi-S ⫽{sik} given the modelMis referred to as the likelihood
of that data set under the model. Using the Poisson model ment. Our program can be downloaded at the website http:// www.webpages.uidaho.edu/ⵑjoyce/Lab page/Evo-x.html. The approximation (Equation 8) and assuming that we have rk
independent replicates per cyclekand that these replicates user’s manual that can be downloaded along with the program provides detailed information on the effect of departures from are independent across cycles, the likelihood of the data set
Sgiven the model is model assumptions and how to test for these departures.
Comparing the different models:We compared the mutation-alone and the selection-mutation-alone models to the full model. The P(S|Dk,,,0)⫽
兿
k僆K
兿
rki⫽1
P(Sik⫽sik|Dk,,,0)
likelihood-ratio test statistic needed to compare the mutation-alone model to the full model is given by
⫽
兿
k僆K
兿
rki⫽1
(Dklk)sike⫺Dklk
sik!
. (9)
⌳M⫺F⫽
LM(ˆ0,ˆ) L(ˆ0,ˆ,ˆ)⫽ ⌳
M(ˆ0,ˆ)
⌳(ˆ0,ˆ,ˆ), (12) Multiple methods are available for maximizing the likelihood
of the data. We used the Nelder-Mead algorithm (Nelder whereLis the likelihood function as defined in Equation 9, andMead1965) implemented in both MatLab6.5 and R1.6.2 (ˆ0,ˆ,ˆ) are the MLEs, and⌳M(ˆ0,ˆ) and⌳(ˆ0,ˆ, ˆ) are (GNU license). The resulting estimated parameters are re- the absolute goodness-of-fit likelihood test statistics (Equation ferred to as the maximum-likelihood estimates (MLEs). Pro- 10) for the mutation-alone and the full models, respectively. grams, using MatLab6.5 and R1.6.2 (http://www.r-project. Taking the natural log the following equation was obtained: org), were developed for estimation. These programs are
avail-⫺2 ln(⌳M⫺F)⫽ ⫺2 ln(⌳M(ˆ0,ˆ))⫹2 ln(⌳(ˆ0,ˆ,ˆ)). able through the web under http://www.webpages.uidaho.edu/
ⵑjoyce/Lab page/Evo-x.html.
(13) Absolute goodness of fit:The absolute goodness-of-fit test for
each of the three models considered is based on the null A similar setup for the comparison of the selection-alone hypothesis that the data are Poisson distributed withE(Sik)⫽ model to the full model results in
Dklkagainst the alternative that eachSikis Poisson distributed
⫺2 ln(⌳S⫺F)⫽ ⫺2 ln(⌳S(ˆ0,ˆ))⫹2 ln(⌳(ˆ0,ˆ,ˆ)). with a different meanik(Rice1995). The associated
likeli-(14) hood-ratio test (LRT) statistic⌳is derived inappendix cand
given by
A 2000-replicates parametric bootstrap was also used to gener-ate the distribution of the LRT. MatLab6.5 and R1.6.2 (http://
⌳ ⫽
兿
k僆K
兿
rki⫽1
冢
Dkˆlk
sik
冣
sike⫺Dkˆlk⫹sik, (10)
www.r-project.org) programs in the S language were also devel-oped for this analysis and are also available at http://www.web where ˆlkis the estimated proportion of mutants at the end pages.uidaho.edu/ⵑjoyce/Lab page/Evo-x.html.
of thekth cycle, computed by replacing the null-model param-eters by the MLEs in the solution of Equation 4. The solution
equation needed changes depending on which model is tested RESULTS
(see Equations 5–7). By the invariance principle of the MLEs
(Rice 1995), ˆlk is also a MLE. Therefore, this estimate is Experimental results: Detection of tetracycline-sensitive
different for each of the three absolute goodness-of-fit tests. clones:We sought to monitor the loss of antibiotic resis-Taking the natural logarithm of the likelihood-ratio statistic
tance in anE. coliK12 population carrying the
multire-⌳results in the following familiar format:
sistance plasmid pB10 during a long-term evolution ex-periment in a medium without antibiotics. To do this,
⫺2 ln(⌳)⫽2
冤
兺
k僆K
兺
rki⫽1
冤
sikln
冢
sik
Dkˆlk
冣
⫹(Dkˆlk⫺sik)
冥冥
. (11)10 independent lineages were evolved forⵑ500 genera-tions in serial batch cultures. Loss of resistance to tetra-We used a parametric bootstrap (EfronandTibshirani1993)
to estimate the distribution of this⫺2 ln⌳test statistic. For cycline or amoxicillin was monitored weekly in 6 of the each case, 2000 data sets were simulated under the Poisson 10 lines starting from day 14, as well as in the 2 founding distribution of the null model, taking its MLEs to be the true
cultures. Tetracycline sensitive (TcS) clones were de-parameter values. Then we estimated the MLEs for each of the
tected in the founding cultures (0.15%) and their frac-simulated data sets, thus generating a sampling distribution for
these MLEs. This sampling distribution was used to construct tion gradually increased on average over 500 genera-confidence intervals and genera-confidence regions for the MLEs tions toⵑ6% (Joyceet al.2005). All but one of the TcS associated with the actual data. Applying Equation 11 to each clones were still resistant to amoxicillin and streptomy-of the simulated data sets and their associated MLEs we
gener-cin, indicating a very high plasmid maintenance. Since ated a distribution of the⫺2 ln⌳test statistic. The proportion
the frequency of the TcS clones was rather variable, of times that the simulated⫺2 ln⌳values were greater than
the⫺2 ln⌳calculated using the actual data set resulted in a probably due to the small sample size (maximum of 52 P-value. This proportion is an estimate of the probability that clones per culture per time point), a new sampling a LRT value greater than or equal to the one observed would scheme that fixed the relative error rate at 0.21 was actually occur given that the hypothesized model is true.
derived (Joyce et al. 2005). This allowed us to more It is interesting to note that if the above model assumptions
precisely determine the fraction of the TcSmutants in are accurate, then one can gain the same amount of
TABLE 1
Fraction of tetracycline-sensitive mutants found in 10 parallel and independent lineages over 504 generations, as well as the predicted fractions under the three models
Observed fractions
Sample Predicted fractions
Generation: size: WT1: WT2: WT3: WT4: WT5: Km1: Km2: Km3: Km4: Km5:
lk Dk s1k s2k s3k s4k s5k s6k s7k s8k s9k s10k Mean M & S S M
0 1000 0.002 0.001 0.0015 0.0013 0.0029 0.0010
104 208 0.010 0.000 0.000 0.010 0.005 0.005 0.010 0.000 0.010 0.005 0.0053 0.0063 0.0059 0.0107 200 104 0.010 0.019 0.019 0.000 0.010 0.010 0.010 0.019 0.010 0.000 0.0106 0.0137 0.0113 0.0196 304 67 0.015 0.060 0.075 0.015 0.030 0.015 0.030 0.015 0.090 0.030 0.0373 0.0266 0.0229 0.0292 400 52 0.058 0.058 0.000 0.000 0.058 0.096 0.077 0.038 0.058 0.038 0.0481 0.0453 0.0436 0.0379 504 44 0.045 0.136 0.091 0.023 0.068 0.000 0.023 0.114 0.114 0.068 0.0682 0.0766 0.0853 0.0473 Each independent lineage is labeled as either WT1–5 [E. coliK12(pB10) lineages] or Km1–5 [E. coliK12::Km(pB10) lineages]. kdenotes the cycle andlthe number of generations per cycle (l⫽8).Dkis the number of clones screened andsik(i⫽1, 2, 3,
. . . 10) is the observed fraction of mutants for each replicateiat cyclek. M & S, mutation and selection model; S, selection-alone model; M, mutation-selection-alone model.
generation. As shown in Table 1, the fractions of mu- lated from a clone obtained at generation 500 [yielding K12::Km(pM57)], and this strain was competed against tants observed in these new samples showed a clear
increasing trend over time. All TcSclones obtained were the ancestral host with ancestral plasmid K12(pB10). The selection coefficient (s-value) was 0.0273, which was still resistant to amoxicillin, indicating that they had not
lost the entire plasmid. not significantly different (P⫽0.974) from thes-value (0.0271) of the control experiment that detected fitness
Characterization of the plasmids of tetracycline-sensitive
mu-tants:To examine whether the loss of tetracycline resis- differences due to the chromosomal marker [K12::Km
(pB10) vs. K12(pB10)]. The results of these pairwise tance was due to deletions or rearrangements in the
plasmid, restriction fragment length polymorphisms competition experiments suggest that deletion of the plasmid fragment containing the tet operon did not (RFLPs) of the plasmids were determined. Comparison
of these RFLPs with the theoretical restriction map of measurably increase the host fitness. Therefore it ap-plasmid pB10 (Schlu¨ teret al. 2003) showed that the
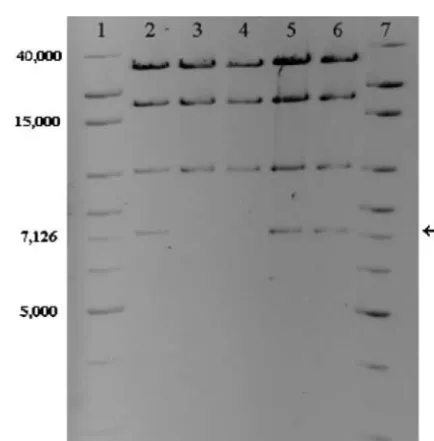
plasmids of all 73 sensitive clones examined lacked a 7057-bpHindIII fragment, whereas the patterns of ran-domly picked TcR clones were not different from that of the ancestral plasmid (Figure 1). ANotI restriction analysis performed on a few TcS clones showed that the 13,920-bpNotI fragment was not present in their plasmids. Analysis of the plasmid sequence revealed that the differences in RFLPs arose as the result of deletion of a 5.5-kb region that included the tetracycline-resistance operon (tetA,tetR) and was flanked by two direct repeats of 863 bp. This suggests that the sensitivity to tetracycline in the mutants was due to deletion of thetetoperon by recombination between the direct repeats. To further analyze this deletion event, this region of plasmids from 18 mutants from six different lineages was amplified using primers described above and sequenced. All PCR products obtained from the sensitive clones showed identical DNA sequences, in which only one of the direct repeats was still present and the sequence in between the repeats was absent. This indicated that the deletion
of the tetracycline-resistance operon was caused by a Figure1.—HindIII RFLP patterns of ancestral and evolved plasmids. Lanes 1 and 7, 1-kb extended ladder, 5g and 10 recombination event between the two flanking direct
g, respectively; lane 2, ancestral pB10; lanes 3 and 4, plasmid repeats.
DNA from TcSmutants; lanes 5 and 6, plasmid DNA from
Competition experiments: To investigate the effects of evolved TcRclones. Arrow indicates missing band in TcS
mu-the mutated plasmid on host fitness, mu-the ancestral host tants. Colors were inverted and brightness and contrast were adjusted to enhance the quality of the image.
iso-peared that the increase in frequency of the TcSmutants could not be attributed to a selective advantage.
Modeling and statistical analysis: Parameter estimates
and confidence intervals:A mathematical model was
devel-oped to capture the observed dynamics of the TcS mu-tants in the population. Overall, the data analysis strongly indicated that both selection and frequency of muta-tion, as described by the full model, seemed to affect the population dynamics of the mutants. Neither selection alone nor mutation alone could explain the observed patterns of population increase as well as the full model did. Using the full model, the selection coefficient was estimated to be 0.00699 and the rate of mutation was estimated to be 3.11 ⫻ 10⫺5/generation (Table 2). The MLEs and their confidence intervals were sig-nificantly distinct from zero in each of the three cases. Further corroboration of this conclusion is indicated in Figure 2, which presents the bootstrapped joint 94.8% confidence region for the mutation rateand the selec-tion coefficientof the full model. This region excludes zero, indicating that the parameter estimates are sig-nificant positive quantities. The joint confidence region can be thought of as an inverted likelihood-ratio test: it is the set of all the parameter values consistent with the hypothesized model. The MLE of the selection coef-ficient increased by 142% in the selection-alone model compared to its estimated value using the full model. This increase compensates for the absence of mutation in this model. When considering mutation alone in the model, the MLE of the mutation rate increased by 303% from its value calculated using the full model. The third parameter, the initial fraction of mutants 0, was esti-mated under each model and also found to be signifi-cantly different from zero (Table 2).
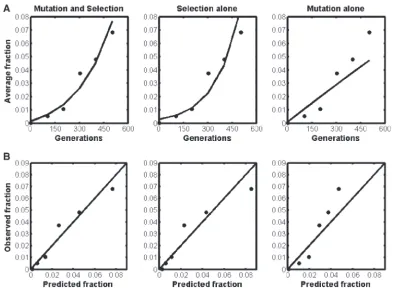
Testing the models:Utilizing the MLEs and each of the
three models, we calculated the average proportion of the mutants at the end of each of the sampled genera-tions (Table 1). These predicgenera-tions were used to con-struct Figure 3. The closer the dispersion of the circles around the curves in Figure 3A or the diagonal solid line in Figure 3B, the better the fit. On the basis of this, both the mutation and the selection and the selection-alone models seem to be fitting the data better than the mutation-alone model, which drastically underesti-mated the mean mutant proportions toward the end of the experiment. Table 3 introduces the bootstrapped likelihood-ratio results for both the absolute goodness-of-fit tests and the model-comparison tests. TheP-value of the absolute goodness-of-fit tests confirmed that the proposed full and selection-alone models fit the data quite well, while the mutation-alone model (P-value⫽ 0.0065) does not. The P-values associated with testing the selection-alone and the mutation-alone models against the full model were 0.0025 and 0, respectively. This provides clear statistical evidence that the full model is significantly better than the other two simple models.
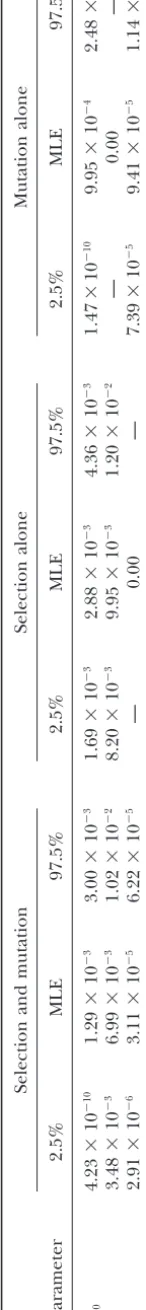
TABLE 2 Maximum-likelihood p arameter estimators and their 95% confidence intervals for each model Selection a nd mutation Selection alone Mutation alone Parameter 2.5% MLE 97.5% 2.5% MLE 97.5% 2.5% MLE 97.5% 0 4.23 ⫻ 10 ⫺ 10 1.29 ⫻ 10 ⫺ 3 3.00 ⫻ 10 ⫺ 3 1.69 ⫻ 10 ⫺ 3 2.88 ⫻ 10 ⫺ 3 4.36 ⫻ 10 ⫺ 3 1.47 ⫻ 10 ⫺ 10 9.95 ⫻ 10 ⫺ 4 2.48 ⫻ 10 ⫺ 3 3.48 ⫻ 10 ⫺ 3 6.99 ⫻ 10 ⫺ 3 1.02 ⫻ 10 ⫺ 2 8.20 ⫻ 10 ⫺ 3 9.95 ⫻ 10 ⫺ 3 1.20 ⫻ 10 ⫺ 2 — 0.00 — 2.91 ⫻ 10 ⫺ 6 3.11 ⫻ 10 ⫺ 5 6.22 ⫻ 10 ⫺ 5 — 0.00 — 7.39 ⫻ 10 ⫺ 5 9.41 ⫻ 10 ⫺ 5 1.14 ⫻ 10 ⫺ 4 The lower and upper con fi dence limits are found by taking the 2.5 a nd 97.5% percentiles, respectively, of the bootstrap distribution under e ach model. MLE, maximum-likelihood parameter estimator; 0 , initial fraction o f mutants; , selection coef fi cient; , mutation rate.
Figure2.—Plot of the joint 94.8% bootstrapped confidence region for both the mutation rateand the selection coefficient
. The solid diamonds represent the joint parameter estimate of the mutation rateand the selection coefficient.
mutation, together, played a significant role in the ob- totic theory and provides the correct sampling distribu-tions under the model assumpdistribu-tions.
served evolutionary process. Figure 4 provides a visual examination of the absolute goodness-of-fit results.
The bootstrap vs. the asymptotic theory: Under certain
DISCUSSION regularity conditions that guarantee that the MLEs are
asymptotically normally distributed, the⫺2 ln(⌳) test We observed a gradual increase in the frequency of statistic (plotted in Figure 4 for each model) is2
distrib-a tetrdistrib-acycline-sensitive subpopuldistrib-ation during experi-uted in the limit as the sample size increases (Bickel mental evolution ofE. coli K12(pB10) in the absence and Doksum 1977; Self and Liang 1987; Bain and of antibiotics and showed that this phenotypic change Engelhardt1991). Accordingly, it is tempting to use was caused by deletion of the plasmid-encodedtet op-the asymptotic op-theory raop-ther than op-the bootstrap in hy- eron. The extent to which these tetracycline-sensitive pothesis testing; the2distribution is readily tabulated
mutants sweep through a population and replace the and only degrees of freedom have to be known to find residing resistant clones was determined by the muta-theP-values. However, our simulations definitely showed tion rate and the selection coefficient associated with that the asymptotic2distribution was not valid (results
this phenotypic and genotypic change. Therefore we not shown). The use of the2 distribution resulted in
asymp-Figure 3.—Population dynamics of the tetracy-cline-sensitive mutants. (A) Time course of the observed (䊉) and predicted (—) av-erage fractions of mutants under each of the three mathematical models. (B) Ratios of observed vs. pre-dicted fractions of mutants under each model. The solid lines indicate identical observed and predicted val-ues. All replicate and aver-age values are reported in Table 1.
petition experiments. Rejecting both the mutation-alone 10⫺5/generation. This value corresponds fairly well with and selection-alone models with high statistical signifi- the estimate we obtained experimentally by determining cance in favor of the full model (mutation and selec- the fraction of TcSmutants in a colony grown overnight tion) highlighted the strong impact of both mutation on LB agar, founded by a cell from an overnight culture and selection together on the dynamics of the sensitive of K12(pB10) in LBTc. Out of 941 clones screened within subpopulation. the colony, 3 had lost thetetoperon afterⵑ26 genera-As confirmed by sequencing, the loss of tetracycline tions [⫽ log2(108)], yielding a deletion frequency of resistance in all sensitive clones examined can be attrib- ⵑ1.2⫻10⫺4/generation. This high mutation frequency uted to a recombination event between two direct re- is due to the specific nature of the mutation, namely a peats present on the plasmid that are flanking the tet recombination event. In general, recombination fre-operon. According to the parameter estimates of the quencies have been reported from as high as 10⫺3to as “mutation and selection” model, the frequency of the low as 10⫺11 (Dianov et al. 1991; Mazin et al. 1991; deletion of thetetoperon was determined to be 3.11⫻ Lovettet al.1994;BiandLiu1996) depending on the length of the direct repeats and the distance between them. Considering the long direct repeats (863 bp)
TABLE 3 flanking the tet operon and the large fragment being
deleted (5.5 kb), the estimated high mutation frequency Parametric bootstrap maximum-likelihood-ratio tests
of 3.11 ⫻ 10⫺5/generation is in agreement with the
Model ⫺2 ln(⌳) P-value range of values previously described. Thus, in the
ab-sence of antibiotics, this fragment containing the tet
Mutation and selection 59.169 0.3395
operon was systematically lost at a fairly high rate,
caus-Selection alone 63.551 0.2440
ing a tetracycline-sensitive subpopulation to emerge and
Mutation alone 73.848 0.0650
Selectionvs. mutation and selection 4.381 0.0025 to expand initially according to a linear pattern. In the Mutationvs. mutation and selection 14.678 0.0000 absence of selection, continuous deletion events would result in a steady increase of the TcSpopulation as de-In the first three rows, theP-value is an estimate of the
scribed by the “mutation-alone” model (Figure 3A). probability that a⫺2 ln⌳value greater than or equal to the
one observed would actually occur given that the hypothesized In addition to deletions of resistance genes from a model is true. For the last two rows, it gives an estimate of plasmid, the loss of the entire plasmid itself could also the probability that a difference in model scores would be as
cause resistance to decline in a bacterial population. large as or larger than the one actually seen if the data came
Although the fitness cost of carrying the plasmid pB10 from the selection-alone and mutation-alone models,
Figure 4.—Pictorial repre-sentation of the bootstrap like-lihood-ratio test (LRT) out-comes for each mathematical model. The plotted density is the bootstrap sampling distri-bution of the LRT,⫺2 ln ⌳. TheP-value (pBoot) is the area under the curve to the right of the dashed vertical lines (corre-sponding to the ⫺2 ln ⌳ ob-served value). It represents the probability that a LRT value greater than or equal to the one observed would actually occur given that the hypothe-sized model is true.
one plasmid-free segregant out of 7086 screened clones introduces considerable variation between replicate competition experiments, lowering the statistical power was detected during the 500 generations of evolution.
This indicates that the plasmid was very stably main- of the test. Ideally, competition experiments are con-ducted only for one growth cycle (Lenskiet al. 1991; tained, which is a known characteristic for IncP-1
plas-mids (Thomas2004), or that plasmid-free segregants were DahlbergandChao2003), although an increased sen-sitivity can be obtained by measuring fitness over several rapidly reinfected by plasmid-carrying cells (Thomas
2004). A similar observation has recently been made cycles (Dahlberg and Chao 2003). However, in the latter case, mutations, not just those at thetetlocus but by Dahlberg and Chao (2003), where during 1100
generations no plasmid-free cells were ever detected in also in the chromosome, could be a confounding factor that can influence the competition process in the long R1- or RP4-bearing populations under antibiotic-free
conditions, although a large fitness cost for carrying the run. Both the mutant and ancestral populations would continue to evolve during a long competition experi-plasmid had been determined. These results suggest
that even though resistance plasmids confer a cost to ment and one would have a difficult time trying to demonstrate that the differences in fitness were due to their host, plasmid-free segregants will not necessarily
form and thus cannot sweep through the population, the original mutation,i.e., thetetdeletion. In our study competition experiments were already run for three thereby lowering the level of resistance. It also follows
that the loss of one resistance gene on a multiresistance growth cycles, or 24 generations, and extending this pe-riod is thus not recommended. In our view the strength plasmid such as pB10 may still leave the host with other
plasmid-encoded resistance determinants. of the modeling effort lies in its ability to produce a better way of detecting small fitness differences between evolved In competition experiments, we did not detect a
sig-nificant fitness advantage for the ancestralE. coli K12 and ancestral strains compared to a competition experi-ment. This was achieved by reproducing the observed carrying a deleted evolved plasmid compared to
car-rying the ancestral plasmid. On the other hand, the patterns on the basis of hypothesized processes (mutation and selection acting together) and provided appropriate parameter estimate of the selection coefficient under
the mutation and selection model was determined to be explanations and predictions. Furthermore, the proposed processes were adequately tested statistically.
0.007 and statistically significantly different from zero.
Selection coefficients of⬍1% are considered to be quite The small cost imposed by the tetracycline-resistance determinant encoded on plasmid pB10 may be explained low and difficult or even impossible to detect with
statis-tical significance in a competition experiment (Levin by the presence of the repressor TetR, which represses expression of tetAin the absence of tetracycline. This
et al.1997;AnderssonandLevin1999). This is
TABLE 4
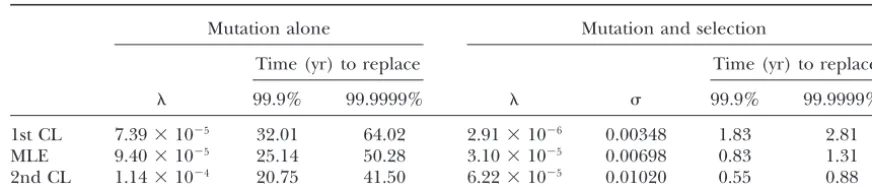
Long-term predictions for the decline of the tetracycline-resistant population
Mutation alone Mutation and selection
Time (yr) to replace Time (yr) to replace
99.9% 99.9999% 99.9% 99.9999%
1st CL 7.39⫻10⫺5 32.01 64.02 2.91⫻10⫺6 0.00348 1.83 2.81
MLE 9.40⫻10⫺5 25.14 50.28 3.10⫻10⫺5 0.00698 0.83 1.31
2nd CL 1.14⫻10⫺4 20.75 41.50 6.22⫻10⫺5 0.01020 0.55 0.88
Predicted time required to displace the resistant population to 1/1000 (99.9% sensitive) and to 1/1,000,000 (99.9999% sensitive) under the mutation-alone model and the mutation and selection model is shown. 1st CL and 2nd CL represent the limits of a 95% confidence interval. MLE is the maximum-likelihood estimator.
that deletion of a constitutively expressed plasmid- This is quite different from our approach where we formally fitted the model to the data.
encodedtetoperon drastically increased host fitness in
the absence of tetracycline (Modiet al.1991), but that In response to the widespread emergence of multire-sistant pathogens, a number of measures have been carrying an inducible tetracycline-resistance operon
im-poses essentially no burden (LeeandEdlin1985;Ngu- proposed to reverse this trend, including cycling differ-ent antibiotics and reductions of antibiotic use (Levy yenet al.1989).
The rigorous combination of mathematical model- 1994;OTA1995;WHO1995;Bonhoefferet al.1997; Lenski 1997; WHO2003). It is believed that this will ing, statistical methods, and biological experiments,
ap-plied in this work, is rarely seen in our field.Lenskiet allow sensitive clones with a selective advantage to sweep through the population and thereby eliminate their
re-al.(1991) used a regression framework to fit an
evolu-tionary model to their data, including only selection, sistant counterpart (Levinet al.1997) as seen byModi
et al.(1991) in evolution experiments. Our study shows
and compared the differences between the fitnesses of
their bacterial lineages using ANOVA. They also intro- that such elimination of drug resistance proceeds very slowly when the cost of resistance is very small. Yet even duced models to explain the dynamics of their
experi-ments that included the mutation rate although did not such a small selective advantage is of great importance in the long run, as shown by comparison of predictions estimate parameters for these models using the data.
Instead, they used their fitness estimate and an estimate made by the mutation-alone and the full model (Table 4). The mutation-alone model predicts that even with of the effective population size to infer the mutation
rate associated with some of these models. Austin et the high estimated mutation rate, replacing 99.9% of the resistant population with TcS mutants would take
al. (1999) have fit a model to data on occurrence of
resistance levels in hospitals and estimated the corre- between 21 and 32 years at eight generations per day. However, when including the small drug-resistance cost sponding parameters, using weighted least squares, but
they did not thoroughly evaluate its goodness of fit, nor ( ⫽0.007) in the mutation and selection model, such a replacement of 99.9% would take only between 0.55 did they test the significance of their parameters. In
contrast, we used the method of maximum likelihood and 1.83 years. To reach the same replacement level in 5 weeks on average, the resistance cost should be at (Fisher1922) to fit our models and estimated the
asso-ciated parameters on the basis of the experimental data. least 0.06, which is realistic for a constitutively expressed tetracycline operon on a high-copy-number plasmid Likelihood-ratio tests and the parametric bootstrap were
used to evaluate the goodness of fit and to quantify (Modi et al.1991), but not for an induced resistance on a low-copy-number broad-host-range plasmid. Our our confidence in these models. Many studies present
mathematical models that describe evolutionary pro- findings thus indicate once again that the cost of resis-tance is the key factor to successfully displace antibiotic-cesses involving bacteria (Bonhoefferet al.1997;Levin
et al. 1997;Otto andWhitlock1997; Bergstromet resistant populations with sensitive ones (Spratt1996;
Lenski1997;Levin2001), and that the time required
al.2000;WahlandKrakauer2000;WahlandGerrish
2001;JohnsonandBarton2002;Martiel2002;Wahl for this, after ending the drug treatment, may be very long. Moreover, even with 0.0001% of the resistant
pop-et al. 2002). In general, such studies focus more on
presenting the model itself and often do not fit experi- ulation still present in the environment, which would take ⵑ1.3 years (Table 4), the reintroduction of the mental data to the model. In the few cases where these
studies involve data (Levinet al.1997;WahlandKra- antibiotic will cause the resistant bacteria to ascend to high frequencies again, at a much higher pace than the kauer 2000;Wahlet al. 2002), these are usually used
of Health (NIH) grant P20 RR 16448 from the Centers of Biomedical
Heinemannet al.2000). Thus, as a guideline for
design-Research Excellence Program of the National Center for design-Research
ing new antibiotics, our results support the statement
Resources. Its contents are solely the responsibility of the authors and
made earlier (BjorkmanandAnderson2000) that the do not necessarily represent the official views of NIH. Paul Joyce is cost for bacteria to acquire and maintain resistance to also funded by the National Science Foundation (NSF DEB-0089756
and NSF DMS-0072198).
drugs should be as high as possible, and that models can be used to estimate this cost.
We realize that our model simulates the population
dynamics only under the conditions of the evolution LITERATURE CITED experiment, and that predictions made for time points
Andersson, D. I., andD. Hughes, 1996 Muller’s ratchet decreases
far away from our experimental data should be interpre- fitness of a DNA-based microbe. Proc. Natl. Acad. Sci. USA93: ted with caution. However, as stated by Bruce Levin 906–907.
Andersson, D. I., and B. R. Levin, 1999 The biological cost of
(Lenski1997, p. 149), “mathematical models with
em-antibiotic resistance. Curr. Opin. Microbiol.2:489–493.
pirical estimates of their parameters” are the only way Austin, D. J., K. G. KristinssonandR. M. Anderson, 1999 The
relationship between the volume of antimicrobial consumption
“to predict the rate of descent of resistance genes and
in human communities and the frequency of resistance. Proc.
plasmids” and “should be employed to develop
antibiot-Natl. Acad. Sci. USA96:1152–1156.
ics use policy” instead of “irresponsible non-quantitative Bain, L. J., andB. Engelhardt, 1991 Introduction to Probability and
Mathematical Statistics.Duxbury Press, Belmont, CA.
yak-yak.” Our modeling approach with empirical
esti-Bergstrom, C. T., M. LipsitchandB. R. Levin, 2000 Natural
selec-mates of parameters is a step in this direction that is
tion, infectious transfer and the existence conditions for bacterial
unique among the studies that have observed sweeps of plasmids. Genetics155:1505–1519.
Bi, X., andL. F. Liu, 1996 A replication model for DNA
recombina-antibiotic-sensitive mutants under laboratory conditions
tion between direct repeats. J. Mol. Biol.256:849–858.
(GodwinandSlater1979;Modi et al.1991; Turner
Bickel, P. J., andK. A. Doksum, 1977 Mathematical Statistics: Basic
et al.1998;DahlbergandChao2003). Ideas and Selected Topics.Holden-Day, Oakland, CA.
Bjorkman, J., andD. I. Anderson, 2000 The cost of antibiotic
resis-We aim to expand our methodology of modeling
tance from a bacterial perspective. Drug Resist. Upd.3:237–245.
and testing to study other experimental evolutionary
Bonhoeffer, S., M. Lipsitch andB. R. Levin, 1997 Evaluating
systems. To do so we will consider other factors that may treatment protocols to prevent antibiotic resistance. Proc. Natl. Acad. Sci. USA94:12106–12111.
affect the evolutionary process and are unaccounted for
Bo¨ ttger, E. C., B. Springer, M. PletschetteandP. Sander, 1998
in our current modeling, such as compensatory muta- Fitness of antibiotic-resistant microorganisms and compensatory tions (Bo¨ ttgeret al.1998; Bjorkman andAnderson mutations. Nat. Med.4:1343–1344.
Bouma, J. E., andR. E. Lenski, 1988 Evolution of a bacteria/plasmid
2000;Levinet al.2000;NormarkandNormark2002),
association. Nature335:351–352.
background selection on the host and/or on the plas- Cohen, M. L., 1992 Epidemiology of drug resistance: implications mid, plasmid loss, and horizontal plasmid transfer. With for a post-antimicrobial era. Science257:1050–1055.
Dahlberg, C., andL. Chao, 2003 Amelioration of the cost of
conju-our current model these effects would likely add noise
gative plasmid carriage inEscherichia coliK12. Genetics165:1641–
across lines in other experiments. A statistical test to 1649.
detect this added noise is included in the user manual Dianov, G. L., A. V. Kuzminov, A. V. MazinandR. I. Salganik, 1991 Molecular mechanisms of deletion formation in
Esche-for our program.
richia coli plasmids. I. Deletion formation mediated by long direct
In conclusion, we have shown that a tetracycline-sensi- repeats. Mol. Gen. Genet.228:153–159.
tive subpopulation ofE. coliK12(pB10) emerged during Drake, J. W., 1991 A constant rate of spontaneous mutation in DNA-based microbes. Proc. Natl. Acad. Sci. USA88:7160–7164.
evolution in an antibiotic-free medium due to deletion
Drake, J. W., B. Charlesworth, D. CharlesworthandJ. F. Crow,
of thetetoperon. A mathematical model helped explain 1998 Rates of spontaneous mutation. Genetics148:1667–1686. the population dynamics, estimating a high mutation Dro¨ ge, M., A. Pu¨ hlerandW. Selbitschka, 2000 Phenotypic and molecular characterization of conjugative antibiotic resistance
rate and a low but significant selection coefficient, and
plasmids isolated from bacterial communities of activated sludge.
allowed us to make long-term predictions regarding the Mol. Gen. Genet.263:471–482.
elimination of antibiotic resistance in the population. Efron, B., andR. J. Tibshirani, 1993 An Introduction to the Bootstrap. Chapman & Hall, New York.
The mathematical modeling and statistical analyses thus
Enderle, P. J., andM. A. Farwell, 1998 Electroporation of freshly
worked in perfect symbiosis with the experimental as- platedEscherichia coliandPseudomonas aeruginosacells. BioTech-pects of this study. The predictions call into question niques25:954–958.
Fisher, R. A., 1922 On the mathematical foundations of theoretical
the general effectiveness of drug cycling as a strategy
statistics. Philos. Trans. R. Soc. Lond. Ser. A222:309–368.
to eradicate resistance. Although we do not want our Flores, M., P. Mavingui, X. Perret, W. J. Broughton, D. Romero observations to be interpreted as arguments for the futil- et al., 2000 Prediction, identification, and artificial selection of DNA rearrangements in Rhizobium: toward a natural genomic
ity of reduced and more prudent drug use, we caution
design. Proc. Natl. Acad. Sci. USA97:9138–9143.
against too much optimism regarding eliminating resis- Gibbons, A., 1992 Exploring new strategies to fight drug-resistant tance to antibiotics by drug cycling. microbes. Science257:1036–1038.
Godwin, D., andJ. H. Slater, 1979 The influence of the growth We thank two anonymous reviewers for useful comments and sug- environment on the stability of a drug resistance plasmid in gestions. We thank Holger Heuer for the primer design and Mayee Escherichia coliK12. J. Gen. Microbiol.111:201–210.
Wong for help with sequencing. Furthermore, we thank Stacey Poler, Heinemann, J. A., R. G. AnkenbauerandC. F. Amabile-Cuevas, Whitney Weibler, Erin Quinn, and Monica Flory for their technical 2000 Do antibiotics maintain antibiotic resistance? Drug Discov.
Helling, R. B., T. KinneyandJ. Adams, 1981 The maintenance Tn10 tetracycline-resistance operon on the fitness ofEscherichia coliK12. Mol. Biol. Evol.6:213–225.
of plasmid-containing organisms in populations ofEscherichia coli.
J. Gen. Microbiol.123:129–141. Normark, B. H., andS. Normark, 2002 Evolution and spread of antibiotic resistance. J. Intern. Med.252:91–106.
Johnson, T., and N. H. Barton, 2002 The effect of deleterious
alleles on adaptation in asexual populations. Genetics162:395– OTA, 1995 Impacts of Antibiotic-Resistant Bacteria. Office of Technol-ogy Assessment, United States Congress, Washington, DC. 411.
Joyce, P., Z. Abdo, J. Ponciano, L. De Gelder, L. J. Forneyet al., Otto, S. P., andM. C. Whitlock, 1997 The probability of fixation in populations of changing size. Genetics146:723–733. 2005 Modeling the impact of periodic bottlenecks,
unidirec-tional mutation, and observaunidirec-tional error in experimental evolu- Rice, J. A., 1995 Mathematical Statistics and Data Analysis.Duxbury Press, Belmont, CA.
tion. J. Math. Biol. (in press).
Lee, S. W., andG. Edlin, 1985 Expression of tetracycline resistance Ross, K. A., 1991 Elementary Analysis: The Theory of Calculus. Springer-Verlag, New York.
in pBR322 derivatives reduces the reproductive fitness of
plasmid-containingEscherichia coli.Gene39:173–180. Sambrook, J., andD. W. Russel, 2001 Molecular Cloning: A Laboratory Manual. Cold Spring Harbor Laboratory Press, Cold Spring
Har-Lenski, R. E., 1997 The cost of antibiotic resistance—from the
per-spective of the bacterium, pp. 131–151 in Antibiotic Resistance: bor, NY.
Schlu¨ ter, A., H. Heuer, R. Szczepanowski, L. J. Forney, C. M. Origins, Evolution, Selection and Spread, edited by S. B.Levy. John
Wiley & Sons, Chichester, UK. Thomaset al., 2003 The 64,508 bp IncP-1B antibiotic multiresis-tance plasmid pB10 isolated from a wastewater treatment plant
Lenski, R. E., M. R. Rose, S. C. SimpsonandS. C. Tadler, 1991
provides evidence for recombination between members of differ-Long-term experimental evolution inEscherichia coli. I. Adaptation
ent branches of the IncP-1B group. Microbiology149:3139–3153. and divergence during 2,000 generations. Am. Nat.138:1315–
Schrag, S. J., V. PerrotandB. R. Levin, 1997 Adaptation to the 1341.
fitness costs of antibiotic resistance inEscherichia coli. Proc. R.
Lenski, R. E., S. C. SimpsonandT. T. Nguyen, 1994 Genetic analysis
Soc. Lond. Ser. B264:1287–1291. of a plasmid-encoded, host genotype-specific enhancement of
Self, S. G., andK. Liang, 1987 Asymptotic properties of maximum bacterial fitness. J. Bacteriol.176:3140–3147.
likelihood estimation and likelihood tests under nonstandard
Levin, B. R., 2001 Minimizing potential resistance: a population
conditions. J. Am. Stat. Assoc.398:605–610. dynamics view. Clin. Infect. Dis.33(Suppl 3): S161–S169.
Spratt, B. G., 1996 Antibiotic resistance: counting the cost. Curr.
Levin, B. R., M. Lipsitch, V. Perrot, S. J. Schrag, R. Antia et
Biol.6:1219–1221. al., 1997 The population genetics of antibiotic resistance. Clin.
Stanier, R. Y., N. J. PalleroniandM. Doudoroff, 1966 The aero-Infect. Dis.24(Suppl 1): S9–S16.
bic pseudomonads: a taxonomic study. J. Gen. Microbiol.43:
Levin, B. R., V. PerrotandN. Walker, 2000 Compensatory
muta-159–271. tions, antibiotic resistance and the population genetics of
adap-Thomas, C. M., 2004 Evolution and population genetics of bacterial tive evolution in bacteria. Genetics154:985–997.
plasmids, pp. 509–528 inPlasmid Biology, edited by B. E.Funnell Levy, S. B., 1994 Balancing the drug-resistance equation. Trends
and G. J.Phillips. ASM Press, Washington, DC. Microbiol.2:341–342.
Turner, P. E., V. S. CooperandR. E. Lenski, 1998 Tradeoff between
Lovett, S. T., T. J. Gluckman, P. J. Simon, V. A. Sutera, Jr. and
horizontal and vertical modes of transmission in bacterial
plas-P. T. Drapkin, 1994 Recombination between repeats in
Esche-mids. Evolution52:315–329. richia coliby arecA-independent, proximity-sensitive mechanism.
Wahl, L. M., andP. J. Gerrish, 2001 The probability that beneficial Mol. Gen. Genet.245:294–300.
mutations are lost in populations with periodic bottlenecks.
Evo-Martiel, J. L., 2002 Transposable elements and fitness of bacteria.
lution55:2606–2610. Theor. Popul. Biol.61:509–518.
Wahl, L. M., andD. C. Krakauer, 2000 Models of experimental
Mazin, A. V., A. V. Kuzminov, G. L. DianovandR. I. Salganik,
evolution: the role of genetic chance and selective necessity. 1991 Molecular mechanisms of deletion formation in Esche- Genetics156:1437–1448.
richia coli plasmids. II. Deletions mediated by short direct repeats. Wahl, L. M., P. J. GerrishandI. Saika-Voivod, 2002 Evaluating
Mol. Gen. Genet.228:209–214. the impact of population bottlenecks in experimental evolution.
Modi, R. I., andJ. Adams, 1991 Coevolution in bacterial-plasmid Genetics162:961–971.
populations. Evolution45:656–667. WHO, 1995 Scientific working group on monitoring and
manage-Modi, R. I., C. M. Wilke, R. F. RosenzweigandJ. Adams, 1991 Plas- ment of bacterial resistance of antimicrobial agents. WHO/CDS/ mid macro-evolution: selection of deletions during adaptation in BVI 7, World Health Organization, Geneva.
a nutrient-limited environment. Genetica84:195–202. WHO, 2003 Impact of antimicrobial growth promoter termination
Nelder, J. A., andR. Mead, 1965 A simplex algorithm for function in Denmark. WHO/CDS/CPE/ZFK/2003.1, World Health
Orga-minimization. Comput. J.7:308–313. nization, Geneva.
Nguyen, T. N. M., Q. G. Phan, L. P. Duong, K. P. Bertrandand
R. E. Lenski, 1989 Effects of carriage and expression of the Communicating editor: H.Ochman
APPENDIX A: IMPORTANT RECURSION
appendix brelies heavily on the solution of the following recursion in deriving the models used in this article:
zt⫽azt⫺1⫹cbt⫺1⫹d. (A1)
It follows by induction that
z1⫽ az0⫹c ⫹d
z2⫽ az1⫹cb⫹d ⫽a2z0 ⫹(a⫹b)c⫹ (a ⫹1)d
z3⫽ az2⫹cb2 ⫹d⫽ a3z0⫹ (a2⫹ab⫹b2)c⫹ (a2⫹a ⫹1)d
z4⫽ az3⫹cb3⫹d ⫽a4z0⫹ (a3⫹a2b⫹ ab2 ⫹b3)c⫹(a3⫹ a2⫹ a⫹1)d,
zt⫽atz0⫹ cat⫺1
兺
t⫺1
i⫽0
冢
b a
冣
i
⫹d
兺
t⫺1i⫽0
ai.
Using a geometric series identity (Ross1991, p. 69, Equation 1) results in
zt ⫽atz
0⫹ c
at⫺bt
a ⫺b ⫹d
1⫺at
1⫺a. (A2)
APPENDIX B: DERIVATION OF EQUATIONS 6, 7, AND 8
Let the average number of mutants at a certain time t be mt and the average of the remaining nonmutant individuals in periodtbent. Therefore, the total population at timet is the sum ofmtandnt. We relist Equations 1, 2, and 3 for convenience:
mt⫽ 21⫹mt
⫺1⫹2nt⫺1 (1)
nt⫽ 2(1⫺ )nt⫺1 (2)
t(0,,)⫽ mt
mt⫹ nt. (3)
To solve Equation 3, which represents the proportion of mutants at time t, we need to solve the recursions in Equations 1 and 2. The solution of Equation 2 is obvious:
nt⫽(2(1⫺ ))tn
0. (B1)
To solve Equation 1 we start by substituting Equation B1 in it to get
mt⫽ 21⫹mt
⫺1⫹2(2(1⫺ ))t⫺1n0. (B2)
Note that this is the same format as that of Equation A1 witha⫽21⫹,b⫽2(1⫺ ), andc⫽2n
0. Therefore, we use Equation A2 to solve Equation B2:
mt ⫽2t(1⫹)m
0 ⫹2n0
2t(1⫹)⫺ (2(1⫺ ))t
21⫹⫺ 2(1⫺ ) ⫽2
t
冤
2tm0 ⫹ n0
2t ⫺(1⫺ )t
2⫺(1⫺ )
冥
. (B3)Using Equations B1 and B3 we can now solve Equation 3. We first note that
t(0,,)⫽ mt
mt⫹ nt⫽ 1⫺
nt
mt ⫹nt; (B4)
hence,
t(0,,)⫽ 1⫺
2t(1⫺ )tn
0 2t[2t
m0⫹ n0((2t⫺(1 ⫺ )t)/(2⫺(1⫺ )))⫹n0(1⫺ )t] .
Rearranging,
t(0,,)⫽ 1⫺
(1 ⫺ )t n
0(2⫺(1⫺ )) 2tm
0(2⫺(1 ⫺ ))⫹ n0(2t⫺(1⫺ )t)⫹n0(1⫺ )t(2⫺(1 ⫺ )) .
Noting that0⫽m0/(m0⫹n0), by definition, results in
t(0,,)⫽1⫺
(1⫺ )t(1⫺ 0)(2⫺(1 ⫺ ))
2t0(2 ⫺(1⫺ ))⫹ (1⫺ 0)(2t⫺ (1⫺ )t)⫹ (1⫺ )t(1⫺ 0)(2⫺(1 ⫺ )).
Rearranging again,
t(0,,)⫽
2t0(2⫺ (1⫺ ))⫹ (1⫺ 0)(2t ⫺(1⫺ )t)
2t0(2⫺ (1⫺ ))⫹ (1 ⫺ 0)(2t⫺(1 ⫺ )t)⫹ (1⫺ )t(1 ⫺ 0)(2⫺ (1⫺ )), (B5)
APPENDIX C: DERIVATION OF THE ABSOLUTE GOODNESS-OF-FIT LIKELIHOOD-RATIO TEST STATISTIC The absolute-best Poisson model fits the data exactly and, hence, exactly predicts the number of mutants in a sample. Such a model has a parameter for each replicate,i, and at each cycle we sample,k. We call this parameter ik, corresponding to the expected number of mutants in the current replicatei at the kth cycle. The
likelihood-ratio test statistic⌳associated with this absolute goodness-of-fit test is
⌳ ⫽max
兿
k僆K兿
rk
i⫽1(Dklk)sike⫺Dklk/sik!
max
兿
k僆K兿
rki⫽1(ik)sike⫺ik/sik!
(C1)
⫽
兿
k僆K兿
rki⫽1(Dkˆlk)sike⫺Dklk/sik!
兿
k僆K兿
rik⫽1(sik)sike⫺sik/sik!. (C2)
C2 holds as the maximum for the numerator is attained at the maximum-likelihood estimateˆlk, and the maximum
for the denominator holds when the data are predicted exactly. Some algebraic manipulation results in Equa-tion 10:
⌳ ⫽
兿
k僆K
兿
rki⫽1冢 Dkˆlk
sik