ISSN (Online): 2319-8753 ISSN (Print) : 2347-6710
International Journal of Innovative Research in Science,
Engineering and Technology
(A High Impact Factor, Monthly, Peer Reviewed Journal)
Visit: www.ijirset.com
Vol. 7, Issue 1, January 2018
Phonocardiogram and Electrocardiogram
Signals Processing using Wavelet Transform
and Multilayer Perceptron Neural Network
Pascalin Tiam Kapen 1, Celeo Baldry Tchatchouang Tchoupo 2
Assistant Lecturer, Department of Biomedical Engineering, Energy and Construction, Higher Institute of Sciences and
Technology, Université des Montagnes, Bangangté, Cameroon 1
P.G. Student, Department of Biomedical Engineering, Energy and Construction, Higher Institute of Sciences and
Technology, Université des Montagnes, Bangangté, Cameroon 2
ABSTRACT: This article deals with an original approach of acquiring and processing electrocardiogram (ECG) and phonocardiogram (PCG) signals for the diagnosis of cardiac arrhythmias in order to remedy the difficulties encountered with the ECG. Indeed, it integrates an analysis tool based on wavelet transforms for the characterization of ECG signals and a classification system from multilayer perceptron neural network of five categories of cardiac arrhythmias: normal (N), left bundle branch block (LBBB), right bundle branch block (RBBB), premature atrial contraction (PAC) and premature ventricular contraction (PVC). The digitization of the signals is made from an Arduino Mega 2560 board. The realized system has been tested on 6 patients and the results are visualized on a smart phone turning under android operating system. These results are in agreement with medical previsions. Recognition rates are as follows: 100% for class N, 100% for class LBBB, 75% for class RBBB, 90.9% for class PVC and 100% for class PAC. We obtain a generalization rate of 92.9%.
KEYWORDS: Electrocardiogram (ECG), Phonocardiogram (PCG), Cardiac arrhythmias, Multilayer perceptron neural network, Wavelet transforms.
I. INTRODUCTION
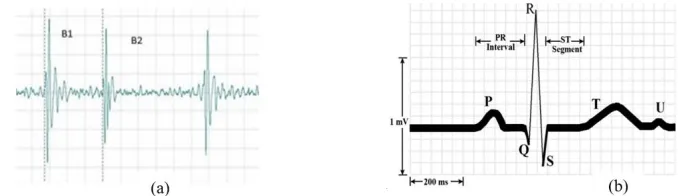
Fig 1: (a) Normal PCG signal, (b) Normal ECG signal
Regarding the ECG signal, the main information that provides precisions about the quality of the cardiac signal is contained in the QRS complex. This is the most pronounced feature visible on an ECG. Various methods based on wavelets are proposed in the literature to extract the main information. Among the most widely used are the Haar wavelets [3, 4], the Mexican hat [5, 6], the Morlet wavelets [7, 8], the quadratic spline wavelets [9] and even their combination [10]. In [11], the authors propose an algorithm for the detection of the QRS complex for an ECG signal containing the EMG frequencies. They obtain results equivalent to those highlighted in [12, 13]. The detection of the QRS complex by using the Haar discrete transformation has been presented in [14]. This algorithm achieves a correct classification rate of 95.74% on 5 records from patients. Dinh et al. [15] use the cubic spline wavelets for the detection of the QRS complex. They get an average error of 0.75%. Alvarado et al. [16] consider the continuous wavelet transform for the characterization of the QRS complex. This approach is tested on eight 30-minutes records from the MIT-BIH database. It leads to an error rate of 0.47%. Finally, the authors of [17] consider the non-stationary nature of the QRS complex for the detection of R peaks and propose an approach combining the Hilbert transformation in combination with a sliding averaging filter. They obtain a classification rate of 99.80% on 48 recordings of the MIT-BIH signal base. The use of wavelet transform process based on quadratic wavelets for identifying individual ECG waves has been proposed by Gutiérrez et al. [18]. After the identification of ECG waves, the results are transferred to a classifier process. Numerous processes have been used in the literature. For instance, the authors in [19] use a multilayer, 3-input neuron, feedforward artificial neural network trained with supervised backpropagation; the results are better than those obtained using multiple regression analysis. The use of RR-interval for arrhythmia classification has been presented in [20]. The method of multilayer perceptron artificial neural network has been developed and compared with linear discriminant analysis in [21].
II. MATERIALANDMETHOD
ISSN (Online): 2319-8753 ISSN (Print) : 2347-6710
International Journal of Innovative Research in Science,
Engineering and Technology
(A High Impact Factor, Monthly, Peer Reviewed Journal)
Visit: www.ijirset.com
Vol. 7, Issue 1, January 2018
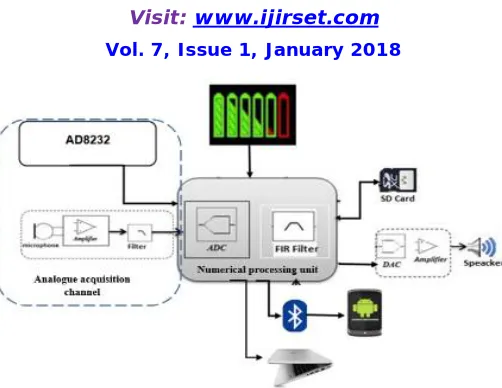
Fig 2 : Operating diagram
A. MATERIAL The material used in our work consists of:
- An electret condenser microphone for capturing PCG signals; - A TDA 2822 for amplifying and listening to cardiac sounds; - The AD8232 for the acquisition of the ECG signal;
- An ATMEGA 2560 microcontroller card for digitizing cardiac signals from the analogue acquisition stage; - An Arduino shield SD for saving digitized signals;
- A Bluetooth module HC06 for sending data to the smartphone; - An Android smartphone for viewing different curves;
- A PC for the characterization and classification of ECG signals.
B. Methods
II.B.1 PCG Acquisition
The acquisition of the PCG signal is done by means of an electret condenser microphone. It is a circuit whose frequency range is between 20 and 20,000 Hz. It has been chosen with regard to the characteristics of the following microphones:
Table 1: Comparison of microphone characteristics
The acquired signal of the microphone is filtered by means of a band pass filter of order 2 by cascading a high-pass filter and a low-pass filter whose cut-off frequencies are respectively 20 and 994.718 Hz. The signal from the acquisition stage is digitized using the Arduino board and transmitted via Bluetooth to the smartphone for its visualization. This is an illustration in fig 3.
Type of microphones
Electret Condenser Microphone (ECM)
Dynamic Piezoelectric Preference
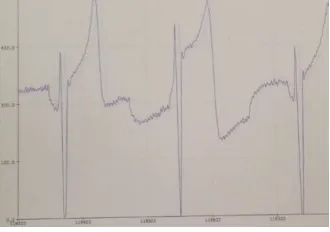
Fig 3: PCG Signal of a patient
II.B.2 ECG Acquisition
For ECG signal acquisition, we use the AD8232. It’s an integrated signal conditioning block for ECG. Its role is to extract, amplify and filter small bio potential signals in the presence of noisy conditions, such as those created by motion or remote electrode placement. This design allows for ultralow power analog-to-digital converter (ADC) or an embedded microcontroller to acquire the output signal easily. The AD8232 can implement a two-pole high-pass filter for eliminating motion artefact and the electrode half-cell potential. This filter is tightly coupled with the instrumentation architecture of the amplifier to allow both large gain and high-pass filtering in a single stage, thereby saving space and cost.
Fig 4: ECG signal of a patient
II.B.3 ECG SIGNAL PROCESSING
There are two main steps in ECG signal processing. The first is pre-processing, which consists of filtering and standardizing data. The second consists in the characterization of the signal using the wavelet method to obtain the inputs of our neural classifier.
a. PREPROCESSING
ISSN (Online): 2319-8753 ISSN (Print) : 2347-6710
International Journal of Innovative Research in Science,
Engineering and Technology
(A High Impact Factor, Monthly, Peer Reviewed Journal)
Visit: www.ijirset.com
Vol. 7, Issue 1, January 2018
Once the preprocessing has been carried out, it is important to normalize the signal to reduce the calculation time in the rest of the process. To do this, the average value is taken from each sample in order to eliminate the offset effect.
Subsequently, we divide by the maximum.
b. CHARACTERIZATION OF ECG SIGNAL
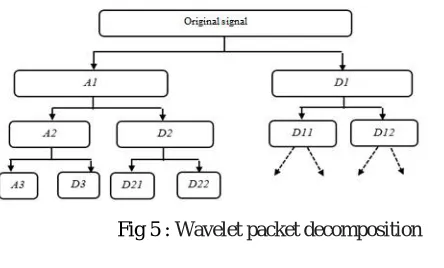
In this work, we rely on the wavelet packet transformation proposed by Coifman and Wicker Hausser. The principle is to generate from a mother wavelet a library of base wavelets. Each of these bases provides a unique representation of the original signal. This library is constructed by decomposing the spaces of the approximations and that of the details. This algorithmic approach is illustrated in the following figure.
Fig 5 : Wavelet packet decomposition
DETECTION OF R PEAKS
The detection of R peaks is the most important step in the detection of the QRS complex since the detection of the other waves depends on the reliability of this step. In order to detect the R peaks, the details specific to the QRS complexes will be selected. Eight wavelet decomposition levels are performed on the pre-processed ECG signal using the db4 wavelet. Details D3 to D6 are retained and all others are deleted. The reconstruction of the signal is thus carried out from the preserved details. This makes it possible to keep the QRS complex in the signal obtained and to eliminate the other low and high frequency components. The signal obtained is squared in its positive part to accentuate the R wave and attenuate the other waves. Adaptive thresholding is performed to detect the R peak.
DETECTION OF Q AND S WAVES
After the detection of R peaks, Q and S must be identified to locate the QRS complex. In general, Q and S waves have a small amplitude but a high frequency and their energy are mainly small scale. To show them, we keep only the details D5 to D7 for the reconstruction of the signal. Moreover, Q and S are negative deflections which occur on either side of the peak R over a maximum interval of 0.1 second. Q being located on the left is considered as the minimum amplitude that precedes the peak R and S to the right is the maximum amplitude that follows it.
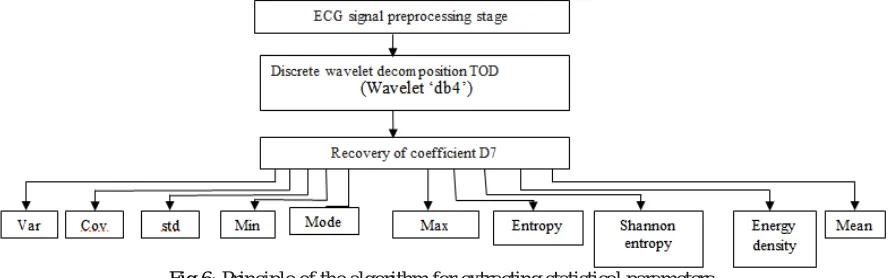
In order to increase the discrimination rate of our classifier, we have also computed the following parameters by means of the wavelet transformation: The minimum, maximum, mean, mode, covariance, variance, standard deviation, entropy, energy density, entropy according to Shannon. The principle is described in the following flowchart:
Fig 6: Principle of the algorithm for extracting statistical parameters
The set of computed elements constitute the elements of the input vector for the characterization, learning and classification of ECG signals for the diagnosis.
II.B.4 ECG SIGNAL PROCESSING
For the final classification, we used a multilayer perceptron neural network. The number of neurons in the input layer is fixed relative to the number of elements of our vector. In this study, we opted for 19 elements of discrimination which thus constitute the size of our input vector. The size of the output vector corresponds to the number of different classes of pathologies. In our case, we used 5 cardiac arrhythmias: N, LBBB, RBBB, PVC and PAC. After several tests, we selected a choice of 12 neurons as a component for the hidden layer.
III.EXPERIMENTAL PROTOCOL
ISSN (Online): 2319-8753 ISSN (Print) : 2347-6710
International Journal of Innovative Research in Science,
Engineering and Technology
(A High Impact Factor, Monthly, Peer Reviewed Journal)
Visit: www.ijirset.com
Vol. 7, Issue 1, January 2018
Table 2: MIT-BIH database records
IV.EXPERIMENTALRESULTS
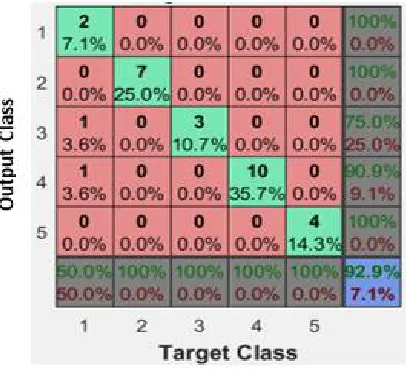
Our algorithm was tested on the MIT-BIH signal base records and on six patients. We obtained the following confusion matrix at the end of our various tests:
Fig 7: Confusion matrix
From this confusion matrix generated by Matlab:
- Output class corresponds to the result given by the neural network once implemented; - Target class is the expected result;
- On the diagonal, we observe the correct classification rates of each class studied and the number of elements correctly classified.
On output, the correct classification rate is shown in green, and the invalid classification rate of each sample per class is shown in red. The first class corresponds to the normal class, the second to the left bundle branch block, the third to the right bundle branch block, the fourth to the premature ventricular contraction and the fifth to the premature atrial contraction. From the resulting confusion matrix, we observe that the unidentified normal beats are designated by our classifier as right bundle branch blocks and premature ventricular contraction. As for the rest, no beating is classified outside its category. This situation reinforces the credibility of the choice of the 19 parameters used in the
Class of heartbeat
N LBBB RBBB PVC PAC
Records MIT-100 MIT-103 MIT-105 MIT-108
MIT-112 MIT-113 MIT-114 MIT-117 MIT-115
MIT-109 MIT-111 MIT-207 MIT-214
MIT-118 MIT-124 MIT-212 MIT-232 MIT-231
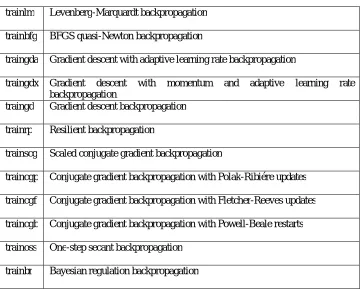
learning phase, we carried out a comparative study. First, we have listed all the retropopagation functions present in the toolbox and we have evaluated the performance of each of them. These various algorithms are listed in Table 3.
Table 3: Matlab retropropagation functions
trainlm Levenberg-Marquardt backpropagation
trainbfg BFGS quasi-Newton backpropagation
traingda Gradient descent with adaptive learning rate backpropagation
traingdx Gradient descent with momentum and adaptive learning rate backpropagation
traingd Gradient descent backpropagation
trainrp Resilient backpropagation
trainscg Scaled conjugate gradient backpropagation
traincgp Conjugate gradient backpropagation with Polak-Ribiére updates
traincgf Conjugate gradient backpropagation with Fletcher-Reeves updates
traincgb Conjugate gradient backpropagation with Powell-Beale restarts
trainoss One-step secant backpropagation
trainbr Bayesian regulation backpropagation
The trainbr function is the one for which we have obtained the best rate of generalization. For the evaluation of the
performance and quality of the neural network classification, we determined the sensitivity for each type of class represented.
Table 4: Sensitivity of the proposed method for each class
Evaluation parameter Beat type Value (%)
Sensitivity
Normal 100 LBBB 100
RBBB 75
PVC 90.9 PAC 100
Correct classification rate 92.9
ISSN (Online): 2319-8753 ISSN (Print) : 2347-6710
International Journal of Innovative Research in Science,
Engineering and Technology
(A High Impact Factor, Monthly, Peer Reviewed Journal)
Visit: www.ijirset.com
Vol. 7, Issue 1, January 2018
Table 5: Comparison of our results with those of the literature
V. CONCLUSION
Throughout this work, an original method of acquisition and processing of electrocardiogram (ECG) and phonocardiogram (PCG) signals for the diagnosis of cardiac arrhythmias has been presented. For the PCG signal, the acquisition has been performed by means of an electret condenser microphone. The signal obtained has been visualized on a smart phone turning under android operating system. For the ECG signal, the approach consisted of an analysis tool based on wavelet transforms for the characterization of ECG signals and a classification system from multilayer perceptron neural network of five categories of cardiac arrhythmias: normal (N), left bundle branch block (LBBB), right bundle branch block (RBBB), premature atrial contraction (PAC) and premature ventricular contraction (PVC). Our confusion matrix showed a classification rate of 92.9 % which is a promising result. The recognition rates obtained for the different arrhythmias were: 100% for N, 100% for LBBB, 75% for RBBB, 90.9% for PVC and 100% for PAC. It would be interesting to extend the present approach to the recognition of other arrhythmias like: auricular fibrillation, sinoauricular heart block and supraventricular tachycardia.
Author Processing method Feature classification Classification accuracy This work Wavelet Transform and Multilayer
Perceptron Neural Network.
5 heartbeats 92.90 %
Jose Antonio Gutierrez et al. [18]
Wavelet Transform and Probabilistic Neural Network.
8 heartbeats conditions 92.75 %
Ebrahimnezhad et al.[22] Linear predictive coefficients and Probabilistic Neural Network.
4 heartbeats conditions 92.90 %
Tsipouras et al.[23] Collection of Digital Signal Processing methods.
4 heartbeats conditions 94% (arrhythmic episode) and 98 %
(arrhythmic beat classification) Homaeinezhad et al.[24] Wavelet transform and Fuzzy
inference classification (FCM clustering).
QRS geometrical complex
94.58 %
de Chazal et al. [26] Collection of Digital Signal Processing methods.
5 heartbeats conditions Multiple reports, overall 96.4 %
Lin et al.[27] Wavelet Transform and Probabilistic Neural Network.
7 heartbeats conditions 97% (High) classification rate for a
single arrhythmia, decreases when signals
contain multiple arrhythmias Homaeinezhad et al.[28] Wavelet transform and Fuzzy
inference classification (Subtractive clustering).
QRS geometrical complex
97.41 %
Yu et al.[29] Wavelet Transform and Probabilistic Neural Network.
REFERENCES
[1] Visagie C. Screening for abnormal heart sounds and murmurs by implementing Neural Networks (Doctoral dissertation, Stellenbosch: University of Stellenbosch).
[2] BELGACEM A. Classification des signaux EGC avec un système-multi-agent neuronale (Doctoral dissertation).
[3] A. Gutiérrez, M. Lara, P.R. Hernandez, A QRS detector based on Haar wavelet, evaluation with MIT-BIH arrhythmia and European ST-T Databases, Comp.Syst. 8 (April–June (4)) (2005) 293–302.
[4] M. Kaneko, T. Gotho, F. Iseri, K. Takeshida, H. Ohki, N. Sueda, QRS complex analysis using wavelet transform and two layered self-organizing map, Comput. Cardiol. 38 (2011) 813–816.
[5] P.S. Addison, Wavelet transforms and the ECG: a review, Physiol. Meas. 26 (2005) R155–R199.
[6] M.J. Burke, M. Nasor, The time relationships of the constituent components of the human electrocardiogram, J. Med. Eng. Technol. 26 (January– February (1)) (2002) 1–6.
[7] A. Schuck, J.O. Wisbeck, QRS detector pre-processing using the complex wavelet transform, in: Proceedings of the 25th Annual International Conference of the IEEE Engineering in Medicine and Biology Society, 17–21 September, (3), 2003, pp. 2590–2593.
[8] V.P. Vassilikos, L. Mantziari, G. Dakos, V. Kamperidis, I. Chouvarda, Y.S.Chatzizisis, P. Kalpidis, E. Theofilogiannakos, S. Paraskevaidis, H. Karvounis, S. Mochlas, N. Maglaveras, I.H. Styliadis, QRS analysis using wavelet transformation for the prediction of response to cardiac resynchronization therapy: a prospective pilot study, J. Electrocardiol. 47 (January–February 1) (2014) 59–65.
[9] C.-I. Ieong, P.-I. Mak, C.-P. Lam, C. Dong, A 0.83-W QRS detection processor using quadratic spline wavelet transform for wireless ECG Acquisition in 0.35-m CMOS, IEEE Trans. Biomed. Circuits Syst. 6 (December 6) (2012) 586–595.
[10] C. Zeng, H. Lin, Q. Jiang, M. Xu, QRS complex detection using combination of Mexican-hat wavelet and complex Morlet wavelet, J. Comput. 8 (November 11) (2013) 2951–2958.
[11] S. Kadambe, R. Murray, G.F. Boudreaux-Bartels, Wavelet transform-based QRS complex detector, IEEE Trans. Biomed. Eng. 46 (July (7)) (1999) 838– 848.
[12] P.S. Hamilton, W.J. Tompkins, Quantitative investigation of QRS detection rules using the MIT/BIH arrhythmia database, IEEE Trans. Bio-Med. Eng. BME 33 (December (12)) (1986) 1157–1165.
[13] M. Okada, A digital filter for the QRS complex detection, IEEE Trans. Bio-Med. Eng. BME 26 (December (12)) (1979) 700–703. [14] G. Jaswal, R. Parmar, A. Kaul, QRS detection using wavelet transform, Int. J.Eng. Adv. Tech. 1 (August 6) (2012) 1–5.
[15] H.A.N. Dinh, D.K. Kumar, N.D. Pah, P. Burton, Wavelets for QRS detection, in: Proceedings of the 23rd IEEE Annual International Conference of the IEEE Engineering in Medicine and Biology Society, Oct. 25–28, Istanbul, Turkey, Vol. 2, 2001, pp. 1883–1887.
[16] C. Alvarado, J. Arregui, J. Ramos, R. Pallás-Areny, Automatic detection of ECG ventricular activity waves using continuous spline wavelet transform, in: Proceedings of the 2nd International Conference on Electrical and Electronics Engineering (ICEEE) and XI Conference on Electrical Engineering (CIE 2005), Mexico City, Mexico, September 7–9, 2005, pp. 189–192.
[17] M.S. Manikandan, K.P. Soman, A novel method for detecting R-peaks in electrocardiogram (ECG) signal, Biomed. Signal Process. 7 (March (2)) (2012) 118–128.
[18] Gutiérrez-Gnecchi JA, Morfin-Magaña R, Lorias-Espinoza D, del Carmen Tellez-Anguiano A, Reyes-Archundia E, Méndez-Patiño A, Castañeda-Miranda R. DSP-based arrhythmia classification using wavelet transform and probabilistic neural network. Biomedical Signal Processing and Control. 2017 Feb 28; 32:44-56.
[19] H. Atoui, J. Fayin, P. Rubel, A neural network approach for patient-specific 12-lead ECG synthesis in patient monitoring environments, Proceedings IEEE Computers in Cardiology (2004), pp. 161-164.
[20] M.G. Tsipouras, D.I. Fotiadis, D. SiderisAn arrhythmia classification system based on the RR-interval signal Artif. Intell. Med., 33 (March (3)) (2005), pp. 237-250.
[21] P. de Chazal, M. O’Dwyer, R.B. ReillyAutomatic classification of heartbeats using ECG morphology and heartbeat interval features, IEEE Trans. Bio-Med. Eng., 51 (July (7)) (2004), pp. 1196-1206.
[22] H. Ebrahimnezhad, S. Khoshnoud, Classification of arrhythmias using linear predictive coefficients and probabilistic neural network, Appl. Med. Inf. 33 (September (3)) (2013) 55–62.
[23] M.G. Tsipouras, D.I. Fotiadis, D. Sideris, An arrhythmia classification system based on the RR-interval signal, Artif. Intell. Med. 33 (March (3)) (2005) 237–250.
[24] M.R. Homaeinezhad, E. Tavakkoli, A. Ghaffari, Discrete wavelet-based fuzzy network architecture for ECG rhythm-type recognition: feature extraction and clustering-oriented tuning of fuzzy inference system, Int. J. Signal Process. Image Process. Pattern Recogn. 4 (September (3)) (2011) 107–129. [25] C. Alexakis, H.O. Nyongesa, R. Saatchi, N.D. Harris, C. Davies, C. Emery, R.H. Ireland, S.R. Heller, Feature extraction and classification of
electrocardiogram (ECG) signals related to hypoglycaemia, Proc. Comput. Cardiol. 30 (2003) 537–540.
[26] P. de Chazal, M. O’Dwyer, R.B. Reilly, Automatic classification of heartbeats using ECG morphology and heartbeat interval features, IEEE Trans. Bio-Med. Eng. 51 (July (7)) (2004) 1196–1206.
[27] C.H. Lin, Y.C. Du, T. Chen, Adaptive wavelet network for multiple cardiac arrhythmias recognition, Expert Syst. Appl. 34 (May 4) (2008) 2601–2611. [28] M.R. Homaeinezhad, E. Tavakkoli, A. Ghaffari, Discrete wavelet-based fuzzy network architecture for ECG rhythm-type recognition: feature extraction
and clustering-oriented tuning of fuzzy inference system, Int. J. Signal Process. Image Process. Pattern Recogn. 4 (September (3)) (2011) 107–129. [29] S.N. Yu, Y.H. Chen, Electrocardiogram beat classification based on wavelet transformation and probabilistic neural network, Pattern Recogn. Lett. 28