Potential of A Method for Text Analytics Directly on Compressed Data
FENG ZHANG
†‡⋄, JIDONG ZHAI
⋄, XIPENG SHEN
#, ONUR MUTLU
⋆, WENGUANG CHEN
⋄,
†KeyLaboratory of Data Engineering and Knowledge Engineering (Renmin University of China), MOE, China ‡School of In-formation, Renmin University of China, China ⋄Department of Computer Science and Technology, Tsinghua University, China #Computer Science Department, North Carolina State University, USA⋆Department of Computer Science, ETH Zurich, Switzerland
Today’s rapidly growing document volumes pose pressing challenges to modern document analytics, in both space usage and processing time. In this work, we propose the concept ofcompression-based direct processingto alleviate issues in both dimensions. The main idea is to enable direct document analytics on compressed data. We present how the concept can be materialized on Sequitur, a compression method that produces hierarchical grammar-like representations. We discuss the major complexities in applying the idea to various document analytics tasks, and reveal a set of guidelines and also assistant software modules for developers to effectively applycompression-based direct processing. Experiments show that the method saves 90.8% storage space and 87.9% memory usage, while speeding up data processing significantly (on average, 1.6X on sequential systems, and 2.2X on distributed clusters).
Additional Key Words and Phrases: Text Analytics, Domain Specific Language, Compiler
1 INTRODUCTION
Document analytics refers to the class of data analytics that derives certain statistics, patterns, insights or knowledge from some textual documents, including textual contents of web pages, system log files, phone or email records. Document analytics plays an essential role in many applications, ranging from web search to system diagnosis, security, and so on.
Document analytic applications are time-consuming, especially as the data to process keeps growing rapidly. At the same time, they often need a large amount of space, both in storage and memory.
A common approach to mitigate the space concern is data compression. By compressing the data on disk, it often reduces the storage usage by several factors. That however does not alleviate, but actually worsens, the time concern. In current document analytics frameworks, compressed document sets have to be decompressed before being processed. The decompression step even lengthens the end-to-end processing time.
This work investigates the feasibility of efficient data analytics on compressed data without decompressing it. Its motivation is two-fold. First, it could avoid the decompression time. Second, more importantly, it could save some processings. Space savings by compression fundamentally stem from repetitions in the data. So if the analytics algorithms could leverage the repetitions that the compression algorithm already uncovers, it could avoid some unnecessary repeated processings, and hence shorten the processing time significantly. Compression takes time. But many datasets (e.g., government document archives, electronic book collections, historical Wikipedia datasets [1]) are used for various analytics tasks by many users repeatedly. For them, the compression time is well justified by the repeated usage of the compression results.
This paper presents our systematic explorations of that idea. We base our study on a specific compression algorithm named Sequitur[25] for the hierarchical structure of its compression results (detailed in Section 2).
We first introduce the concept ofcompression-based direct processing, and then analyze the complexities of document analytics to achieve a high efficiency on compressed data (Section 4).
Through in-depth studies on a set of core algorithms used in document analytics, we come up with a set of solutions and insights on tackling those challenges. These insights range from algorithm designs, to data structure selections, scalable implementations, and adaptations to problems and datasets. We draw on several common document analytics problems as examples to provide some concrete explanations of those insights, providing the essential guidelines and some techniques for fully exerting the potential of compression-based document analytics (Section 5).
In addition to the insights and guidelines, this work yields an immediate usable artifact, theCompressDirectlibrary. It offers a set of modules to ease the applications of the guidelines. At the same time, it provides highly performant implementations
Author’s address: Feng Zhang†‡⋄, Jidong Zhai⋄, Xipeng Shen#, Onur Mutlu⋆, Wenguang Chen⋄, †Key Laboratory of Data Engineering and Knowledge
Engineering (Renmin University of China), MOE, China, ‡School of Information, Renmin University of China, China,⋄Department of Computer Science and
Technology, Tsinghua University, China,#Computer Science Department, North Carolina State University, USA,⋆Department of Computer Science, ETH
of six frequently used algorithms in document analytics, in sequential, parallel, and distributed versions; they can be directly plugged into existing applications to generate some immediate benefits.
Our evaluation validates the efficacy of the proposed techniques for saving both space and time. Compared to data analytics on the original uncompressed datasets, our techniques reduce storage usage by 90.8% and memory usage by 87.9%. At the same time, they speed up the analytics by 1.6X for sequential runs, and 2.2X for Spark-based distributed runs.
To our knowledge, this work is the first that enables high performance complex document analytics directly on compressed data. Succinct [2] offers a way to enable queries on compressed data, but it is designed to support only simple search and random access queries, rather than the complex functionalities usually required for sophisticated document analytics. Data deduplication [21] saves storage space, but does not save repeated processing of the data.
Overall, this work makes the following major contributions:
• It presents the first method for enabling high performance complex document analytics directly on compressed data, and details the realizations onSequitur.
• It unveils the complexities of conductingcompression-based document analyticsand reveals a set of solutions and insights, which provide the essential guidelines for applying the method to high performance document analytics on compressed data.
• It validates the efficacy of the proposed techniques, demonstrates their significant benefits in both space and time savings on large datasets, and offers a high performant library for some common operations in document analytics.
2 PREMISES AND BACKGROUND
There are many compression algorithms for documents, such as LZ77 [36], suffix array [23], and their variants. Our study focuses on Sequitur [25] for the natural fit of its compression results for direct processing.
Sequitur is a recursive algorithm that infers a hierarchical structure from a sequence of discrete symbols. For a given sequence of symbols, it derives a context-free grammar (CFG), with each rule in the CFG reducing a repeatedly appearing string into a single rule ID. By referencing the original string with the rule ID in the CFG, Sequitur makes it output CFG more compact than the original dataset.
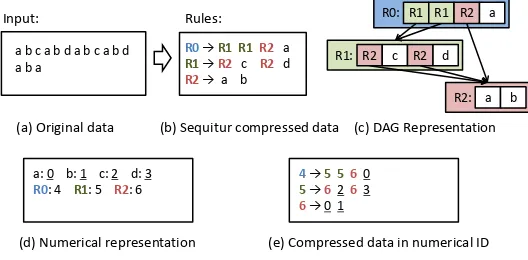
Figure 1 illustrates the compression results of Sequitur on an input string. Figure 1(a) shows the original input, and Figure 1(b) shows the output of Sequitur in form of a CFG. The CFG uncovers the repetitions in the input string as well as the hierarchical structure of the string. It uses R0 to represent the entire string, which consists of substrings represented by R1 and R2. The two instances of R1 in R0 reflect the repetition of “a b c a b d” in the input string. Similarly, the two instances of R2 in R1 reflect the repetition of “a b” in the substring of R1. The output of Sequitur is often visualized with a directed acyclic graph (DAG) as Figure 1(c) shows. The edges indicate the hierarchical relations among the rules.
R2: R1:
R0:
R0→ R1 R1R2 a
R1 → R2 c R2 d R2 → a b a b c a b d a b c a b d
a b a
Input: Rules:
(a) Original data (b) Sequitur compressed data (c) DAG Representation R1 R1 R2
R2 c R2 d
a b
a: 0 b: 1 c: 2 d: 3 R0: 4 R1: 5 R2: 6
(d) Numerical representation
4 → 5 5 60
5→ 6263 6→ 0 1
(e) Compressed data in numerical ID a
Fig. 1. A compression example with Sequitur.
Figure 1(d) gives the numeric representations of the words and rules in Figures 1(a,b), while Figure 1(e) shows the CFG in the numerical IDs.
A limitation of Sequitur is that its compression is relatively slow. However, it is important to note that our technique is designed for datasets that are repeatedly used by many users. For them, the compression time is not a main concern as the compression results can be used for many times by different users for various analytic tasks again and again. These datasets are common, ranging from electronic book collections to historical Wikipedia pages [1], government document archives, law firm archived collections, historical news collections, and so on. On the other hand, Sequitur has several properties that make it appealing for our use. First, the CFG structure in its results makes it easy to find repetitions in input strings. Second, its output consists of the direct (sequences of) input symbols rather than other indirect coding of the input (e.g., the distance used in LZ77 [36] and suffix array [23]). These properties make Sequitur a relatively easy fit for materializing the idea of compression-based document analytics. With these said, we do not rule out the possible feasibility on other compression algorithms. The insights attained in this work hopefully could give some enlightenments when other compression algorithms are explored in the future.
3 TYPICAL DOCUMENT ANALYTICS
Before presenting the proposed technique, we first describe three commonly performed document analytics tasks. They each feature some different complexities that are typical to many document analytics, offering examples later sections use for our discussions.
3.1 Word Count
Word count[3, 4, 29] is a basic algorithm in document analytics, which is widely used in applications of document classification, clustering, and theme identification. It counts the total appearances of every word in a given dataset, which may consist of a number of files.
• Input: {file1, file2, file3, file4, file5, ...}
• Output: <word1, count1>, <word2, count2>, ...
3.2 Inverted Index
Inverted index[3, 9, 33] builds word-to-file indices for a document dataset. It is widely used in search engines. The input of inverted indexis a set of files, and the output is the mappings between words and files. Unlikeword count,inverted index distinguishes between one file and another.
• Input: {file1, file2, file3, file4, file5, ...}
• Output: <word1, <file1, file3>>, <word2, <file13>>, ...
3.3 Sequence Count
Sequence count[3, 18, 35] counts the number of appearances of everyl-word sequence in each file, wherelis an integer greater than 1. In this work, we usel=3 as an example.Sequence countis very useful in semantic, expression, and sequence analysis. Compared toword countandinverted index,sequence countneeds to not only distinguish between different files, but also discern the orders of consecutive words, which poses more complexities for processing (Section 4).
• Input: {file1, file2, file3, file4, file5, ...}
• Output: <word1_word2_word3, file1, count1>, ...
4 COMPRESSION-BASED DIRECT PROCESSING AND CHALLENGES
In this section, we present the concept ofcompression-based direct processing, including its basic algorithms and the challenges for materializing it effectively.
4.1 Compression-based Direct Processing
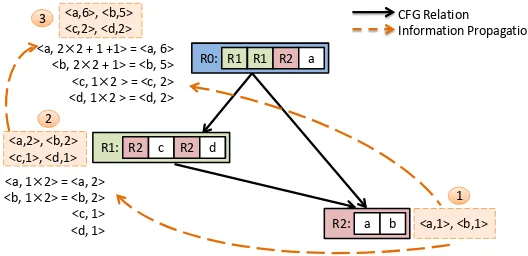
The results from Sequitur make this basic idea easy to materialize. Consider a task which is to count word frequencies in some input documents. We can do that directly on the DAG from Sequitur compression through a postorder (children before parents) traversal of the graph as shown in Figure 2. After the DAG is loaded into memory, the traversal starts. At each node, it counts the frequency of each word that the node directly contains and calculates the frequencies of other words it indirectly contains—that is, contained in its child nodes. For instance, when node R1 in Figure 2 is processed, direct appearances of “c” and “d” on its right-hand-side (rhs) are counted, while, the frequencies of words “a” and “b” are calculated by multiple their frequencies in R2 by two—the number of times R2 appears on itsrhs. When the traversal reaches the root R0, the algorithm produces the final answer.
<a, 2×2 + 1 +1> = <a, 6> <b, 2×2 + 1> = <b, 5> <c, 1×2 > = <c, 2> <d, 1×2 > = <d, 2>
<a,2>, <b,2> <c,1>, <d,1>
<a,1>, <b,1> 3
2
1 R0: R1 R1 R2 a
R1: R2 c R2 d
R2: a b <a, 1×2> = <a, 2>
<b, 1×2> = <b, 2> <c, 1> <d, 1> <a,6>, <b,5>
<c,2>, <d,2> CFG RelationInformation Propagation
Fig. 2. A DAG from Sequitur compression for “a b c a b d a b c a b d a b a”, and how a postorder traversal of the DAG counts frequencies of all words efficiently (details in Sec 4.1).
Note that because the processing leverages the compression results, it naturally avoids repeated processings of repeated contents. For instance, even though the substring “a b” appears five times in the original string, the processing only counts its word frequencies once. It is counted when the algorithm processes R2; the results are reused for the two appearances of R2 when R1 is processed; similarly, R1’s results (and also R2’s) are reused when R0 is processed.
The example illustrates the essence of the general algorithm of ourcompression-based direct processing: Let G be the graph representing Sequitur compression results.
Conduct a traversal of G, during which, at each node, do the following: Process local info;
Integrate the local info with results passed to this node during the traversal; Pass the integrated info to other nodes while continuing the traversal.
In this algorithm, document analytics is converted into a graph traversal process. Its core operations are (1)local processing, which processes the info directly contained in therhsof the rule, (2)data propagation, which passes computation results from one node (which corresponds to a segment of input) to another, and (3)data integration, which integrates the propagated data and local data together. Such a traversal process leverages the structure of the input documents captured by Sequitur, and embodies information reuse to avoid repeated processing of repeated content.
4.2 Complexities
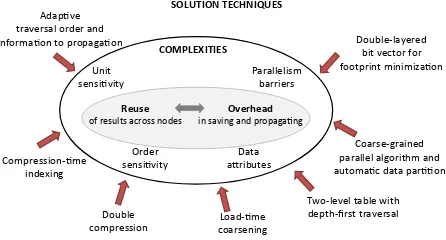
To effectively materialize the concept ofcompression-based direct processingon document analytics, there are a number of complexities. As Figure 3 shows, they center around the tension between cross-node reuses of results and the overhead in saving and propagating results. Reuse saves repeated processings of repeated content, but at the same time, requires the computation results to be saved in memory and propagated throughout the graph. The key for applyingcompression-based direct processingis to maximize the reuse while minimizing the overhead.
The problem is complicated by the complexities from the various analytics problems, the datasets, and the demands for scalable performance. We summarize the most common complexities as follows:
SOLUTION TECHNIQUES
Adap%ve traversal order and informa%on to propaga%on
Compression-%me indexing
Double
compression coarsening Load-%me
Two-level table with depth-first traversal
Coarse-grained parallel algorithm and automa%c data par%%on
Double-layered bit vector for footprint minimiza%on
COMPLEXITIES
Unit
sensi%vity Parallelism barriers
Order
sensi%vity aDributesData
Reuse
of results across nodes in saving and propaga%ngOverhead
Fig. 3. Overview of the complexities and solutions.
instance, bothinverted indexandsequence counttry to get some statistics in each file. The default Sequitur compression does not discern among files. How to support unit sensitivity without losing much reuse benefit is a question needed to be answered.
• Order sensitivity. The way results are propagated in the example ofword countin Figure 2 neglects the appearing order of words in the input documents. It is okey when the analytics tasks are oblivious to the order. But how to accommodate the order for applications (e.g.,sequence count) that are sensitive to the order? It is especially tricky when a sequence of words span across the boundaries of multiple nodes (e.g., the ending substring “a b a” in Figure 1 spans across nodes R2 and R0).
• Data attributes. The attributes of input datasets may sometimes substantially affect the overhead and benefits of a particular design of thecompression-based direct processingalgorithm. For instance, when solvinginverted index, one method is to propagate through the graph the list of files in which a word appears. It could work if there are a modest number of files, but would incur large propagation overhead when the number of files is large as the list to propagate could get very large. So datasets of different properties could demand a different design in what to propagate and the overall traversal algorithm.
• Parallelism barriers.For large input datasets, parallel or distributed processing is essential for a scalable performance. Thecompression-based direct processing, however, introduces some dependencies that could form barriers for parallel processing. In Figure 2, for instance, because the processings of nodes R1 and R0 need to reuse the results from R2, it is difficult for them to happen concurrently with the processing of R2. One strategy is to split the graph into multiple partitions and let each thread process one partition. This method would need to find good partitions to minimize the dependencies among partitions, and at the same time, to keep a good workload balance among threads and minimize required synchronizations and result merging cost.
5 GUIDELINES AND TECHNIQUES FOR EFFICIENCY
This section presents a list of guidelines, techniques, and software modules for easing programmers’ jobs in implementing efficientcompression-based direct processing. By following these guidelines and leveraging the techniques and software modules, one can avoid some pitfalls, and effectively address the aforementioned complexities in applications ofcompression-based direct processingto document analytic problems.
5.1 Solution Overview
The part outside the complexity circle in Figure 3 gives an overview of the solutions to the complexities. They are on seven aspects. Because of the close interplays of the various complexities, each of the solution techniques simultaneously relates with multiple complexities. They all contribute to the central goal: maximizing reuse while minimizing overhead.
coarse-grained parallel algorithm design and automatic data partition. The fourth addresses order sensitivity. The other three are some general optimizations to be applied at compression time and graph loading time, useful for both reducing the processing overhead and maximizing the compression rate. For these techniques, we have developed some software modules to assist programmers in applying those techniques.
In the rest of this section, we describe each of the techniques along with the corresponding software modules.
5.2 Adaptive Traversal Order
The first fold of important insights we learned through our explorations is that graph traversal order significantly affects the efficiency ofcompression-based direct processing. Its influence couples with the information that the algorithm propagates through the graph during the processing. The appropriate choice depends on the characteristics of both the problems and the datasets.
In this part of paper, we first draw onword countandinverted indexas two examples to explain this insight, and then present the derived guideline and a corresponding software module to assist developers. Through the way, we will also explain some basic operations needed to handle unit sensitivity of document analytics.
An Alternative Algorithm for Word Count
Figure 2 has already shown howword countcan be done through a postorder traversal of the CFG. It can yield a quite decent speedup by saving lots of computations (e.g., 1.4X on a 2.1GBWikipediadataset [1], which is dataset E in Section 7.1). However, we find that if we change the traversal to preorder (parents before children), the speedups could almost double.
Weight of R2: 5
Local table in R2: <a,1>, <b,1> Weight of R1: 2
Local table in R1: <c,1>, <d,1> Weight of R0: 1 Local table in R0: <a,1>
4 2
R2 calculates its weight, which is 5 (4+1). R0 propagates the frequency of R1 (which is 2) to R1,
and the frequency of R2 (which is 1) to R2.
R1 calculates its weight (which is 2), and propagates the frequency of R2 multiplied by R1’s weight to R2.
1
We integrate the local table in each node multiplied by its weight as the final result.
1
2
3 4
R0: R1 R1 R2 a
R1: R2 c R2 d
R2: a b
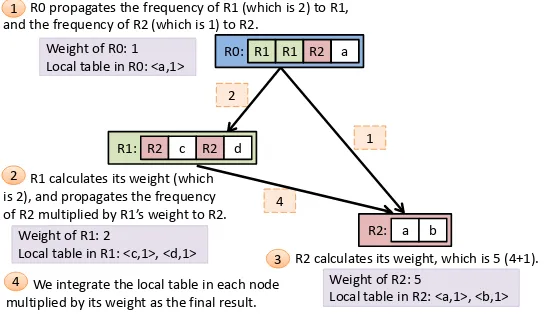
Fig. 4. Illustration of a preorder traversal algorithm forword counton the same string as Figure 2 deals with. The weights on an edge between two nodes (say,nodex tonodey) indicate the total appearances ofnodey’s rule incurred due to all appearances ofnodex’s rule.
Figure 4 illustrates this alternative design. It consists of two main steps. The first step calculates the total frequencies that each rule appears in the entire dataset ( 1 to 3 in Figure 4). This step is done through a preorder traversal of the graph: Parent nodes pass their total frequencies to their children, from which, the children nodes can calculate their total frequencies. Letf(r)be the computed frequency of ruler. With this step done, the second step ( 4 in Figure 4) just needs to enumerate all the rules once. No graph traversal is needed. When it processes ruler, it calculatesfr(w)=c(w)∗f(r), where,c(w)is the directly observable frequency of the wordwin the right-hand side of ruler(i.e., without considering the subrules ofr), and fl(w)is the total directly observable frequency ofwdue to all the occurrences of ruler. The algorithm addsfr(w)intof(w), the accumulated frequency ofw. So when the enumeration of all rules is done, the total count of every word is produced.
contain. This example illustrates the importance of traversal order and the information to propagate for the efficiency of compression-based direct processing.
Traversals for Inverted Index
The appropriate traversal order depends on both the analytic tasks and datasets. This part illustrates this point by describing two alternative traversal algorithms designed forinverted index.
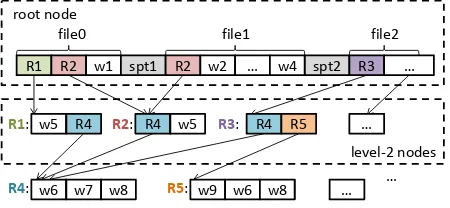
Recall that the goal ofinverted indexis to build up a mapping from each word to the list of files in which it appears. Before we discuss the different traversal orders, it is worth noting that the objective of this analytics task suggests that it needs to discern one file from another. Therefore, in the Sequitur compression results, file boundaries should be marked. To do that, we introduce a preprocessing step, which inserts some special markers at file boundaries in the original input dataset. As these markers are all distinctive and differ from the original data, in the Sequitur compressed data, they become part of the root rule, separating the different files, as the “spt1” and “spt2” in Figure 5 illustrate. (This usage of special markers offers a general way to handle unit sensitivity.)
R1 R2 w1 spt1 R2 w2 spt2 R3 root node
… w4 …
… level-2 nodes
file0 file1 file2
w5 R4
R1: R2: R4
w6 w7
R4: w8
R4 R5
R3:
w9 w6
R5: w8
…
… w5
w3
Fig. 5. Compression result with file separators (“spt1” and “spt2” are two file separators).
We next explain both preorder and postorder designs for this task. They are similar to the two algorithms forword count except for the information to propagate and to integrate.
Specifically, in the preorder design, its first step propagates the set of the IDs of the files that contain the string represented by the node, instead of the frequencies of rules. For instance, in Figure 5, thefileSetof ruleR2is {file0,file1}, and {file2} for rule R3; because the two rules both have ruleR4as one of their subrules, during the preorder graph traversal, thefileSetof ruleR4 is updated to the union of theirfileSets as {file0,file1,file2}. So, after the first step, every rule’sfileSetshall consist of the IDs of all the files containing the string represented by that rule. The second step goes through each rule and builds the inverted indices by outputting thefileSetof each word that appears on the right-hand side of that rule.
The postorder design recursively folds the set of words covered by a node into the word sets of their parent node. The folding follows a postorder traversal of the graph and stops at the immediate children of the root node (calledlevel-2 nodes.) The result is that every level-2 node has awordSetconsisting of all the words contained by the string represented by that node. From the root node, it is easy to label every level-2 node with afileSet—that is the set of files that contain the node (and hence each word in itswordSet). Going through all the level-2 nodes, the algorithm can then easily output the list of containing files for each word, and hence yield the inverted indices.
Unlike forword count, forinverted indexing, preorder is not always the winner. In fact, for a dataset with many small files, it runs much slower than the postorder version (e.g., 1.2X versus 1.9X onNSF Research Award Abstractsdataset [19], which is dataset D in Section 7.1). The reason is that the file sets it propagates could get very large.
Guideline and Software Module
The discussions lead to the following two guidelines for implementingcompression-based direct processing. Guideline I:Try to minimize the footprint size of the data propagated across the graph during the processing.
These guidelines serve as some principles for developers to follow during their implementations of the solutions for their specific analytics tasks. To further ease the burden in making the solutions adaptive to datasets, we develop a software module, orderSelector. It helps the developers build a decision tree for adaptive version selections.
Specifically, for a given analytics problem, the developer may create multiple versions of the solution (e.g., of different traversal orders). The developer can then specify these versions in the configuration file oforderSelectoras candidates, and specify a list of inputs, with each brings the Sequitur DAGs of an input dataset to the analytics problem. They may also specify some (currently Python) scripts for collecting certain features of a dataset that are potentially relevant to the selection of the versions. This step is optional asorderSelectorhas already predefined a set of data feature collection procedures, including, for instance, the total size of its CFG from Sequitur, and the number of files. These features are some meta data at the beginning of the Sequitur compressed data, taking virtually no time to read. With the configuration specified,orderSelectorinvokes all the versions on each of the datasets to collect their performance data (i.e., running time) and dataset features. It then invokes an off-the-shelf decision tree construction tool (scikit-learn [28]) on the data to construct a decision tree for the version selection. The decision tree will then be used in the production mode oforderSelectorto invoke the appropriate version for a given compressed dataset.
5.3 Coarse-Grained Parallelism and Data Partition
To get scalable performance, it is important forcompression-based direct processingto effectively leverage parallel and distributed computing resources. As Section 4 mentions, some dependencies are introduced among the processing steps in either preorder or postorder traversals of CFGs, which cause extra complexities of the parallel implementation.
We have explored two ways to treat the dependencies to parallelize the processing. The first is fine-grained partitioning, which distributes the nodes of the DAG to different threads, and inserts fine-grained communications and synchronizations among the threads to interchange necessary data and results. The second is a coarse-grained partitioning method. At the compression time, this method partitions the original input into a number of segments, then applies the compression and the analytics to each segment in parallel, and finally assembles the results together if necessary.
The coarse-grained method may miss some compression opportunities existing across the segments (e.g., one substring appears in two segments). However, its coarse-grained partitioning helps avoid frequent synchronizations among threads. Our experimental results show that on datasets of a non-trivial size, the coarse-grained method significantly outperforms the fine-grained method in performance and scalability. It is also easier to implement, for both parallel and distributed environments. For a parallel system, the segments are distributed to all cores evenly. For a distributed system, they are distributed to all nodes evenly, and then distributed to the cores within each node.
Load balance among threads or processes is essential for the overall parallel or distributed performance. For the coarse-grained method, it translates to the requirement for balanced partitioning of input datasets among threads or processes. The partition can be at file level, but sometimes also needs to happen inside a file such that a large file can be split into several sections, with each section assigned to a thread or process.
Guideline and Software Module
The discussions lead to the following guideline.
Guideline III:Coarse-grained parallel or distributed implementation should be preferred when the input dataset is large, and the partitions of workload should be kept balanced among threads and processes.
The partition step could be tedious. For applications that require additional file or word sequence information, the partitioning needs to record some extra information, such as which file a section belongs to, the sequence number of the section in the file, and so on. These information is necessary for a thread to know which section of which file it is processing, which is useful for later results merging.
5.4 Treatment to Order Sensitivity
As Section 4 mentions, tasks that are sensitive to the appearing order of words pose some special challenges to compression-based direct processing.Sequence count, for instance, requires the processing to consider the sequences which may span across multiple Sequitur rules (i.e., nodes in the DAG), and also the orders of words covered by different rules. The complexity calls for certain constraints on the visiting order of the rules in the Sequitur grammar, and also demands some data structures to facilitate the considerations of sequences across rules.
In our explorations, we found that the complexity can be addressed through a two-level table design with a depth-first graph traversal. The depth-first traversal of the graph ensures that the processing of the data observes the appearing order of words in the original dataset. During the traversal, it uses a global table to store the results that require cross-node examinations, and it uses a local table to record the results directly attainable from the right hand side of the rule in a node. Such a design allows the visibility of results across nodes, and at the same time, permits reuses of local results if a rule appears many times in the dataset.
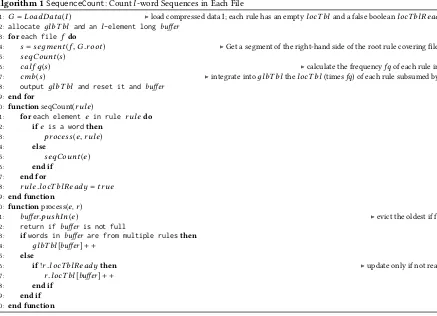
Forsequence count, for instance, the local table stores the counts of the sequences composed of the consecutive words appearing on the right hand side of a rule; that can help avoid repeatedly counting those sequences if that rule appears multiple times in the dataset. The global table stores the counts of the sequences spanning across rules. The final sequence counts are attained by merging the local and global counts together. Algorithm 1 shows the pseudo-code.
Algorithm 1SequenceCount: Countl-word Sequences in Each File
1: G=LoadData(I) ▷load compressed data I; each rule has an emptylocT bland a false booleanlocT bl Ready
2: allocate дlbT bl and an l-element longbuffer 3: foreach file f do
4: s=seдment(f,G.root) ▷Get a segment of the right-hand side of the root rule covering filef
5: seqCount(s)
6: cal f q(s) ▷calculate the frequencyfqof each rule ins
7: cmb(s) ▷integrate intoдlbT blthelocT bl(timesfq) of each rule subsumed bys
8: output дlbT bl and reset it and buffer 9: end for
10: functionseqCount(rule)
11: foreach elemente in ruleruledo
12: ife is a wordthen
13: process(e,rule)
14: else
15: seqCount(e)
16: end if
17: end for
18: rule.locT bl Ready=true
19: end function
20: functionprocess(e,r)
21: buffer.pushI n(e) ▷evict the oldest if full
22: return if buffer is not full
23: ifwords inbuffer are from multiple rulesthen
24: дlbT bl[buffer]+ +
25: else
26: if!r.locT bl Readythen ▷update only if not ready
27: r.locT bl[buffer]+ +
28: end if
29: end if
30: end function
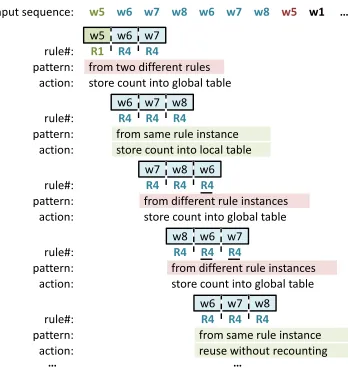
R4 R4 R4
from same rule instance
R4 R4 R4 R4 R4 R4
from different rule instancesR4 R4 R4 R4 R4
R1
from same rule instance reuse without recounting from different rule instances store count into global table store count into global table store count into local table from two different rules store count into global table
w6 w7
w5 w8 w6 w7 w8 w5 w1
w6 w7 w5 rule#: input sequence: pattern: action: w7 w8 w6 rule#: pattern: action: w8 w6 w7 rule#: pattern: action: w6 w7 w8 rule#: pattern: action: w7 w8 w6 rule#: pattern: action: … … …
Fig. 6. Illustration of how Algorithm 1 processes an input sequence (DAG in Figure 5) for counting 3-word long sequences.
in a local table. The next two sequences both correspond to two instances of R4, and are both cross-node sequences; they are counted in the global table. The bottom sequence in Figure 6 is the same as the second sequence, coming also from a single R4; the algorithm does not recount this sequence, but directly reuses the entry in the local table of R4.
Guideline
The discussions lead to the following guideline.
Guideline IV:For order-sensitive tasks, consider the use of depth-first traversal and a two-level table design; the former helps conform to the word appearing order, while the latter helps with results reuse.
The tables can be easily implemented through some existing template-based data structures in C++ and other languages. There is hence no specific software module created for the application of this guideline. However, it is worth noting that the coarsening module described next gives some important performance benefits to the applications of this guideline.
5.5 Other Implementation-Level Optimizations
This part introduces three extra optimizations. Although they are mostly implementation-level features, we find them quite useful for deploying compression-based direct processing efficiently.
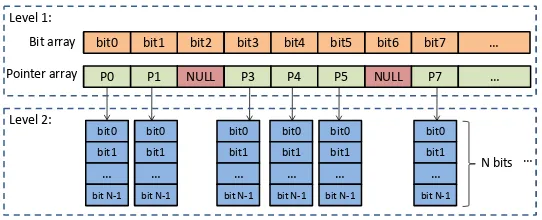
Double-layered bitmap. As Guideline I says, minimizing footprint in data propagation is essential. In our study, we find that when dealing with unit-sensitive analytics (e.g., file sensitivity ofinverted indexingandsequence count), a double-layered bitmap is often a helpful data structure for reducing the footprint.
Double-layered bitmap is a kind of data structure that has been used in many tasks. Our contribution is at recognizing its connections with compression-based direct processing.
Recall that in the preorder design ofinverted indexingin Section 5.2, we need to propagate file sets across nodes. One possible design of data structure is that each node uses asetstructure to store file IDs, but frequent querying and insertions to the set limit the performance of graph traversal. An alternative is that each node uses abit-vector, with each bit corresponding to a file: 1 for file presence, 0 otherwise. Although it can help replace the slow set operations with fast bit operations, it incurs large space overhead when there are many files, as every node needs such a vector, and the length of the vector needs to be the same as the total number of files.
determine which bit vector in level 2 contains the bit corresponding to the file in querying. If a rule is contained in only a subset of files, whose bits correspond to some bits in several level-2 vectors, then the level two of the bitmap associated with that rule would contain only those several vectors, and most elements in its pointer array would be null. The number of elements in the first level arrays and vectors of the double-layered map is only 1/Nof the number of files. In comparison, in the aforementioned one-level bit vector method, every rule would need to have a bit vector as long as the number of files in the total dataset. For a dataset containing 134,631 files (dataset D in Section 7.1), the double-layered bitmap saves 99.4% of the space a one-level bit vector would use.
NULL
P1 P3 P4 P5 NULL P7 … bit2
bit1 bit3 bit4 bit5 bit6 bit7 … Bit array
Pointer array P0 bit0
bit0 bit1 … bit N-1
… Level 1:
Level 2:
N bits bit0
bit1 … bit N-1 bit0
bit1 … bit N-1
bit0 bit1 … bit N-1
bit0 bit1 … bit N-1
bit0 bit1 … bit N-1
Fig. 7. A double-layered bitmap for footprint minimization and access efficiency.
Time-wise, the double-layered bitmap carries most of the efficiency benefits of the one-level bit vector compared to the use of sets. Even though it incurs one possible extra pointer access and one extra bit operation compared to the use of one-level bit vectors, its total memory footprint is much smaller, which contributes to better cache and TLB performance. Our experiments (reported in Section 7) show that, in general, the double-layered bitmap gets the best of both worlds, brings significant benefits in both space and time.
It is easy to see that the double-layered bitmap is a technique workable for general unit sensitivity rather than just file sensitivity. If the unit is a class of articles, for instance, one just needs to change the semantic of a bit to represent the class.
Double compression.Double compressionis an optimization we find helpful for the compression step. Compared to some other compression algorithms, Sequitur is based on words and does not always get the highest compression rates. A method we found effective to complement it is to first compress the original dataset with Sequitur and then run “gzip” (or other methods with high compression rates) on the output of Sequitur. The result is often even more compact than “gzip” results on the original dataset. When using the data, one only needs to decompress the “gzip” result to recover the Sequitur result. Because Sequitur result is usually much smaller than the original dataset, it takes much less time to recover than the original dataset does. The decompression of “gzip” result adds only marginal overhead as shown later.
Coarsening. The third optimization relates with data loading time. It is calledcoarsening, a transformation to the Sequitur DAG. Through it, the nodes or edges in the graph can represent the accumulated information of a set of nodes or edges. Specifically, we have explored two coarsening methods: edge merging and node coarsening.Edge mergingmerges the edges between two nodes in the DAG into one, and uses a weight of the edge to indicate the number of original edges. The merging loses the order of words, but helps reduce the size of the graph and hence the number of memory accesses in the graph traversal. It is helpful to analytics tasks that are insensitive to word order (e.g.,word countandinverted index).Node coarsening inlines the content of some small rules (which represent short strings) into their parent rules; those small nodes can then be removed from the graph. It reduces the size of the graph, and at the same time, reduces the number of substrings spanning across nodes, which is a benefit especially important for analytics on word sequences (e.g.,sequence count). Coarsening adds some extra operations, but the time overhead is negligible if it is performed during the loading process of the DAG. On the other hand, it can save memory usage and graph traversal time as reported in the next section.
The discussions lead to the following guidelines.
Guideline V:When dealing with analytics problems with unit sensitivity, consider the use of double-layered bitmap if unit information needs to be passed across the CFG.
To simplify developers’ job, we created a collection of double-layered bitmap implementation in several commonly used languages (Java, C++, C). Developers can reuse them by simply including the corresponding header files in their application. Guideline VI:When the dataset to process is of non-trivial size, try to employdouble compressionandcoarsening, which help with space and time efficiency.
We create two software modules to assist developers in applying this guideline. One module is a library function that takes an original dataset as input, and conducts Sequitur compression to it, during which, it applies dictionary encoding and double compressionautomatically. In our implementation, this module and the partition module mentioned in Section 5.3 are combined into one compression module such that the input dataset first gets integer indexed, then partitioned, and finally compressed. The combination ensures that a single indexing dictionary is produced for the entire dataset; the common dictionary for all partitions simplifies the results merging process.
The other module is a data loading module. When it is invoked with coarsening parameters (e.g., node or/and edge coarsening, the minimum length of a string a node can hold), it loads the input CFG with coarsening automatically applied.
5.6 Recap
The six guidelines described in this section capture the most important insights we have learned for unleashing the power of compression-based direct processing. They provide the solutions to all the major complexities listed in Section 4.2: Guideline V addresses unit sensitivity, Guideline VI order sensitivity, Guideline II data attributes complexity, Guideline III parallelism barriers, while Guidelines I and VI provide general insights and common techniques on maximizing the efficiency. The described software modules are developed to simplify the applications of the guidelines. They form part of theCompressDirect library described next.
6 COMPRESSDIRECTLIBRARY
We create a library namedCompressDirectfor two purposes. The first is to ease programmers’ job in applying the six guidelines when developingcompression-based direct processingfor an analytics problem. To that end, the first part of CompressDirectis the collection of the software modules described in the previous section. The second purpose is to provide a collection of highly performant implementations of some frequently performed document analytics tasks, which can directly help many existing applications.
Specifically, the second part ofCompressDirectconsists of six highly performant modules.Word count[3] counts the number of each word for input documents.Sort[14] sorts all the words of input documents in lexicographic order.Inverted index[3] generates a word-to-document index showing the list of files containing each word.Term vector[3] finds the most frequent words in a set of documents.Sequence count[3] calculates the frequencies of each three-word sequence in each file.Ranked inverted index[3] produces a list of word sequences in decreasing order of their occurrences in each document.
These modules are essential for many text analysis applications. For example,word countis important in lexical analysis; it is the basic step for computing text similarities, which are the key metric for document classifications and clustering. Similarly, the other modules are frequently used in various text analysis tasks.
For each of these modules, we implement three versions: sequential, parallel, and distributed versions. The first two versions are written in C/C++ (with Pthreads [27] for parallelization), and the third is in Scalar on Spark [34]. The implementation leverages the functions contained in the first part of the library. We next report the performance.
7 EVALUATION
The benefits ofcompression-based direct processingare significant in both space savings and time savings. Compared to the default direct data processing with no compression, the method speeds up the data processing by more than a factor of two in most cases, and at the same time, saves the storage and memory space by a factor of 6 to 13. Next, after explaining the methodology of the experiments, we report the overall time and space savings, and then describe the benefits from each of the major guidelines we have described earlier in the paper.
7.1 Methodology
Versions to CompareOur comparisons are on three versions. Version “baseline” processes the dataset directly, as explained at the beginning of this section. Version “CD” is our version usingcompression-based direct processing. The input to "CD" is the compressed data by our double compression (i.e., first by Sequitur then by Gzip). "CD" first recovers the Sequitur compression result by undoing the Gzip compression, and then processes the data on the Sequitur compression result directly. The measured "CD" time covers all the operations. Version “gzip” represents existing decompression-based methods. It uses Gzip to compress the data, and at the processing time, it recovers the original data by decompression and then runs the default data processing.
DatasetsWe use five datasets to evaluate the performance of our compression-based method as shown in Table 1. The first three datasets,A, B, C, are three large datasets from Wikipedia database [1], used for testing the performance of the techniques on clusters; the other two are relatively smaller, used for conducting detailed time breakdown studies for analyzing the performance. These datasets consist of a large range of real-world documents of varying lengths, structures and content. For instance,dataset Dis NSF Research Award Abstracts (NSFRAA) from UCI Machine Learning Repository [19], consisting of a large number (134,631) of small files. On the other hand,Dataset E, a collection of web documents downloaded from Wikipedia database [1], consists of four large files.
Table 1. Tested Datasets. The size is for the original datasets.
Dataset Size File# Rule# VocabularySize
dataset A 50GB 109 57,394,616 99,239,057
dataset B 150GB 309 160,891,324 102,552,660 dataset C 300GB 618 321,935,239 102,552,660 dataset D 580MB 134,631 2,771,880 1,864,902
dataset E 2.1GB 4 2,095,573 6,370,437
The sizes shown in Table 1 are the original dataset sizes; they become about half as large after dictionary encoding (i.e., encoding each word with a unique integer as mentioned in Section 2). As such a representation is helpful for all versions, it is used for all experiments, including those of the baseline version.
PlatformsThe configurations of experimental platforms are listed in Table 2. We useSpark Cluster, a 10-node cluster on Amazon EC2, and the three large datasets for the distributed experiments. The cluster is built with an HDFS storage system [5]. The Spark version is 2.0.0 while the Hadoop version is 2.7.0. We use a single node machine and the two smaller datasets for detailed time breakdown studies.
Table 2. Platform Configurations.
Platform Spark Cluster Single Node
OS Ubuntu 16.04.1 Ubuntu 14.04.2
GCC 5.4.0 4.8.2
Node# 10 1
CPU Intel E5-2676v3 Intel i7-4790
Cores/Machine 2 4
Frequency 2.40GHz 3.60GHz
7.2 Speedups
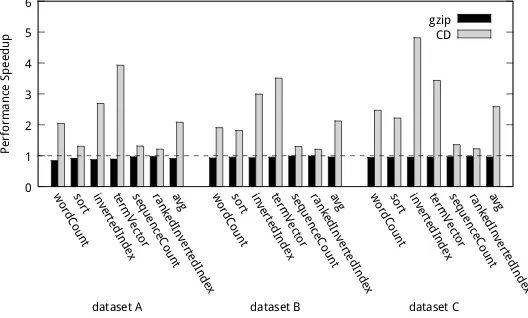
7.2.1 Speedups of Distributed Versions on Spark Clusters.Figure 8 reports the speedups that the different versions have achieved compared to the default version on the three large datasetsA, B, C. All versions are written in Spark and run on a 10-node cluster.
The size of a file in these datasets, in most cases, ranges from 200MB to 1GB. In the implementations of all versions, each file’s data form a processing unit (an RDD in Spark), resulting in coarse-grained parallelism. In both the baseline andCD versions, each machine in the cluster automatically grabs the to-be-processed RDDs one after one, processes them, and finally merges the results together. The two versions differ in whether an RDD is formed on the uncompressed or compressed data, and how an RDD is processed. Because the total size of the uncompressed datasetBandCexceed the aggregate memory of the cluster, the later loaded RDD reuses the memory of the RDD that has already been processed.
Word countandsortuse the preorder traversal,inverted indexandterm vectoruse the postorder traversal, and sequence countandranked inverted indextake the depth-first traversal and the two-level table design of Guideline IV in Section 5.4. Because the three datasets all consists of some large files, the data-sensitivity of order selection does not manifest on them. Section 7.4 will show the sensitivity on the other two datasets, D and E. All the programs use the coarse-grained parallelization. For the coarsening optimization,word count,sort,inverted index, andterm vectortake the edge merging, because they do not need to keep the order of words.Sequence countandranked inverted indexuse the node coarsening, because node coarsening can reduce the number of substrings spanning across nodes that increases the reuse of local data. We empirically set 100 as the threshold for node coarsening; the rule in each leaf node contains at least 100 items (subrules and words) after coarsening.
0 1 2 3 4 5 6
wordCountsort invertedIndextermVectorsequenceCountrankedInvertedIndexavg wordCountsort invertedIndextermVectorsequenceCountrankedInvertedIndexavg wordCountsort invertedIndextermVectorsequenceCountrankedInvertedIndexavg
Performance Speedup
gzip CD
dataset C dataset B
dataset A
Fig. 8. Performance on large datasets running on Spark clusters, normalized by the performance of the baseline version.
The average speedups fromCDare 2.08X, 2.12X, and 2.59X on the datasets. Programsinverted indexandterm vector show the largest speedups. These two programs are both unit sensitive, producing some analytics results for each file.CDis able to create an RDD partition (the main data structure used in Spark) for the compressed results of each file, but the default version cannot because some of the original files exceed the size limit of an RDD partition in Spark—the further partitioning of the files into segments and merging the results incur some large overhead. Programsword countandsortare not unit sensitive or order sensitive. Butsorthas some extra code irrelevant to theCDoptimizations, and hence shows a smaller overall speedup. Programssequence countandranked inverted indexare both about word sequences in each file; the amount of redundant computations to save is the smallest among all the programs.
Table 3. Time breakdown (seconds) and memory savings of thegzipversion and theCDversion of sequential executions.
Memory Saving (%) I/O Time Initialization Time Compute Time Total Time
Benchmark CD gzip CD gzip CD gzip CD gzip CD
dataset D
wordCount 89.83 4.01 2.60 14.10 4.51 0.38 0.31 18.49 7.42
sort 89.83 4.01 2.60 14.95 6.05 0.39 0.29 19.35 8.94
invertedIndex 86.06 4.01 2.60 13.42 4.00 11.09 6.20 28.52 12.80 termVector 86.06 4.01 2.60 13.29 7.36 4.08 3.28 21.38 13.24 sequenceCount 84.13 4.01 2.60 13.76 4.05 50.37 58.30 68.14 64.95 rankedInvertedIndex 84.13 4.01 2.60 13.85 4.39 138.73 141.45 156.60 148.44
dataset E
wordCount 90.75 13.48 3.01 20.13 7.03 0.38 0.22 33.99 10.26
sort 90.75 13.48 3.01 26.67 13.53 0.38 0.22 40.53 16.76
invertedIndex 84.29 13.48 3.01 20.93 10.01 0.84 0.24 35.24 13.26 termVector 84.29 13.48 3.01 20.34 9.71 1.90 1.01 35.71 13.73 sequenceCount 92.14 13.48 3.01 21.61 7.36 110.73 76.38 145.81 86.75 rankedInvertedIndex 92.14 13.48 3.01 21.90 7.27 138.81 87.60 174.19 97.88
7.2.2 Sequential Performance with Time Breakdowns.For a detailed analysis, we present the memory savings and time breakdowns in Table 3 by thegzipversion andCDversion. They are based on measurements on their sequential executions, which allow a clear separation of the times of each individual step. The two smaller datasets,DandE, are used as the large ones exceed the capacity of a single machine.
BecauseCDloads and processes much less data, it reduces memory usage by 87.9%. This benefit is valuable considering the large pressure modern analytics pose to the memory space of modern machines. The smaller memory footprint also helps reduce memory access time forCD.
The other columns in Table 3 show the time breakdowns ofgzipandCD. Figure 9 reports the overall speedups on the two datasets. The time breakdown shows thatCDtakes a much shorter I/O time thangzipdoes. It is becauseCDneeds to load only the compressed data into memory while thegzipversion needs to load the decompressed data.
0 0.5 1 1.5 2 2.5
wordCountsort invertedIndextermVectorsequenceCountrankedInvertedIndexavg wordCountsort invertedIndextermVectorsequenceCountrankedInvertedIndexavg
Performance Speedup
gzip CD
dataset E dataset D
However, it is worth noting that even if I/O time is not counted,CDstill outperforms thegzipversion substantially, reflected by its shorter times in all the other parts of the time breakdowns. For instance, its initialization step takes about 1/3 to 1/2 of that of thegzipversion. It is because its initialization includes recovering the Sequitur compressed results from the double compressed results, while the initial step of thegzipversion consists of the time to produce the completely decompressed data.
In most cases, the actual data processing part ofCD(the “compute time” column in Table 3) is also much shorter than that of thegzipversion, thanks to its avoidance of the repeated processings of content that appears multiple times in the input datasets. (The processing time in thegzipversion is the same as in the baseline version since they both process the decompressed data.) The only exceptions aresequence countandranked inverted indexon datasetD. These two programs are both unit and order sensitive, related with word sequences. DatasetD, which consists of many small files, does not have many repeated word sequences. However, even for these two extreme cases, the overall time ofCDis still shorter than that ofgzipbecause of its substantial savings in the I/O and initialization steps.
7.3 Space Savings
Table 4 reports the compression rates, which is defined assize(original)/size(compressed). In all the compressed versions, the datasets are already dictionary encoded, the compression methods apply to both the datasets and the dictionary. The CD- row shows the compression rates from Sequitur alone. They are 2.3–3.8, considerably smaller than the rates from Gzip. However, with the double compression technique applied, the rates ofCDget boosted to 6.5–14.1, even much greater than the Gzip rates. Gzip results cannot be used for direct data processing, but Sequitur results can, which makesCDable to bring significant time savings as well, as reported in the previous subsection.
Table 4. Compression rates.
Dataset
Version A B C D E avg
default 1.0 1.0 1.0 1.0 1.0 1.0
gzip 9.3 8.9 8.5 5.9 8.9 8.3
CD 14.1 13.3 13.1 6.5 11.9 11.8
CD- 3.1 3.2 3.8 2.3 2.8 3.0
CD-: Sequitur without double compression.
7.4 More Detailed Benefits
In this part, we briefly report the benefits from each of the major guidelines described in Section 5.
The benefits ofadaptive traversal orderare most prominent on benchmarksinverted indexandterm vector. With it, theCDversion selects postorder traversal when processing datasetDand preorder on datasetsA, B, C, E. We show the performance of both preorder and postorder forinverted indexandterm vectorin Figure 10. Using a simple decision tree on the number of unique words and the number of files (e.g., a question it asks is whether the ratio of the number of unique words over the number of files exceeds 100),CDsuccessfully selects the better traversal order for each of the datasets. For instance, oninverted index,CDpicks postorder on datasetD, which outperforms preorder by 1.6X, and it picks preorder on datasetE, which outperforms postorder by 1.3X.
Double compressionbrings some substantial space benefits as we have discussed in the previous subsection. As it needs to recover the Sequitur results from the compressed data before processing, it incurs some overhead. Our experiments show that the overhead is outweighed by the overall time benefits byCD.
We tried to implement a fine-grained parallel version ofCDfor benchmarkword count. It partitions the CFG into a number of partitions and uses multiple threads to process them in parallel. Despite that it took us several times of the efforts that we spent on thecoarse-grained parallelversion, the performance is substantially worse (e.g., 50% slower on datasetD).
0 1 2 3 4 5 6
dataset A dataset B dataset C dataset D dataset E dataset A dataset B dataset C dataset D dataset E
Performance Speedup
preorder postorder
term vector inverted index
Fig. 10. Performance of preorder and postorder forinverted indexandterm vector.
datasetE. The benefits of other guidelines (integer indexing, double-layered bitmap) have been reported in Section 5 and are hence omitted here.
7.5 Compression Time and Applicability
The time to compress the datasets through sequential Sequitur ranges from 10 minutes to over 20 hours. Using parallel or distributed Sequitur with accelerators can potentially shorten the time substantially. We emphasize that our technique is designed for datasets that are repeatedly used by many users. For them, the compression time is not a main concern as the compression results can be used for many times by different users for various analytic tasks again and again. These datasets are common, ranging from electronic book collections to historical Wikipedia pages [1], government documents archives, law firm archived collections, news archives, and so on. The technique is not intended to apply to data that change frequently or are used only several times (e.g., some streaming data).
Our discussion has focused on applications that normally require scanning the entire dataset. In general, the technique applies if the text analytics problem can be turned into a DAG traversal-based problem, as illustrated by the six analytics problems used in our evaluation. Another type of common tasks involve queries that require random accesses to some locations in the dataset. They are much simpler to support; adding some appropriate index to the Sequitur results could do the job. Such tasks can already be supported by other recent techniques (e.g., Succinct [2]), and are hence not included in the focus of this paper.
8 RELATED WORK
There is some work trying to enable query processing over encrypted data [31] to help avoid some security vulnerabilities. Unlike analytics over compressed data, these techniques do not detect or avoid processing repeated elements in documents. In storage systems, deduplication is a technique used for minimizing the storage of repeated contents [13, 21, 22]. As a technique working only at the storage level, it does not help document analytics to avoid repeatedly processing the content. For space savings,CompressDirectand deduplication work at two different computing layers, and are hence complementary to each other, applicable together. When multiple data sources need to be integrated (e.g., in data warehouses),data cleaningmay detect and remove some redundant data represented in different sources [30]. However, it does not compress data or support analytics on compressed data.
With the development of Sequitur by Nevill-Manning and others [24–26], it has been applied to various tasks. Lau and others [16] used Sequitur in code analysis to search some program patterns. Chilimbi [7] used Sequitur as a representation to quantify and exploit data reference locality for program optimization. Larus [15] proposed an approach called whole program paths (WPP) through leveraging Sequitur to capture and represent dynamic executed control flow. Law and others [17] proposed a whole program path-based dynamic impact analysis and related compression based on Sequitur. Chilimbi and others [8] used Sequitur for fast detection of hot data stream. Walkinshaw and others [32] applied Sequitur to the comprehension of program traces at varying levels of abstraction. Lin and others [20] extended Sequitur as a new XML compression scheme for supporting query processing. We are not aware of prior usage of Sequitur for supporting direct document analytics on compressed data.
9 CONCLUSION
This paper proposes a method,compression-based direct processing, to enable high performance document analytics on compressed data. By enabling efficient direct processing on compressed data, the method saves 90.8% storage space and 87.9% memory usage, while on average, speeding up the analytics by 1.6X on sequential systems, and 2.2X on distributed clusters. The paper presents how the concept can be materialized on Sequitur, a compression method that produces hierarchical grammar-like representations. It discusses the major complexities in applying the idea to various document analytics tasks, and provides a set of guidelines for developers to avoid potential pitfalls in applying the method. In addition, it produces a library namedCompressDirectto help further ease the required development efforts. Results demonstrate the promise of the proposed techniques in various computing environments, ranging from sequential to parallel and distributed systems.
REFERENCES
[1] 2017. Wikipedia HTML data dumps. https://dumps.wikimedia.org/enwiki/. (2017).
[2] Rachit Agarwal, Anurag Khandelwal, and Ion Stoica. 2015. Succinct: Enabling queries on compressed data. In12th USENIX Symposium on Networked Systems
Design and Implementation (NSDI 15). 337–350.
[3] Faraz Ahmad, Seyong Lee, Mithuna Thottethodi, and TN Vijaykumar. 2012. Puma: Purdue mapreduce benchmarks suite. (2012).
[4] Joshua E Blumenstock. 2008. Size matters: word count as a measure of quality on wikipedia. InProceedings of the 17th international conference on World Wide Web. ACM, 1095–1096.
[5] Dhruba Borthakur. 2008. HDFS architecture guide.HADOOP APACHE PROJECT http://hadoop. apache. org/common/docs/current/hdfs design. pdf(2008), 39.
[6] Michael Burrows and David J Wheeler. 1994. A block-sorting lossless data compression algorithm. (1994).
[7] Trishul M Chilimbi. 2001. Efficient representations and abstractions for quantifying and exploiting data reference locality. InACM SIGPLAN Notices, Vol. 36. ACM, 191–202.
[8] Trishul M Chilimbi and Martin Hirzel. 2002. Dynamic hot data stream prefetching for general-purpose programs. InACM SIGPLAN Notices, Vol. 37. ACM,
199–209.
[9] Doug Cutting and Jan Pedersen. 1989. Optimization for dynamic inverted index maintenance. InProceedings of the 13th annual international ACM SIGIR
conference on Research and development in information retrieval. ACM, 405–411.
[10] Paolo Ferragina, Rodrigo González, Gonzalo Navarro, and Rossano Venturini. 2009. Compressed text indexes: From theory to practice.Journal of Experimental Algorithmics (JEA)13 (2009), 12.
[11] Paolo Ferragina and Giovanni Manzini. 2005. Indexing compressed text.Journal of the ACM (JACM)52, 4 (2005), 552–581.
[12] Roberto Grossi, Ankur Gupta, and Jeffrey Scott Vitter. 2004. When indexing equals compression: Experiments with compressing suffix arrays and applications. InProceedings of the fifteenth annual ACM-SIAM symposium on Discrete algorithms. Society for Industrial and Applied Mathematics, 636–645.
[13] Fanglu Guo and Petros Efstathopoulos. 2011. Building a High-performance Deduplication System. InUSENIX annual technical conference.
[14] Shengsheng Huang, Jie Huang, Jinquan Dai, Tao Xie, and Bo Huang. 2011. The HiBench benchmark suite: Characterization of the MapReduce-based data analysis. InNew Frontiers in Information and Software as Services. Springer, 209–228.
[15] James R Larus. 1999. Whole program paths. InACM SIGPLAN Notices, Vol. 34. ACM, 259–269.
[16] Jeremy Lau, Erez Perelman, Greg Hamerly, Timothy Sherwood, and Brad Calder. 2005. Motivation for variable length intervals and hierarchical phase behavior. InIEEE International Symposium on Performance Analysis of Systems and Software, 2005. ISPASS 2005.IEEE, 135–146.
[17] James Law and Gregg Rothermel. 2003. Whole program path-based dynamic impact analysis. InSoftware Engineering, 2003. Proceedings. 25th International
Conference on. IEEE, 308–318.
[19] M. Lichman. 2013. UCI Machine Learning Repository. (2013). http://archive.ics.uci.edu/ml
[20] Yongjing Lin, Youtao Zhang, Quanzhong Li, and Jun Yang. 2005. Supporting efficient query processing on compressed XML files. InProceedings of the 2005 ACM symposium on Applied computing. ACM, 660–665.
[21] Alvaro E Monge, Charles Elkan, et al. 1996. The Field Matching Problem: Algorithms and Applications.. InKDD. 267–270.
[22] Gonzalo Navarro. 2001. A guided tour to approximate string matching.ACM computing surveys (CSUR)33, 1 (2001), 31–88.
[23] Gonzalo Navarro. 2016.Compact Data Structures: A Practical Approach. Cambridge University Press.
[24] Craig G Nevill-Manning and Ian H Witten. 1997. Compression and explanation using hierarchical grammars.Comput. J.40, 2 and 3 (1997), 103–116.
[25] Craig G. Nevill-Manning and Ian H. Witten. 1997. Identifying hierarchical structure in sequences: A linear-time algorithm.J. Artif. Intell. Res.(JAIR)7 (1997), 67–82.
[26] Craig G Nevill-Manning and Ian H Witten. 1997. Linear-time, incremental hierarchy inference for compression. InData Compression Conference, 1997.
DCC’97. Proceedings. IEEE, 3–11.
[27] Bradford Nichols, Dick Buttlar, and Jacqueline Farrell. 1996.Pthreads programming: A POSIX standard for better multiprocessing. " O’Reilly Media, Inc.". [28] Fabian Pedregosa, Gaël Varoquaux, Alexandre Gramfort, Vincent Michel, Bertrand Thirion, Olivier Grisel, Mathieu Blondel, Peter Prettenhofer, Ron Weiss,
Vincent Dubourg, et al. 2011. Scikit-learn: Machine learning in Python.Journal of machine learning research12, Oct (2011), 2825–2830.
[29] James W Pennebaker, Martha E Francis, and Roger J Booth. 2001. Linguistic inquiry and word count: LIWC 2001.Mahway: Lawrence Erlbaum Associates71
(2001), 2001.
[30] Vijayshankar Raman and Joseph M Hellerstein. 2001. Potter’s wheel: An interactive data cleaning system. InVLDB, Vol. 1. 381–390.
[31] Stephen Tu, M Frans Kaashoek, Samuel Madden, and Nickolai Zeldovich. 2013. Processing analytical queries over encrypted data. InProceedings of the
VLDB Endowment, Vol. 6. VLDB Endowment, 289–300.
[32] Neil Walkinshaw, Sheeva Afshan, and Phil McMinn. 2010. Using compression algorithms to support the comprehension of program traces. InProceedings of
the Eighth International Workshop on Dynamic Analysis. ACM, 8–13.
[33] Hao Yan, Shuai Ding, and Torsten Suel. 2009. Inverted index compression and query processing with optimized document ordering. InProceedings of the
18th international conference on World wide web. ACM, 401–410.
[34] Matei Zaharia, Mosharaf Chowdhury, Michael J Franklin, Scott Shenker, and Ion Stoica. 2010. Spark: cluster computing with working sets.HotCloud10
(2010), 10–10.
[35] Uri Zernik. 1991.Lexical acquisition: exploiting on-line resources to build a lexicon. Psychology Press.