Power Distribution Outage Cause Identification
With Imbalanced Data Using Artificial Immune
Recognition System (AIRS) Algorithm
Le Xu
, Student Member, IEEE
, Mo-Yuen Chow
, Senior Member, IEEE
, Jon Timmis
, Member, IEEE
, and
Leroy S. Taylor
, Member, IEEE
Abstract—Power distribution systems have been significantly af-fected by many fault causing events. Effective outage cause identifi-cation can help expedite the restoration procedure and improve the system reliability. However, the data imbalance issue in many real-world data often degrades the outage cause identification perfor-mance. In this paper, artificial immune recognition system (AIRS), an immune-inspired algorithm for supervised classification task is applied to the Duke Energy outage data for outage cause identi-fication using three major causes (tree, animal, and lightning) as prototypes. The performance of AIRS on these real-world imbal-anced data is compared with an artificial neural network (ANN). The results show that AIRS can greatly improve the performance by as much as 163% when the data are imbalanced and achieve comparable performance with ANN for relatively balanced data.
Index Terms—Artificial immune system, classification, data im-balance, outage cause identification, neural network, power distri-bution systems.
I. INTRODUCTION
P
OWER distribution reliability has a high impact on the electricity cost and customer satisfaction and therefore is an important topic in the electric power industry. Power distribu-tion systems have been significantly affected by a wide range of events (such as equipment failures, animal contacts, trees, light-ning strikes, etc.). In order to improve the reliability as well as the availability of power distribution systems, the management systems need to have proper and speedy responses to outages. For safety concerns, many utilities do not re-energize the system until they have found the root cause of the outage. The process may take from tens of minutes to hours: linemen may often need to walk along the power distribution lines (can be miles) to look for the evidences of the outage such as burn marks on the pole for possible lightning-caused outages and dead animal bodies for possible animal-caused outages. From time to time, the evi-dences cannot be found at the fault location. For instance, a bird takes away the body of the squirrel that has jumped into adis-Manuscript received July 20, 2006; revised September 20, 2006. This work was supported in part by the National Science Foundation under Grant ECS-0245383 and Grant No. IIS-0426852. Paper no. TPWRS-00458-2006.
L. Xu and M.-Y. Chow are with the Department of Electrical and Computer Engineering, North Carolina State University, Raleigh, NC 27695 USA (e-mail: [email protected]; [email protected]).
J. Timmis is with the Department of Computer Science and Department of Electronics, University of York, Heslington, York, U.K. (e-mail: jtimmis@cs. york.ac.uk).
L. S. Taylor is with Duke Energy, Distribution Standard, Charlotte, NC 28201 USA (e-mail: [email protected]).
Digital Object Identifier 10.1109/TPWRS.2006.889040
tribution transformer and shorted the phase to ground wire. The linemen occasionally may even need to ask the dispatch center for an appropriate crew to execute advanced tasks (e.g., a tree crew is requested to remove the fallen trees in order to restore the system).
Power outage cause identifications can provide useful infor-mation to narrow down the area that has to be searched to ex-pedite the restoration procedure and consequently improve the system reliability. For example, the linemen can be informed to focus on certain types of outage causes or the appropriate crew can be dispatched earlier to restore the system. As the name im-plies, power outage cause identification is to categorize a re-ported outage into one of the existing classes that are carefully arranged by domain experts; it can be considered as a classifi-cation problem.
With the development of data mining techniques, historical outage data have been utilized to extract outage patterns [1], [2]. However, data imbalance (i.e., where at least one of the classes significantly outnumbers some other classes) as one of the real-world data imperfections has been affecting the performance of pattern extraction and classification, since most commonly used classification methods aim to minimize the overall error rate. This data imbalance issue may cause some classification methods to achieve biased performance [3]: a high accuracy on the majority class but a very low accuracy on the minority class. Artificial immune systems (AIS) have been gaining signifi-cant attention in various application areas due to its powerful adaptive learning and memory capabilities. The artificial im-mune recognition systems (AIRS) algorithm proposed and well benchmarked by Watkins and Timmis [4]–[6] exhibits success as a classification algorithm. In this paper, AIRS is applied to Duke Energy power outage data to investigate its capability to perform outage cause identification, particularly with the imbal-anced real-world data.
Section II introduces Duke Energy outage data and how we preprocess the data; Section III briefly describes the AIRS algo-rithm as well as its related immune system concepts; Section IV presents the power distribution outage cause identification scheme using AIRS, and Section V shows its performance on outage cause identification and compares it with artificial neural network (ANN).
II. DUKEENERGYOUTAGEDATA ANDDATAPREPROCESSING
In Duke Energy distribution systems, every time a fault cur-rent is detected as a result of the activation of some protective
TABLE I
OVERVIEW OFELEMENTS OFEACHINFLUENTIALFACTOR
device like a circuit breaker or relay, the outage related infor-mation is recorded into a data collection system. Each outage record in this database contains 33 information fields. Based on Duke Energy senior distribution engineers’ suggestions as well as the statistical significance tests [7], six of the fields are considered as the most essential and influential factors:circuit ID, weather, season, time of day, phases affected, and protec-tive devices activated. These six influential factors are chosen to be independent variables, and the attributecauseentered by the crew after finding out the actual outage cause during the restora-tion process is selected as the dependent variable (i.e., the class label).
All six independent variables are categorical as shown in Table I; they are transformed into numerical variables using the likelihood measure [7] so that they can be used in most of the commonly used classification processes, including ANN and AIRS, which usually require numerical inputs.
The likelihood measure shown in (1) represents the condi-tional probability of an outage due to a specific cause given a certain condition (e.g., the likelihood of an observed outage caused by a tree given icy weather condition)
(1)
where indicates outage cause (e.g., tree, lightning), refers to outage-related event or condition (e.g., lightning weather, fuse activated, morning), is the number of outages caused by outage under condition is the number of outages under condition , and is the likelihood measure of outage given condition .
The likelihood measure can provide useful information for outage cause identification; it is logically used as the inputs to classifiers.
Duke Energy has 32 service areas in North Carolina and South Carolina; seven of them are selected as reasonable service area representations based on domain experts’ suggestions: Chapel Hill (CH), Clemson (CS), Durham (DH), Greenville (GV), Hickory (HC), Lancaster (LC), and Winston–Salem (WS). This selection takes different geographical features and system status into consideration: these seven regions cover metropolitan areas, cities, towns, rural areas, and wooded areas and also embody both old systems and new systems.
III. ARTIFICIALIMMUNERECOGNITIONSYSTEMS(AIRS) AIS are adaptive systems inspired by theoretical immunology and observed immune functions, principle, and models [8]. AIS utilize inspirations from immune systems and make use of ideas from immune systems to solve problems in different areas such as pattern recognition [9] and fault diagnosis [10]. AIRS is a natural immune system-inspired algorithm for supervised clas-sification task.
The immune systems consist of a complex set of cells and molecules that protect our bodies against infection by pathogens with complicated mechanisms. In this paper, only the AIRS-related aspects of immunology are introduced; a more detailed overview of the immune system can be found in [11].
A. Immune Systems
The immune systems, which contain lymphocyte cells known as B- and T-cells, guard our bodies against infections due to the attacks of antigens. B-cells have surface receptors that are able to recognize specific antigens through binding (complementary pattern matching); stronger binding generates higher affinity be-tween the receptor and antigen. The binding can activate the re-ceptor’s hosting B-cell. Activated B-cells then proliferate and differentiate into plasma cells or memory cells. Plasma cells secrete a large amount of antibodies through clonal expansion (which clones the antibodies in proportion to the affinity be-tween the antigen and the antibody) to neutralize the pathogens. Those clones undertake mutation to create diverse antibodies by altering the gene segments. The rate of the mutation is in-versely proportional to the affinity between the antigen and the antibody. These antibodies compete for the limited resources, and the ones that fit the antigen better survive. Memory cells remain in the system for a long period, allowing for a future re-sponse to the same or similar antigens to be improved in respect to both speed and accuracy.
B. AIRS Algorithm
AIRS is a B-cell mechanism-based algorithm. The input data are considered as antigens, usually represented as vectors. The potential solutions are expressed as B-cells; each B-cell includes an antibody that has the same vector format as antigens. A set of identical B-cells is represented as an artificial recognition ball (ARB) to reduce duplication [12].
In the initialization phase, the input data are first preprocessed to fit the defined affinity metric of the antigen-antibody binding. For example, if the Euclidean distance is used as the affinity metric, then the data are normalized to ensure the reactions be-tween any antigen-antibody pair stay in the range of [0, 1]. Be-sides, an initial set of ARBs and memory cells are randomly seeded from the training data.
Fig. 1. Schematic diagram of AIRS-based power distribution outage cause identification.
that changes one or more gene segments to create antibody variations; the mutation is implemented in the algorithm by randomly changing the values (in the allowed range) of some of the antibody vector elements. After this, each ARB from the updated is presented to the antigen in order to examine its affinity with the antigen; then a finite amount of resources, which is proportional to its affinity, is allocated to the ARB accordingly. When the total resources allocated across the ARB population exceeds the allowed limit, the weakest ARBs are removed until the totality of allocated resources is under the limit. The survived ARBs further produce offspring through clonal expansion and mutation until the average affinity value for all the existing ARBs with the antigen reaches the preset threshold or other stopping criteria for one-antigen training. Once the training process for current antigen is fulfilled, the best matching ARB with the same class as the antigen is nominated as the candidate memory cell ; it will be added to and become a long-lived memory cell if it matches the antigen better than .
The algorithm continues until all the training antigens have been presented. The final generated during the training phase is used as class prototypes for future classification in which the class of each presented test antigen is determined by this set of class prototypes through the k-nearest neighbor (k-NN) approach.
IV. POWERDISTRIBUTIONOUTAGECAUSEIDENTIFICATION
As discussed in Section II, the likelihood measures of six independent variables are used as the inputs to classifiers. However, the likelihood measure depends on both outage cause and influential condition as shown in (1); an outage record is mapped to different sets of likelihood measure values with respect to different outage causes, even under the same influential condition. As a result, the classifier can only process the identification of one outage cause type at a time. In this paper, three top customer interruption causes for most utilities are used as prototypes: lightning, animal, and tree. Fig. 1 shows the AIRS-based power distribution outage cause identification scheme that consists of three identical branches in parallel: lightning branch, animal branch, and tree branch. Each branch is responsible for identifying its own designated type of cause.
TABLE II
PROPORTIONS OFTREE-CAUSED, ANIMAL-CAUSED,ANDLIGHTNING-CAUSED
OUTAGES INDIFFERENCEREGIONS
The outage cause identification scheme can be extended to N branches for N outage types.
Within each branch, the likelihood calculation module first transforms incoming outage records to a set of likelihood mea-sures so that the input format is ready for the following classifi-cation methods. In this module, a corresponding likelihood mea-sure vector is generated for every outage record; this vector is regarded as the antigen and presented to the AIRS classifier. The AIRS classifier in the next step determines the class to which the incoming outage belongs by utilizing the memory cell set generated during the training phase.
The AIRS classifier in this outage identification scheme faces a binary classification task. Taking the tree branch as an ex-ample, the AIRS classifier categorizes incoming outage as either a tree-caused outage or a nontree-caused outage (which can be caused by animal contact, lightning strike, or others). As a re-sult, an AIRS classifier often faces an imbalanced data classifi-cation task since one particular outage may only account for a small percentage of the total number of outages due to the diver-sity of outage causes. Table II presents the proportions of three prototyping causes in each region (the region names appear as defined in Section II); this table clearly shows the data imbal-ance issue in power distribution outage data.
Lightning-caused outages have an average proportion of 9.97% in training data and 4.36% in test data. The region of DH has only 1.89% lightning-caused outages in its test dataset. Tree-caused outages, one of the largest outage classes, are rela-tively balanced between tree-caused outage and nontree-caused outage comparing with lightning-caused outages: tree-caused outages have an average proportion of 25.52% in training data and 28.88% in test data. Animal-caused outage is in between, with an average proportion of 15.25% in training data and 14.83% in test data.
The decision fusion module collects classification decisions from different branches. Conflicting decisions occur occasion-ally; the decision fusion module needs to mediate results from all the branches by comparing the affinities between the antigen and the winner memory cell in each branch in order to identify the outage cause of the incoming outage record. This module is not discussed in this paper, and only the decisions from each individual branch are presented in order to demonstrate the ca-pability of the AIRS algorithm on classifying imbalanced data.
V. RESULTS ANDDISCUSSIONS
TABLE III CONFUSIONMATRIX
into training data and test data by year: the outage records from 1994 to 1999 are used as the training set and the remaining data (2000 to 2002) form the test set. For example, the region of HC has a training data set with 10 030 outages and a test set with 5617 records.
The AIRS classifier uses the default parameter setting as in [2], except that the number k for the k-NN approach is set to 1. For an imbalanced dataset, majority class antigens may pro-duce more memory cells than minority class antigens during the AIRS training phase. One minority class cell may be surrounded by some majority class cells when representing the memory cells in a high-dimensional space, so taking votes from several memory cells close to an antigen may cause a biased decision.
Empirical studies show that many classification algorithms have sufficiently similar accuracies such that the differences among those algorithms are statistically insignificant [13]. The widely used ANN has been investigated in our previous works [2], [14]. The performance of AIRS is compared with a three-layer feed-forward neural network (six input nodes, 40 hidden nodes, and one output node, as in [14]). Due to the randomness property of both AIRS and ANN, each algorithm has been run 30 times in order to generate statistically representative results.
A. Performance Measure
The overall classification accuracy is the most straightfor-ward performance measure for a classification task, but it can be misleading in the case with imbalanced data. For example, assuming that there is a two-class imbalanced data set , the majority class contains 95% of the data and the minority class contains the remaining 5% of the data; a classifier can achieve an overall accuracy as high as 95%, even if it blindly (indiscriminately) categorizes every case to the majority class . This is certainly an undesirable approach from a classifi-cation viewpoint. Kubatet al.have proposed the g-mean [15] based on the confusion matrix to measure the classification per-formance on imbalanced data sets. Table III shows the con-fusion matrix where the tree-/animal-/lightning-caused outages are considered as positive classes and nontree-/nonanimal-/non-lightning-caused outages as negative classes.
True positive rate indicates the classification accu-racy of tree-/animal-/lightning-caused outages, and the true neg-ative rate presents the classification accuracy of non-tree-/nonanimal-/nonlightning-caused outages, as shown in (2) and (3), respectively. G-mean examines the classification accu-racies on both positive and negative classes; it punishes large disparities between them: the g-mean is high when both and are large and the difference between and is small. According to the definition of g-mean, whose basic idea is to maximize the accuracies on both classes, shown in (4), the classifier in the previous example of two-class imbalanced data
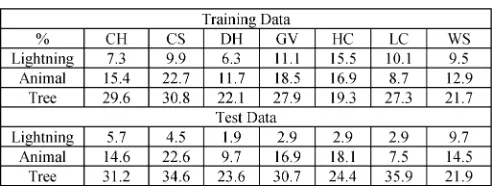
Fig. 2. G-means for lightning outage identification (test data).
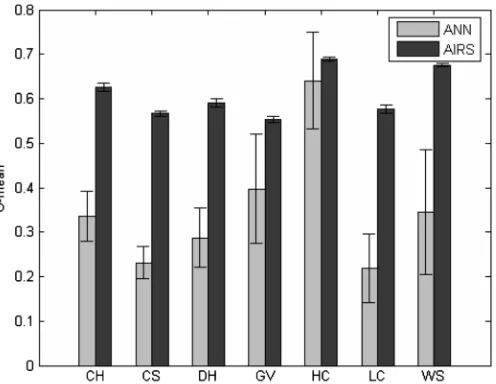
Fig. 3. G-means for animal outage identification (test data).
set only gets a g-mean value of 0, although it has 95% overall accuracy
(2)
(3)
- (4)
B. Results
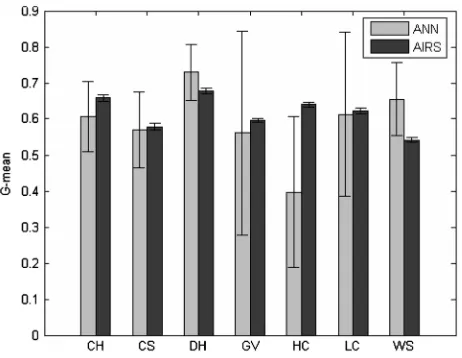
Fig. 4. G-means for tree outage identification (test data).
TABLE IV
P-VALUES OFTWO-SAMPLETESTS OFHYPOTHESIS ONG-MEANS
Two-sample tests of hypothesis are performed using the 30-run experimental data to compare the g-means of both approaches. In this paper, the null hypothesis
- - - (5)
is tested against the alternative hypothesis
- - - (6)
The P-values of the tests can help make the decision whether or not AIRS achieves higher performance than ANN: a P-value indicates the probability of obtaining the existing sample data given the null hypothesis [16], so a low P-value leads to the re-jection of the null hypothesis. The commonly used level of sig-nificance 0.05 is applied, i.e., a P-value under 0.05 will reject the null hypothesis in favor of the alternative hypothesis. Table IV presents the P-values of two-sample tests on g-means achieved by AIRS and ANN.
Fig. 2 clearly indicates that AIRS significantly increases the average g-mean values for lightning outage in most of the re-gions. The P-values of the two-sample tests of the hypothesis in Table IV also shows that the g-means achieved by AIRS are significantly higher than those by ANN in all the regions ex-cept HC, where the P-value 0.1792 is larger than the significance level 0.05.
Fig. 3 shows a similar pattern that AIRS achieves better per-formance in terms of average g-mean for animal-caused outages in all the regions but GV. The two-sample test results in Table IV
indicate that AIRS gets higher g-mean in five regions than ANN but lower g-mean in GV; the conclusion cannot be drawn for WS at the significance level of 0.05.
Comparing with lightning-caused outages and animal-caused outages, the sample mean of g-means over 30 runs for tree out-ages by AIRS, as shown in Fig. 4, is close to that by ANN in many regions and AIRS does not show obvious dominance for tree-caused outages as for lightning-caused outages. The two-sample tests on g-means indicate that AIRS has higher g-means in CH and HC and lower g-means in DH and WS; for the re-maining three regions, the conclusion that one is no better than the other cannot be made.
Table II shows that the two-class constitution for tree-caused outages are more balanced than animal-caused outages and that the two-class constitution for animal-caused outages are more balanced than lightning-caused outages: the region averaged odds (i.e., the ratio of probability of an event’s occurrence to the probability of the event not occurring) of a tree-caused outage in test data is about 1:2.5. The region averaged odds of a tree-caused outage in test data is about 1:5.7, while the region averaged odds of a lightning-caused outage in test data is as small as about 1:22. It is noticed that with the increase of percentage of the designated outage cause, the advantage of AIRS over ANN is weakened: the average proportion of light-ning-caused outages, animal-caused outages, and tree-caused outages is in an ascending order, while AIRS outperforms ANN in all the six regions for lightning-caused outages, five regions for animal-caused outages, and only two regions for tree-caused outages.
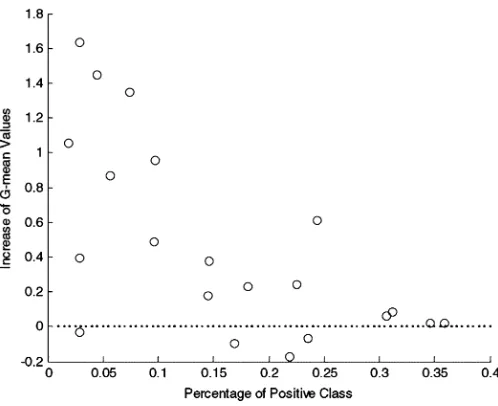
We further examine the individual case in Table II. It is observed that animal-caused outages do not necessarily ac-count for more percentage than lightning-caused outages; neither do tree-caused outages with animal-caused outages. For example, LC only has 7.46% animal-caused outages, while WS has 9.72% lightning-caused outages; WS only has 21.90% tree-caused outages, while CS has 22.56% animal-caused outages. Therefore, we disregard the categories of outage causes to further investigate the relationship between the in-crease of g-mean values and the percentage of positive classes (lightning-/animal-/tree-caused outages); the scatter plot of the increase of g-means versus the percentage of positive classes is shown in Fig. 5. It is shown in this figure that as the percentage of positive classes gets smaller (i.e., the data are more imbalanced); the increase of the g-mean values in general gets larger (can be as large as 163%). It means that when the data imbalance issue gets more severe, the advantage of AIRS over ANN is more significant; when the data constitution is relatively balanced, AIRS has comparable performance with ANN.
Fig. 5. Scatter plot of the increase of g-means versus the percentage of positive classes.
TABLE V
P-VALUES OFTWO-SAMPLETESTS OFHYPOTHESIS ONTRUEPOSITIVERATE
accuracy on the minority class. However, the AIRS algorithm generates matching antibodies for every incoming data and adds the best one into the memory cell set as long as it does not get too close to existing cells. This scheme helps prevent the biased performance as ANN does.
G-mean is calculated from and in (4); therefore, true positive rate and true negative rate are further compared to investigate the performance differences between two tech-niques. In this case, the null hypothesis and the alternative hy-pothesis for the two-sample test are shown in the following:
(7)
(8)
The P-values of two-sample tests in Table V indicate that AIRS has higher than ANN in five of seven regions (ex-cept GV and HC) for lightning-caused outages, in four regions (except GV, HC, and WS) for animal-caused outages, and in three regions (CH, CS, and HC) for tree-caused outages. The two-sample test results in Table VI show that ANN has higher than AIRS in most of the regions for all three outage causes (only except WS for lightning-caused outages and DH, GV, HC, and WS for animal-caused outages).
When the g-mean is broken down into true positive rate and true negative rate, it is found that AIRS in general increases the true positive rate at the price of decreasing the true nega-tive rate. It means that AIRS can improve the accuracy on the
TABLE VI
P-VALUES OFTWO-SAMPLETESTS OFHYPOTHESIS ONTRUENEGATIVERATE
TABLE VII
CAUSE-AVERAGEDDIFFERENCE OFOVERALLACCURACY AND
G-MEANBETWEENANNANDAIRS
minority class, but the classification accuracy on the majority class is sacrificed to some extent. Comparing with ANN, AIRS reduces the disparities of the classification accuracies between the majority class and the minority class. As a result, the g-mean value is increased, which indicates a more balanced classifi-cation. However, the decreased classification accuracy in the majority class that has a larger number of outages may have a stronger impact on the overall accuracy than the increased accu-racy of the minority class. Take the region of CH as an example: the test data in this region have 650 tree-caused outage and 1 435 nontree-caused outages. AIRS increases the sample mean of true positive rate from 0.4029 to 0.5506, which indicates 96 more tree-caused outages are correctly classified, but the de-crease of the sample mean of true negative rate from 0.9470 to 0.7865 causes 230 more nontree-caused outages are misclassi-fied. As a consequence, AIRS improves the performance bal-ance (g-mean) by 8.35% but decreases the overall classification accuracy by 7.88%. Table VII shows the outage-cause-averaged (to avoid the long list of all the regions) difference in g-mean values and overall classification accuracy. The comparison uses performance of ANN as a base; therefore, “+” indicates the improvement by AIRS, while “—” represents the decrease by AIRS. It is shown in the table that although the overall accu-racy is decreased, the g-mean values are increased much more, especially for the lightning-caused outages and animal-caused outages that involve severe imbalanced data constitution. This effect needs to be taken into consideration when choosing clas-sification approaches: whether an application prefers a balanced performance or a higher overall classification accuracy.
VI. CONCLUSION
major outage causes (tree, animal, and lightning) for most utili-ties are used as prototypes. The performance achieved by AIRS in terms of g-mean, the performance measure for imbalanced classification, is compared with that by ANN, which has been investigated in our previous works. The results show that AIRS can greatly improve the performance (as much as 163%) when the data are imbalanced and achieve comparable performance with ANN for relatively balanced data. Imbalanced data, as a very practical issue, have been challenging many power utili-ties; the successful application of the AIRS algorithm on imbal-anced historical outage data for cause identification presents a promising approach for real-world classification tasks.
REFERENCES
[1] J.-T. Peng, C. F. Chien, and T. L. B. Tseng, “Rough set theory for data mining for fault diagnosis on distribution feeder,”Proc. Inst. Elect. Eng., Gen., Transm., Distrib., vol. 151, no. 6, pp. 689–697, Nov. 2004. [2] L. Xu and M.-Y. Chow, “Power distribution systems fault cause iden-tification using logistic regression and artificial network,” inProc. 13th Conf. Intelligent Systems Applications Power Systems (ISAP), 2005, p. 6.
[3] G. Wu and E. Y. Chang, “KBA: Kernel boundary alignment consid-ering imbalanced data distribution,”IEEE Trans. Knowl. Data Eng., vol. 17, no. 6, pp. 786–795, Jun. 2005.
[4] A. Watkins,Artificial Immune Recognition System (AIRS) C++ Source Code,2002.
[5] A. Watkins, “AIRS: A resource limited artificial immune classifier” M.S. thesis, Dept. Comput. Sci., Mississippi State Univ., Mississippi State, MS, Nov. 2001 [Online]. Available: http://nt.library.msstate.edu/ etd/show.asp?etd=etd-11051001-102048.
[6] A. Watkins and J. Timmis, “Artificial immune recognition system (AIRS): Revisions and refinements,” inProc. 1st Int. Conf. Artificial Immune Systems (ICARIS), 2002, pp. 173–181.
[7] L. Xu, M.-Y. Chow, and L. S. Taylor, “Analysis of tree-caused faults in power distribution systems,” inProc. North American Power Symp., 2003, pp. 122–127.
[8] T. Knight and J. Timmis, “A multi-layered immune inspired approach to data mining,” inProc. Int. Conf. Recent Advances Soft Computing, 2002, pp. 266–271.
[9] J.-Z. Liu and B. Wang, “AIS hypermutation algorithm based pattern recognition and its application in ultrasonic defects detection,” inProc. Int. Conf. Control Automation, 2005, pp. 1268–1272.
[10] X. Z. Gao, S. J. Ovaska, X. Wang, and M.-Y. Chow, “Neural net-works-based negative selection algorithm with applications in fault di-agnosis,” inProc. IEEE Int. Conf. Systems, Man, Cybernetics, 2004, pp. 3408–3414.
[11] L. N. de Castro and J. Timmis, Artificial Immune Systems: A New Com-putational Approach. London, U.K.: Springer-Verlag, 2002. [12] A. Watkins, J. Timmis, and L. Boggess, “Artificial immune recognition
system (AIRS): An immune inspired supervised machine learning al-gorithm,”Genet. Program. Evolv. Mach., vol. 5, no. 1, Mar. 2004. [13] J. Han and M. Kamber, Data Mining: Concepts and Techniques. San
Francisco, CA: Morgan Kaufmann, 2001.
[14] L. Xu and M.-Y. Chow, “A classification approach for power distribu-tion systems fault cause identificadistribu-tion,”IEEE Trans. Power Syst., vol. 21, no. 1, pp. 53–60, Feb. 2006.
[15] M. Kubat, R. Holte, and S. Matwin, “Machine learning for the detection of oil spills in radar images,”Mach. Learn., vol. 30, pp. 195–215, 1998. [16] R. E. Walpole, R. H. Myers, S. L. Myers, and K. Ye, Probability and Statistics for Engineers and Scientists, 7th ed. Englewood Cliffs, NJ: Prentice-Hall, 2002.
Le Xu(S’01) received the B.Eng. degree in automa-tion from Tsinghua University, Beijing, China, in 2001 and the M.S. degree in electrical engineering from North Carolina State University, Raleigh, in 2003. He is currently pursuing the Ph.D. degree in advanced diagnosis automation and control (ADAC) Laboratory at North Carolina State University.
His research interests include intelligent health monitoring of power distribution systems.
Mo-Yuen Chow(S’81–M’82–SM’93) received the B.S. degree in electrical and computer engineering from the University of Wisconsin, Madison, in 1982 and the M.Eng. and Ph.D. degrees from Cornell Uni-versity, Ithaca, NY, in 1983 and 1987, respectively.
Upon completion of the Ph.D. degree, he joined the Department of Electrical and Computer Engi-neering, North Carolina State University, Raleigh, and has held the rank of Professor since 1999. His core technology is diagnosis and control, artificial neural network, and fuzzy logic with applications to areas including motors, process control, power systems, and communication systems. He has established the Advanced Diagnosis Automation and Control (ADAC) Laboratory at North Carolina State University.
Jon Timmis(M’02) is an Anniversary Reader in the Computer Science Department and Electronics De-partment, University of York, York, U.K. His main re-search interest is in the computational abilities of the immune, neural, and endocrine systems and how they relate to computer science and engineering. He is the coauthor of the first textbook on artificial immune systems and has recently coedited a book entitledIn Silico Immunology, which brings together ideas from theoretical immunology, experimental immunology, immuno-informatics, and artificial immune systems. He has worked on real-time error detection in automated teller machines (work sponsored by NCR, the world’s largest ATM manufacturer), immune inspired learning systems, theoretical aspects of artificial immune systems, computa-tional modelling of immune systems, robotics, software testing, bioinformatics, and a conceptual meta-framework for bio-inspired computation. He is principal investigator (PI) of ARTIST, a UK based network of excellence on artificial im-mune systems, PI on an EPSRC project (together with Prof. Tyrrell), which is attempting to capture homeostatic properties of biological systems in electronic systems, and he is co-investigator on an EPSRC project exploring the use of immunological modelling techniques for the development of novel immune in-spired algorithms for bioinformatics.
Dr. Timmis founded (together with Dr. P. Bentley) the International Con-ference on Artificial Immune Systems (ICARIS) and is now the chair of the ICARIS steering committee. He is on the steering committee of the Grand Chal-lenge in Non-Classical Computation in the U.K. and is a member of the editorial board of Evolutionary Computation.
Leroy S. Taylor(M’93) was born in 1949 in Greenville, NC. He received the B.A. degree in Physics from the University of North Carolina in 1971.
He is a Senior Distribution Engineer for Duke Energy, Charlotte. Joining Duke Power in 1977, he acquired extensive experience in distribution system engineering, operation, and construction. Since 1987, he has conducted inten-sive investigation on the cause of power quality disturbances that originate in the distribution system. He has also redesigned several Duke Power mainframe reporting systems used to evaluate and improve distribution system reliability and power quality.