ISSN(Online): 2319-8753
ISSN (Print): 2347-6710
I
nternational
J
ournal of
I
nnovative
R
esearch in
S
cience,
E
ngineering and
T
echnology
(An ISO 3297: 2007 Certified Organization)
Vol. 5, Issue 8, August 2016
Seismic Evaluation of Retrofitted RC Frame
Building Using Shear Wall and Steel Braces
Ajeet N. Nikam1, Prof.Mayur.M.More2, Prof. Satish S. Kotwal3, Prof. Manoj M More4
Assistance Executive Engineer, Central Public Work Department, Mumbai, Maharashtra, India1
Assistance Professor, Department of Civil Engineering, Bharati Vidyapeeth’s College of Engineering, Kolhapur,
Maharashtra,India 2
Assistance Professor, Department of Civil Engineering, Bharati Vidyapeeth’s College of Engineering, Kolhapur,
Maharashtra, India 3
Assistance Professor, Department of Civil Engineering, KIT’s College of Engineering, Kolhapur, Maharashtra, India 4
ABSTRACT:Many existing buildings lack the seismic strength and detailing requirements of IS1893:2002 and IS 13920:1993, because they are designed for only gravity loads or built prior to the implementation of these codes. In present, study two buildings 8 and 12 storied are considered. Which are designed for only gravity loads according to IS 456:2000 without ductile detailing as well as same buildings are designed as per seismic loading according to IS 1893:2002 and ductile detailing. Seismic evaluation of these buildings is carried out with nonlinear static pushover analysis using SAP 2000 software. Moreover, the performance points and performance levels of existing and retrofitting cases are determined by capacity spectrum methods from SAP 2000. Gravity designed buildings are found in LS-CP range for DBE condition whereas buildings designed for seismic loading according to IS 1893:2002 and ductile detailing are at operational (B) to immediate occupancy (IO) level. Then various retrofitting schemes viz. Steel X braces, inverted V braces, shear wall are employed only for gravity designed buildings. For retrofit of the buildings, requirement of immediate occupancy (IO) under design basis earthquake (DBE) is aimed at. The evaluation of structural over strength, the global ductility, behavior factor of retrofitted buildings is extracted from pushover curve. Idealized force-displacement capacity curve is evaluated based on the method recommended by FEMA-356 provisions. The results are compared based on performance point, yield strength, lateral stiffness, and overstrength and ductility parameters. The results show that there is no unique solution and several different schemes can be provided to give adequate performance. Most increase in the lateral strength and stiffness is related to using steel X braces and shear wall respectively.
KEYWORDS:seismic evaluation, performance levels, pushover, steel X bracing, shear wall.
I. INTRODUCTION
ISSN(Online): 2319-8753
ISSN (Print): 2347-6710
I
nternational
J
ournal of
I
nnovative
R
esearch in
S
cience,
E
ngineering and
T
echnology
(An ISO 3297: 2007 Certified Organization)
Vol. 5, Issue 8, August 2016
The present study includes the seismic evaluation of reinforced concrete buildings which are 8 and 12 storied, and are first designed for gravity loading according to IS 456:2000 without ductile detailing. Same buildings are designed with seismic loading according to IS 1893:2002 and ductile detailing has been done in accordance with IS 13920:1993. The analysis and design is carried in SAP 2000 software. Designed buildings are evaluated using nonlinear static pushover analysis in Y direction only. For pushover analysis FEMA 356 and ATC-40 guidelines are followed. Performance point is found by using capacity spectrum method from the SAP2000 software.Since above all buildings failed to give desired target performance level that is operational (B) to immediate occupancy (IO) and they lies in life safety (LS) to collapse prevention level (CP), hence buildings need to be retrofitted. Steel X, inverted V braces and shear wall are employed as the retrofitting strategies. Shear wallsare placed in exterior bay as well as interior bay and Steel X, inverted V braces are placed exterior bay only. Modeling of shear wall is confined to wide column analogy. All these retrofitting schemes are applied to both the 8 and 12 storied building. Then from push over curve idealized curve is drawn as per FEMA 356 recommendations. The various seismic parameters are extracted from pushover curves for various retrofit schemes. The results of analysis are compared in terms of seismic parameters such as performance levels, hinge formation pattern, yield strength and lateral stiffness and effectiveness of retrofitting schemes on above parameters is studied.
II. DESCRIPTIONOFBUILDINGS
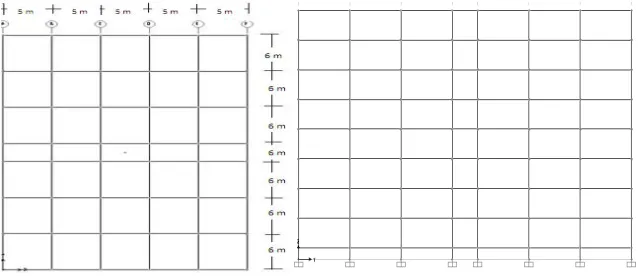
The structures representing medium and high rise reinforced concrete framed buildings are considered in this study.Floor to floor height is 3.1 m and Plinth level is 1.2 m above base of footing. The Site is located in Seismic Zone IV.Buildings are resting on Type II (medium soil).Slab thickness is 150 mm. Outer and inner wall thicknesses are 230 mm and 150 mm respectively. Grade of concrete and steel are M20 and Fe 415 respectively.The Imposed load on floor
is 3kN/m2 and imposed load on roof is 1.5 kN/m2.Floor finishes is 1 kN/m2 and roof treatment load is 1.5 kN/m2. All
buildings have similar plan dimension 25m X 39m as shown in figure 1.
Figure 1 Plan and elevation of building
Buildings are first designed for gravity loads only as per IS 456:2002 andload combination considered is 1.5(DL+LL). For seismic design load combinations are taken from IS 1893: 2002 part1 and ductile detailing is done by guidelines laid by IS:13920. Following load combinations are used for seismic design.
a. 1.5 (DL + LL)
b. 1.2 (DL+LL ±EQX)
c. 1.2 (DL+LL ± EQY)
d. 1.5 (DL ± EQX)
e. 1.5 (DL ± EQY)
f. 0.9 DL ±1.5 EQX
g. 0.9 DL ± 1.5 EQY
ISSN(Online): 2319-8753
ISSN (Print): 2347-6710
I
nternational
J
ournal of
I
nnovative
R
esearch in
S
cience,
E
ngineering and
T
echnology
(An ISO 3297: 2007 Certified Organization)
Vol. 5, Issue 8, August 2016
Table 1. Cross section of members as per gravity load design and seismic design
Type of building No. of Storey
Member Sectional
dimensions in mm
Description
Building designed for Gravity
8
Beams 300 x 300 Plinth beams
300 x 400 All other beams
Columns
450 x 450 Top four floors all columns
500 x 500 Exterior bay columns bottom 4 floor
600 x 600 Interior bay columns bottom 4 floor
Building designed for Earthquake loading
8
Beams 300 x 450 Plinth beams and beam spanning 3 m
300 x 600 All other beams
Columns 450 x 450 Top four floors all columns
650 x 650 All other columns
Building designed for Gravity
12
Beams 300 x 300 Plinth beams
300 x 400 All other beams
Columns
600 x 600 Interior bay columns bottom 4 floor
500 x 500 All exterior bay columns and top 4
floor columns2 Building designed for
Earthquake loading
12
Beams 300 x 450 Plinth beams and beam spanning 3 m
300 x 600 All other beams
Columns 700 x 700 All bottom 4 storied columns
600 x 600 All other columns
III.MODELING OF BUILDINGS
The buildings are modeled in SAP 2000 software, line elements having 6 DOF per node is used for modeling beams and columns. The infill walls and the slabsare notmodeled. The weight due to infill walls is uniformly distributed overbeam. And the weight of the slab is considered enacting on adjacent beams as per yield line patter. The bottom of each column is assumed to be fixed so there is no soil structure interaction. The stiffness of columns and beams areshown in table no 2.
Table 2 Effective stiffness value [2]
Component Flexure Rigidity Shear rigidity Axial rigidity
Beams 0.5EcIg 0.4EcAw -
Columns with compression due design gravity loads<=0.3Agf’c
0.5EcIg 0.4EcAw EsAs
Columns with compression due design gravity loads >=0.5Agf’c
0.7 EcIg 0.4EcAw EcAg
IV.PUSHOVERANALYSISOFBUILDINGS
ISSN(Online): 2319-8753
ISSN (Print): 2347-6710
I
nternational
J
ournal of
I
nnovative
R
esearch in
S
cience,
E
ngineering and
T
echnology
(An ISO 3297: 2007 Certified Organization)
Vol. 5, Issue 8, August 2016
To incorporate nonlinear behavior of buildings nonlinear hinges are assigned at faces of column and beams. Beams are assigned with moment hinges (M3), and columns are assigned with axial load and biaxial moment (PMM) hinges. Auto hinges are provided from SAP2000.
To decide an optimum retrofitting scheme it is required to find out current performance level of the structure. Hence capacity curves also known as pushover curves are good measure to evaluate performance level of the structure. Figure2 and figure 3 shows capacity curves for 8 and 12 storied gravity designed buildings. To model design spectrum coefficient of acceleration (Ca) and coefficient of velocity (Cv) are required. Seismic zone is IV and zone factor (Z) is 0.24. The demand spectrum for design basics earthquake is obtained from peak ground acceleration (PGA) of (Z/2 x g = 0.12g). The soil is considered as medium soil and Cv =1.36 x Z/2 for medium soil as per IS: 1893-2002. Therefore, the demand spectra is plotted with Ca = 0.12g and Cv =1.36 x 0.12g = 0.1632g for 5% damping.
Figure.2Capacity curves of 8 storied building in Y direction. Figure 3 Capacity curves of 12 storied building in Y direction.
Also figure 4 shows hinge formation pattern at performance point. From figure 4 and table no 3 it is clear that building designed as per IS456:2000 are seismically deficient and life safety (LS) to collapse prevention level (CP) hinges are formed in beams at middle storey level. But buildings designed as per seismic codes are atoperational (B) to immediate occupancy (IO) performance level so they do not need retrofitting.
(a) (b) (c) (d)
Figure1 Hinge formation at performance point (a) 8 storied gravity designed (b) 8 storied ERD (c) 12 Storied gravity designed (d) 12 storied ERD
ISSN(Online): 2319-8753
ISSN (Print): 2347-6710
I
nternational
J
ournal of
I
nnovative
R
esearch in
S
cience,
E
ngineering and
T
echnology
(An ISO 3297: 2007 Certified Organization)
Vol. 5, Issue 8, August 2016
Table 3 Performance point & performance level of 8 & 12 building
Building Type Performance point in Y direction (V kN: D mm)
Seismic level range for DBE
8 storied gravity designed building ( 3643.64, 209) LS-CP
8 storied ERD building (7060, 108) B-IO
8 storied gravity designed building ( 3335.453, 290) LS-CP
8 storied ERD building (7201.898, 159) B-IO
V. RETROFITTINGOFRCBUIDINGUSINGSHEARWALLANDSTEELBRACES
To study the effect of different retrofitting scheme 8 and 12 storied buildings are retrofitted by using following schemes. For seismic analysis only Y direction is considered. After retrofitting of buildings target performance level was operational (B) to immediate occupancy (IO).
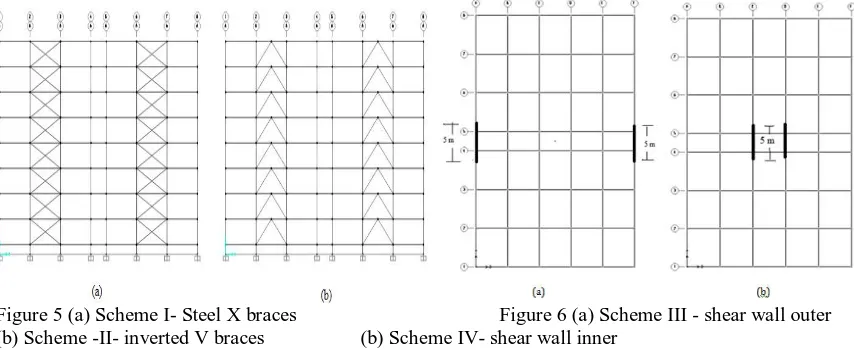
Retrofit scheme-I: Steel concentric X braces are added to 8 and 12 storied gravity designed building as shown in figure 5 (a)
Retrofit scheme-II: Steel concentric inverted V braces are added to 8 and 12 storied gravity designed building as shown in figure 5 (b)
Retrofit scheme-III: Concrete shear wall extending full height of building is added to exterior bay of 8 and 12 storied gravity designed building as shown in figure 6 (a)
Retrofit scheme-IV: Same concrete shear wall extending full height of building is added to interior bay of 8 and 12 storied gravity designed building as shown in figure 6 (b)
Figure 5 (a) Scheme I- Steel X braces Figure 6 (a) Scheme III - shear wall outer
(b) Scheme -II- inverted V braces (b) Scheme IV- shear wall inner
VI.MODELINGANDDESIGNOFSTEELBRACESANDSHEARWALL
In present study all the retrofitting schemes are designed to resist the base shear for DBE level earthquake according to IS 1893 part 1 as a first trial, and then trial and error method is adopted to bring the structural performance level within IO range.Braces are modeled as truss element having pin joints at both the ends. Brace membersare selected as round
hollow section both for concentric X and inverted V braces with modulus of elasticity E= 200,000 MPa and fy = 350
ISSN(Online): 2319-8753
ISSN (Print): 2347-6710
I
nternational
J
ournal of
I
nnovative
R
esearch in
S
cience,
E
ngineering and
T
echnology
(An ISO 3297: 2007 Certified Organization)
Vol. 5, Issue 8, August 2016
Table 4 Sectional properties of concentric X braces for 8 storied building.
Storey Sections(diameter in mm, thickness in mm)
1 130,10
2,3 130,5
4,5 125,5
6 100,5
7,8 90,5
Table 5 Sectional properties of concentric inverted V braces for 8 storied building
Storey Sections(diameter in mm, thickness in mm)
1 130,8
2,3 145,8
4,5 140,8
6 130,8
7 110,6
8 100,5
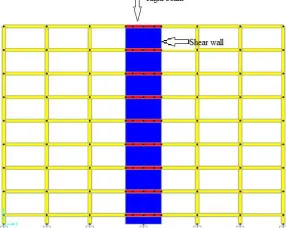
Since all shear walls in the building are slender with wall height-to-length ratio well above 3 and therefore seismic response of the shear walls is expected to be dominated by flexure. The shear walls are modeled as equivalent frame elements.
Modeling is carried out as per assumption in the wide column frame analogy. Shear wall is represented by line element (center line of shear wall) and rigid beam as line element (center line of beam). In order to provide connectivity between walls and frames, the rigid beams are connected at each floor level. Rigid beam is defined with rigid material and shear wall with concrete. The modulus of elasticity of rigid beam is taken 1000 times more than concrete. The modeling of shear wall is shown in figure 7.
Figure 7 Modeling of shear wall by equivalent frame method
In order to model nonlinear behavior in structure, nonlinear hinges are assigned to shear wall and steel braces. User defined hinges are assigned to shear wall. Properties of hinges are taken from FEMA 356. Typically PMM-interaction hinges are assigned to shear wall ends, near floor levels, and shear hinges are assigned at mid height level of shear wall. In case of steel braces axial hinges are assigned at the ends.
VII. DISCUSSIONANDSUMMARYOFRESULTS
ISSN(Online): 2319-8753
ISSN (Print): 2347-6710
I
nternational
J
ournal of
I
nnovative
R
esearch in
S
cience,
E
ngineering and
T
echnology
(An ISO 3297: 2007 Certified Organization)
Vol. 5, Issue 8, August 2016
to same building when it is retrofitted. After retrofitting not only base shear carrying capacity of building is increasedbut also displacement at performance point is also reduces.
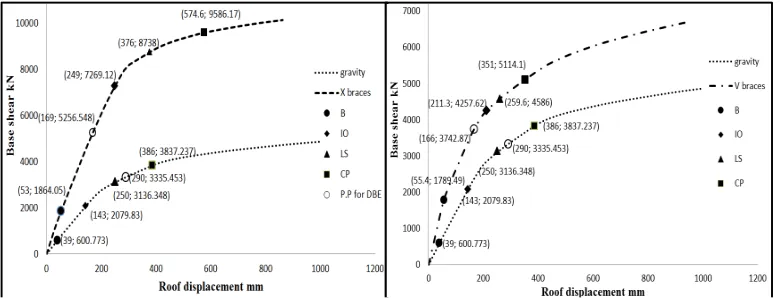
Figure 8 Capacity curve and Performance points for Figure 9 Capacity curve and Performance points
8 storied gravity building and retrofitting with scheme Ifor 8 storied gravity building and retrofitting with scheme II
`
Figure 10 Capacity curve and Performance points for Figure 11 Capacity curve and Performance points for
8 storied gravity building and retrofitting with scheme III8 storied gravity building and retrofitting with scheme IV
Figure 12 Capacity curve and Performance points for Figure 13 Capacity curve and Performance points for
12 storied gravity building and retrofitting with scheme I 12 storied gravity building and retrofitting with scheme
ISSN(Online): 2319-8753
ISSN (Print): 2347-6710
I
nternational
J
ournal of
I
nnovative
R
esearch in
S
cience,
E
ngineering and
T
echnology
(An ISO 3297: 2007 Certified Organization)
Vol. 5, Issue 8, August 2016
Figure 14 Capacity curve and Performance points for Figure 15 Capacity curve and Performance points for
12 storied gravity building and retrofitting with scheme III 12 storied gravity building and retrofitting with scheme
IV
Figure 16 and figure 17 shows hinge formation at performance points of scheme I to IV.It is observed that most of the steel braces fail in compression because of buckling at performance point, but if stronger braces are used; failure mechanism is transferred to column. In case of shear wall, beams which are connected to the shear walls suffered to more damage.
(a) (b) (c) (d)
Figure 16 Hinge formation at performance point of 8 storied retrofitted building (a) Scheme I (b) Scheme II (c) Scheme III (d) Scheme IV
(a)(b) (c) (d)
ISSN(Online): 2319-8753
ISSN (Print): 2347-6710
I
nternational
J
ournal of
I
nnovative
R
esearch in
S
cience,
E
ngineering and
T
echnology
(An ISO 3297: 2007 Certified Organization)
Vol. 5, Issue 8, August 2016
VIII. VIIIEVALUATIONOFGLOBALPERFORMANCECHARACTERISTICOFSTRUCTURE
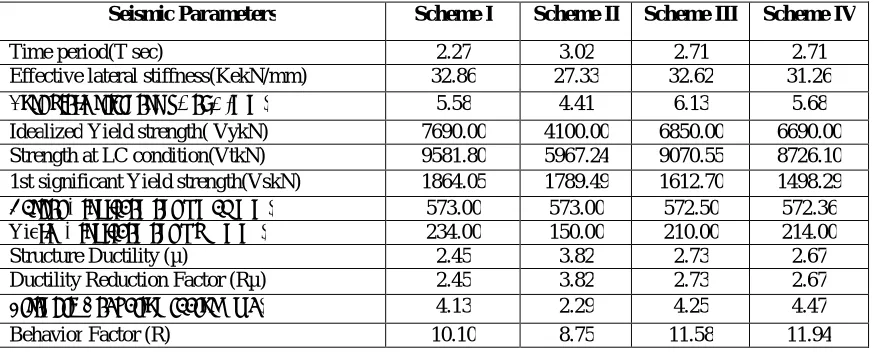
The nonlinear force displacement relationship between base shear and roof displacement of retrofitted building is replaced with idealized bilinear relationship to calculate the different seismic parameters. Different seismic parameters for 8 and 12 storied retrofitted schemes are tabulated in table 6 and table 7
Table 6 Seismic parameters for 8 storied gravity building retrofitted with different schemes
Seismic Parameters Scheme I
Scheme II Scheme III Scheme IV
Time period for cracked section(T sec) 1.76 1.68 1.50 1.49
Effective lateral stiffness(KekN/mm) 49.83 69.63 71.21 68.18
Post yield stiffness(αKekN/mm) 6.84 5.375 12.17 10.62
Idealized Yield strength( VykN) 7325 6615 6765 6750
Strength at LC condition(VtkN) 8988.07 8200.64 9144.85 9089.51
1st significant Yield strength(VskN) 1952.05 2375.2 1667.37 1582.15
Target Displacement(Δmax mm) 390 390 290.631 319.204
Yield Displacement(Δy mm ) 147 95 95 99
Structure Ductility (µ) 2.65 4.10 3.06 3.22
Ductility Reduction Factor (Rµ) 2.65 4.10 3.06 3.22
Strength Reduction factor (Ωd) 3.75 2.79 4.05 4.26
Behaviour Factor (R) 9.94 11.43 12.41 13.75
Table 7 Seismic parameters for 12 storied gravity building retrofitted with different schemes
Seismic Parameters Scheme I Scheme II Scheme III Scheme IV
Time period(T sec) 2.27 3.02 2.71 2.71
Effective lateral stiffness(KekN/mm) 32.86 27.33 32.62 31.26
Post yield stiffness(αKekN/mm) 5.58 4.41 6.13 5.68
Idealized Yield strength( VykN) 7690.00 4100.00 6850.00 6690.00
Strength at LC condition(VtkN) 9581.80 5967.24 9070.55 8726.10
1st significant Yield strength(VskN) 1864.05 1789.49 1612.70 1498.29
Target Displacement(Δmax mm) 573.00 573.00 572.50 572.36
Yield Displacement(Δy mm ) 234.00 150.00 210.00 214.00
Structure Ductility (µ) 2.45 3.82 2.73 2.67
Ductility Reduction Factor (Rµ) 2.45 3.82 2.73 2.67
Strength Reduction factor (Ωd) 4.13 2.29 4.25 4.47
Behavior Factor (R) 10.10 8.75 11.58 11.94
ISSN(Online): 2319-8753
ISSN (Print): 2347-6710
I
nternational
J
ournal of
I
nnovative
R
esearch in
S
cience,
E
ngineering and
T
echnology
(An ISO 3297: 2007 Certified Organization)
Vol. 5, Issue 8, August 2016
Table 8 Comparison of Ratio of initial stiffness and yield strength
Parameters 8 storied building
Scheme I Scheme II Scheme III Scheme IV
Ratio of initial stiffness 2.17 3.03 3.12 2.98
Increase in yield strength (kN) 4000 3290 3440 3425
Parameters 12 storied building
Scheme I Scheme II Scheme III Scheme IV
Ratio of initial stiffness 2.17 1.80 2.15 2.06
Increase in yield strength (kN) 4540.00 950.00 3700.00 3540.00
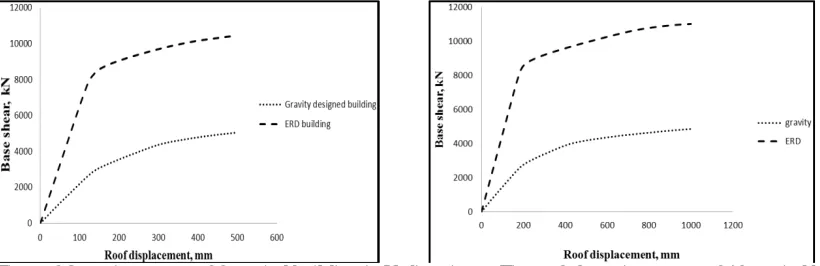
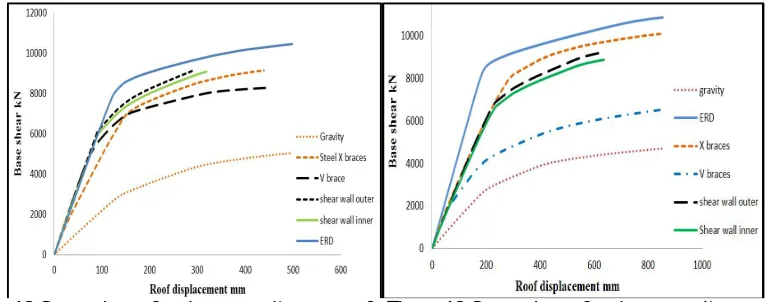
Figure 18 and figure 19 show capacity curves for 8 and 12 storied buildings respectively from curves it can be seen that roof displacement at performance point is higher for gravity building whereas it is lower for ERD building for both 8 and 12 storied building. Base share value is lower for gravity building at performance point where as it is higher for ERD 8 and 12 storied buildings.
Figure 18 Comparison of various capacity curves of Figure 19 Comparison of various capacity curves of 8 storied building 12 storied building
IX. CONCLUSIONS
Assessment of the performance levels of gravity designed buildings shows that they are seismically deficient and found at LS-CP level. As a result different strengthening schemes are used and all these different strategies are aimed at providing IO level for DBE condition. Based on same following conclusions are drawn:
I. Gravity designed buildings are found in LS-CP range for DBE condition whereas buildings designed for seismic
loading according to IS 1893:2002 and ductile detailing are at operational (B) to immediate occupancy (IO) level.
II. Comparison between three strengthening strategies shows that most increase in the lateral strength is related to
using steel X braces and is about 2.2 and 2.4 times to that of 8 and 12 storiedgravitydesigned building respectively.
III. With regards to the performance levels of buildings, the best strengthening system is adding X braces, however
all the strengthening system improved the performance level to immediate occupancy (IO).
IV. Comparison between three strengthening strategies shows that most increase in the stiffness is related to using
shear wall and is about 3.12 and 2.15 times to that of 8 and 12 storied deficient building respectively.
V. A number of different strengthening systems can be adopted to improve the seismic performance of gravity
ISSN(Online): 2319-8753
ISSN (Print): 2347-6710
I
nternational
J
ournal of
I
nnovative
R
esearch in
S
cience,
E
ngineering and
T
echnology
(An ISO 3297: 2007 Certified Organization)
Vol. 5, Issue 8, August 2016
original gravity designed building. In this case shear wall placed in inner bay, improved the performance to desired level but interconnecting beams with shear wall may need local retrofitting strategy to give better performance since they are very near to LS performance level.
VI. Provision of shear wall on outer frame is more effective than provision on inner frames.
VII. In case of 8 storied building slightly increase in yield strength observed but lateral stiffness increases around 14.3% .for 12 storiedincrease in lateral stiffness is not significant.
VIII. The seismic behavior of buildings designed as per IS 1893 part 1 and detailed with IS 13920 is superior when
compared with gravity load designed buildings. Plastic hinges are formed first in the beams. They exhibit higher ductility than gravity designed buildings.
IX. Comparing the seismic performance of shear wall, X and inverted V braced retrofitted building, it is concluded
that all retrofitting schemes have comparable abilities to increase the ductility reduction factor and the over-strength factor; inverted V brace have better ductility reduction factor and shear wall have better overover-strength.
REFERANCES
[1] Applied Technology Council 40 (ATC40),“Seismic evaluation and retrofit of concrete buildings”, Vol.1 & 2, Applied Technology Council, Redwood City, CA, USA, Report No.SSC 96-01,1996.
[2] FEMA 356, “Prestandard and commentary for the seismic rehabilitation of buildings” American society of civil engineers, Reston, Virginia, Nov.2000.
[3] SAP2000 V14.2.4, “Integrated finite element analysis and design of structures basic analysis reference manual”, Berkeley, CA, USA: Computers and structures INC, Aug. 2010.
[4] AgarwalPankaj and Shrikhande Manish, “Earthquake resistance design of structures”, PHI learning private limited, pp.524-555, 2006. [5] IS 13920,"Ductile detailing of reinforced concrete structures subjected to seismic forces- Code of practice". (1993). Bureau of indian
standards,New Delhi.
[6] IS 1893 (part1):2002, "Indian standard criteria for earthquake resistant design of the structures-code of practice". Bureau of indian standards,New delhi.
[7] IS 456:2000,"Indian standard plain and reinforced concrete- code of practice". Bureau of Indian standards,New delhi.
[8] Paul Gopen and AgarwalPankaj, “Experimental verification of seismic evaluation of RC frame building designed as per previous IS codes before and after retrofitting by using steel bracing”, Asian Journal of Civil Engineering (Building and Housing) Vol. 13, 2011.
[9] Viswanath K.G, Prakash K.B., Anant Desai, “Seismic analysis of steel braced reinforced concrete frames”, International journal of civil and structural engineering, Volume 1, No 1, Research article ISSN 0976 – 4399, pp-114-122, 2010.
![Table 2 Effective stiffness value [2]](https://thumb-us.123doks.com/thumbv2/123dok_us/1630805.1203287/3.595.56.538.225.472/table-effective-stiffness-value.webp)