DOI: 10.1534/genetics.107.074377
Predicting the Size of the Progeny Mapping Population Required to
Positionally Clone a Gene
Stephen J. Dinka,* Matthew A. Campbell,
†Tyler Demers* and Manish N. Raizada*
,1*Department of Plant Agriculture, University of Guelph, Guelph, Ontario, Canada N1G 2W1 and †The Institute for Genomic Research, Rockville, MD, 20850
Manuscript received April 10, 2007 Accepted for publication June 4, 2007
ABSTRACT
A key frustration during positional gene cloning (map-based cloning) is that the size of the progeny mapping population is difficult to predict, because the meiotic recombination frequency varies along chromosomes. We describe a detailed methodology to improve this prediction using rice (Oryza sativaL.) as a model system. We derived and/or validated, then fine-tuned, equations that estimate the mapping pop-ulation size by comparing these theoretical estimates to 41 successful positional cloning attempts. We then used each validated equation to test whether neighborhood meiotic recombination frequencies extracted from a reference RFLP map can help researchers predict the mapping population size. We developed a meiotic recombination frequency map (MRFM) for1400 marker intervals in rice and anchored each published allele onto an interval on this map. We show that neighborhood recombination frequencies (R-map,.280-kb segments) extracted from the MRFM, in conjunction with the validated formulas, better predicted the mapping population size than the genome-wide average recombination frequency (R-avg), with improved results whether the recombination frequency was calculated as genes/cM or kb/cM. Our results offer a detailed road map for better predicting mapping population size in diverse eukaryotes, but useful predictions will require robust recombination frequency maps based on sampling more progeny.
A
limited number of forward genetics techniques exist to isolate an allele that underlies a mutant or polymorphic phenotype and that require no prior knowledge of the gene product. These include pro-tocols to isolate host DNA flanking insertional muta-gens (e.g., transposons) (Ballingerand Benzer1989;Raizada2003) and positional gene cloning techniques
(Botsteinet al.1980; Patersonet al.1988; Tanksley
et al.1995) that permit the discovery of alleles created by chemical mutagens, radiation, or natural genetic var-iation. Positional gene cloning is feasible when the fol-lowing conditions are met: (1) two parents exist that differ in a trait of interest; (2) the parents can be distin-guished at the chromosome level by polymorphic DNA markers (e.g., RFLP); and (3) in a population of progeny, the underlying gene can be mapped relative to nearby DNA segments that have previously been cloned (Botstein et al.1980; Tanksleyet al. 1995). Unfortunately, posi-tional gene cloning suffers from unpredictability in terms of the number of post-meiotic progeny that a researcher can expect to genotype to narrow a candidate chromosomal region to a small number of candidate genes (Dinkaand Raizada2006). For example, in rice (Oryza sativa L.), only 1160 gametes were genotyped
to narrow thePi36(t)allele to a resolution of 17 kb (Liu et al. 2005), whereas 18,944 gametes were genotyped to map theBph15 allele to a lower resolution of 47 kb (Yanget al.2004). During fine mapping, the physical distance between a known physical location on a chro-mosome (i.e., the molecular marker) and the target allele is inferred by the frequency of meiotic recombinants that can break cosegregation of the phenotype encoded by the target allele with physically anchored molecular markers (Botsteinet al. 1980; Paterson et al.1988). Ideally, a gene hunt ends once a molecular marker is found that always cosegregates with the target phenotype in a large population of genotyped and phenotyped F2 (or post-F2) progeny. Therefore, the frequency of mei-otic recombination in the vicinity of the target locus (defined asR¼kilobase/cM), along with the local den-sity of molecular markers, determines the size of the mapping population. We are interested in helping re-searchers predict mapping population size. As initial analysis assigns a target allele to a 1–5-cM map interval, the goal of this study is to determine whether the re-combination frequency at this interval size, obtained from a high-density molecular marker map, can be used to predict the number of progeny required for subsequent sub-centimorgan mapping in combination with user-friendly mathematical formulas.
Durrettet al.(2002) used the kb/cM ratio (R) as the
basis of an equation (which we will refer to as the Durrett–Tanksley equation) to predict genotyping
1Corresponding author:Department of Plant Agriculture, University of
Guelph, 50 Stone Rd., Guelph, Ontario, Canada N1G 2W1. E-mail: [email protected]
requirements during positional cloning, the only such equation we could find in the literature. Durrettet al. compared the results of their equation to empirical evidence from 12 published positional cloning suc-cesses inArabidopsis thaliana; the model often appeared to overestimate the number of progeny required to be genotyped. However, the accuracy of the model was difficult to assess, because only the genome-wide re-combination frequency was employed, rather than local rates of recombination. Perhaps as a result, it was simply concluded that some researchers were lucky or unlucky
(Durrettet al.2002).
Building upon the work of Durrettet al., we have tried to understand and predict when a researcher will be lucky or unlucky during positional gene cloning by accounting for: (1) over-genotyping (resulting in re-dundant crossovers between the target locus and the closest molecular markers); (2) a low density of available molecular markers in the target interval (causing some crossovers to be missed); and most important, (3) high or low local rates of local recombination (R) compared to the genome-wide average (Nachman2002). We have compared the predictions of the Durrett–Tanksley equation to empirical data obtained from 41 positional cloning studies in rice (O. sativaL.), which is a model system for the world’s most important crops, the cereals
(Patersonet al.2005). Specifically, we have measured
the predictability of the Durrett–Tanksley equation and then focused on whether ‘‘neighborhood’’ (,2 cM) re-combination values obtained from a reference genetic map (Harushima et al. 1998) further improve the ac-curacy of the model compared to using the genome-wide average recombination rate (R-avg). In addition, we have derived and tested a simpler equation that predicts progeny mapping size. Finally, we have mea-sured the utility of employing R-values calculated as genes/cM rather than kb/cM to predict mapping pop-ulation size, as the former allows the candidate gene number to be estimated, which is of greater interest to researchers targeting sequenced, annotated genomes.
MATERIALS AND METHODS
Use and modification of the Durrett–Tanksley equation:
First, we used the Durrett–Tanksley equation (Durrettet al.
2002) which estimates the number of F2/post-F2 meiotic gametes required to positionally clone an allele as derived from an F1heterozygote, based on the following probability:
P¼1 ½11NT=ð100RÞeNT=ð100RÞ;
wherePis probability (P) that if a (proximal) crossover occurs in the vicinity of a target allele that a second (distal) crossover will be carried by a sibling gamete;Nis number of genotyped chromosomes (informative gametes) required;Tis map reso-lution, the candidate kilobase or gene block distance between the closest two molecular markers containing the target allele; andRis recombination frequency (kb/cM or genes/ cM).
As the equation is dependent only on the valueNT/100R, then if the probability is set at 0.95,NT/100R¼4.744, which may be rewritten asN¼(4.7443100R)/T.
To adjust for the target number of gametes containing an informative crossover (lT), which we assume may decreaseT (better map resolution), we introduced the empirically-derived T modifier, 4.744/lT (see results); the resulting
modified Durrett–Tanksley equation is as follows:
N¼(4.7443100R)/½T-marker3(4.744/lT),
or simplified,
N ¼ ð100R3lTÞ=T-marker;
whereNis total number of informative chromosomes (game-tes) that must be genotyped with the probability of success set atP¼0.95,Ris the local recombination frequency (R-local) (kb/cM or genes/cM),T-markeris distance between the closest two molecular markers (in which crossovers are detected rel-ative to the target allele) (kilobases or gene block), andlTis number of crossovers between the closest two molecular markers ($2).
The Durrett–Tanksley equation assumes that the recombi-nation frequency (R) is constant in the vicinityTof the tar-get allele. This equation also requires that the genotype of the target allele (a) in F2/post-F2progeny can be assigned. Thus, in the case of a recessive target allele,Nequals the number of F2testcross progeny. Alternatively, where F2progeny are the product of selfing F1heterozygotes (such as in plants), then since each F2progeny is derived from two meioses,Nequals two times the number of F2progeny genotyped; this is only true, however, when the F2progeny genotypeAAcan be dis-tinguished from the genotype Aa since this is required to determine whether a crossover occurred on the proximal or distal side of the target allele. Such a determination requires testing progeny for segregation of phenotypes in the F3 gen-eration (progeny testing).
Derivation of a simplified equation based on
single-crossover probability: We developed the following
user-friendly equation to estimate the fine-mapping population size, an estimate of the number of F2 testcross progeny re-quired to be genotyped to detect sufficient crossovers to achieve a desired kilobase or gene block resolution:
N ¼Logð1PÞ=Logð1T-marker=100RÞ;
where Nis the number of meiotic gametes (chromosomes) that must be genotyped in which it can be determined whether a crossover is located proximal or distal to the target allele,Pis threshold probability of success (e.g., 0.95),T-markeris expected distance between flanking molecular markers (kilobases or can-didate genes), andRis local or genome-wide average recom-bination frequency (kb/cM or genes/cM).
molecular markers (T-marker) is often limiting, then the prob-ability is high that the distance between the closest two cross-overs will be,T-marker.
The detailed derivation of this equation is as follows:
1. P(failure) of a crossover in the target interval (T) per gamete¼(total genome crossoverstarget interval cross-overs)/total genome crossovers.
2. Alternatively, P(failure) per gamete ¼ 1 (fraction of genome3number of crossovers in whole genome). 3. Thus, P(failure) per gamete ¼ 1 ½(kb resolution/kb
genome size3(genome map in cM/100)orP(failure) per gamete ¼ 1 ½(gene block resolution/genome-wide gene number3(genome map in cM/100).
4. Since P(failure) ¼ (Pfailure per gamete)N, where N is number of informative gametes, then
N ¼LogðPfailÞ=LogðPfail per gameteÞ
and
N ¼Logð1PsuccessÞ=LogðPfail per gameteÞ:
5. Therefore,N¼Log (1Psuccess)/Log½1(gene block/ genome gene number3genome map cM/100)orN¼Log (1Psuccess)/Log½1(kb target/genome kb3genome map cM/100).
6. Simplified, the above equation can be rewritten as:
N¼Log (1Psuccess)/Log½1(kb target/100)3(total cM/total genome kb),
or
N ¼Logð1PÞ=Logð1T-marker=100RÞ;
whereRis local or genome-wide recombination frequency. Additional assumptions of this model are as follows:
1. The equation assumes that the phenotype of the trait of interest can be readily scored to determine if a crossover occurred proximal or distal to the target allele; henceNis equivalent to the number of testcross progeny, 0.53the number of F2 (selfed) progeny (if no progeny testing performed), or 23the number of F2(selfed) progeny (if F3progeny testing is performed).
2. The equation assumes that the frequency of double-recombinants in a small interval is negligible due to crossover interference.
3. The equation assumes that the crossover may occur any-where in the defined intervalTsuch that the distance be-tween each informative crossover and the target locus is,T. 4. The recombination frequency is assumed to be constant in
the region,2T.
Modified single crossover equation: Based on empirical
data, we then modified this equation by adjusting the genetic map resolutionTby the number of crossovers (seeresults),
resulting in the equation:
N¼Logð1PÞ=Logf1 ½T-marker33=lT=100Rg;
whereNis total number of informative chromosomes that must be genotyped with the probability of success,P¼0.95,Ris the local recombination frequency (R-local) (kb/cM or genes/cM), T-markeris distance (kb or candidate gene block) between the closest two molecular markers (in which crossovers are de-tected relative to the target allele), andlTis number of cross-overs between the closest two molecular markers ($2).
Analysis of published positional cloning studies: We
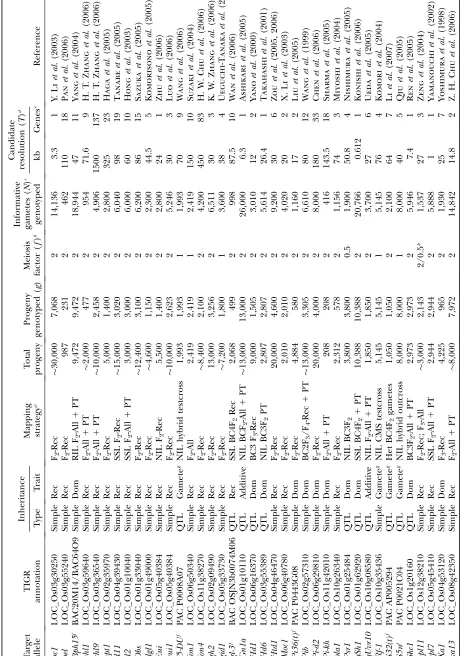
ana-lyzed 41 published positional cloning/fine-mapping studies in rice to extract or calculate the three variables,N, T, and R
(Table 1). The candidate gene resolution (T)½in kb or gene number,T(kb) orT(gene)was either reported in each study or obtained by personal communication with the authors. In the latter case, these were confirmed by corroborating the kilobase resolution with the gene resolution using the TIGR Pseudomolecules Release 4.0 database (Yuanet al. 2005);
retroelements, transposons, and transposases were excluded for gene resolution. The calculation ofNgametes genotyped was more complex; it required us to distinguish the actual number of progeny genotyped (g) from the number of informative chromosomes (N), defined as chromosomes that had the potential of having a crossover between the tar-get allele and a flanking molecular marker, and where the location of that crossover (proximal or distal to the target) was distinguished (e.g., using progeny testing). To convertgtoN, we multipliedgby a meiosis factor (f) as shown in Table 1 (also see footnotes to Table 1). This required us to classify the mapping strategy used and note whether the target trait was dominant, recessive, or was expressed in the haploid genera-tion (gamete or gametophyte). For example, for the cloning of the recessivebc1allele (Y. Liet al.2003), since only F2recessive
progeny were genotyped (7068 recessives genotyped out of 30,000 F2progeny) and hence the genotype of the target allele was non-ambiguous, the total number of informative chromo-somes genotyped was 237068 (i.e.,f¼2, henceN¼23g). In contrast, for the fine mapping of the dominant Psr1 allele (Nishimuraet al. 2005), since 3800 (Backcross 3, BC3) F1
progeny were genotyped, and thus only 50% of the target chromosomes underwent informative meioses, thenf¼0.5, and N ¼ 1900 informative chromosomes. For rice, it was assumed that males and females had equal rates of recombi-nation, but in many species, such as zebrafish, this is not true (Singeret al.2002; Lenormandand Dutheil2005) and must
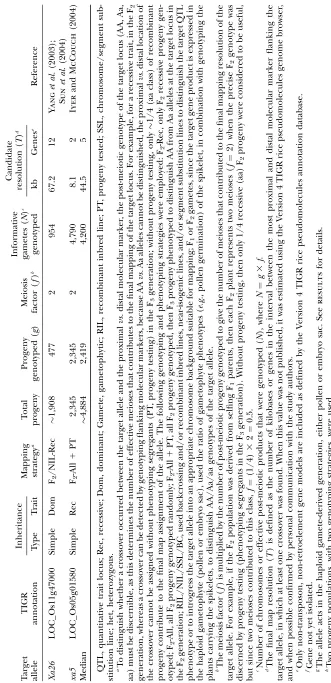
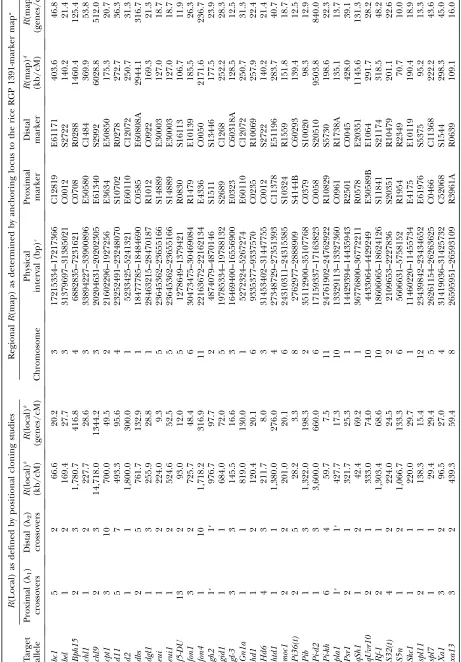
be accounted for in the meiosis factor. Finally, to calculate the local recombination frequency (R-local) (Table 2), we used the following equation:
R-local¼TðlocalÞ=mðlocalÞ;
where R is local recombination frequency (kilobases/cM), T(kb) is distance in kilobases between the closest two cross-overs,mis genetic map distance between the two crossovers in centimorgans, andm¼1003(l11l2)/N, wherel1is number of closest, proximal crossovers (Table 2),l2is number of closest, distal crossovers (Table 2), andN is total number of informa-tive gametes (chromosomes) genotyped (Table 1). In a testcross, m¼1003l/progeny, whereas in a selfed cross with progeny testing,m¼1003(l/23progeny) since genotyping permits both chromosomes to contribute to the mapping population. The only crossovers (lT) in the calculation were those that were in between the two molecular markers used to defineT. For each of the 41 studies, we applied the values forR(local), T(kb) and setPat 0.95, to the Durrett–Tanksley equation and compared the number of informative gametes (N) required by this equation to the empirical numbers shown in Table 1. We performed both nonparametric correlation analysis (Spear-man coefficient) and linear regression analysis using the software program Instat 3 (GraphPad Software).
Generation of a reference meiotic recombination frequency
map (MRFM) for rice:To determine whether recombination
frequencies derived from a reference genetic map could be used to predict progeny sampling requirements using the Durrett–Tanksley equation, we first assembled such a map, inspired by a previous report (Wuet al.2003), to generate two
F2 population between Nipponbare and Kasalath were ob-tained from the Rice Genome Project (RGP: http://rgp.dna. affrc.go.jp/) (Harushimaet al.1998). FASTA sequence files
for the markers were obtained from NCBI. The RFLP marker sequences from the RGP map were physically mapped onto the version 4 TIGR rice pseudomolecules map (http://www. rice.tigr.org) using the Genomic Mapping and Alignment Program (GMAP) (Wu and Watanabe 2005). The physical
map position of each marker was derived from the top hit that exceeded a threshold of 95% identity over 90% of the length. After physically positioning the RFLP markers onto the pseu-domolecules, Perl scripts and manual inspection were used to remove all markers showing map incongruency (where the physical and genetic position of the markers were at odds). We obtained 1391 congruent markers for the RGP map. This es-tablished both physical and genetic locations and hence in-terval distances for each RFLP marker; from these values, the kb/cM recombination frequency was calculated for each marker pair. To generate the corresponding genes/cM frequencies, we queried the Osa1 database at TIGR: the coordinates of all 42,535 non-transposable element-related transcription units were obtained (Yuanet al. 2005). Custom Perl scripts were
written to bin these transcription units between each RFLP marker pair. This established the number of non-transposable element candidate genes for each interval along with the genetic locations of these markers, and hence the following parameters were calculated for each RFLP marker pair: the genetic distance between each marker and the corresponding genes/cM recombination rate.
Testing the predictive value of the Modified Durrett–
Tanksley equation using R-map recombination frequencies:
Next we assigned each target allele to a physical location on the RGP physical map, which contains 1400 marker intervals. To accomplish this, each target allele was assigned a TIGR locus number (if cloned) onto a BAC/PAC clone (if not cloned; TIGR Pseudomolecules Release 4.0); sometimes this informa-tion was published. In remaining examples, the GenBank gene sequence or molecular marker information was used to screen the TIGR rice sequence database; the genetic map position, marker data, and BAC/PAC assignment helped to verify the physical assignment. The locus or BAC/PAC name and sequence was then used to assign each allele to an interval between two mapped markers on the RGP MRFM of rice (Table 2; supplemental Table 1 at http://www.genetics.org/ supplemental/). The recombination frequency of the corre-sponding marker interval (R-map) was then employed; because we feared that chance crossovers might distort the recombina-tion frequency in small intervals (,277 kb, 1-cM average) on this map, adjacent segments were sometimes added together (to achieve a.280-kb interval) before calculating an average R-map value with the goal of situating the target allele at the physical center of the larger interval. In rare situations, an R-map value for an interval of,280 kb was accepted because adjacent intervals were unusually large. The choice to add or not add marker intervals was done blindly from theR-local values in order to not biasR-map values. TheR-map values were then applied to each equation.
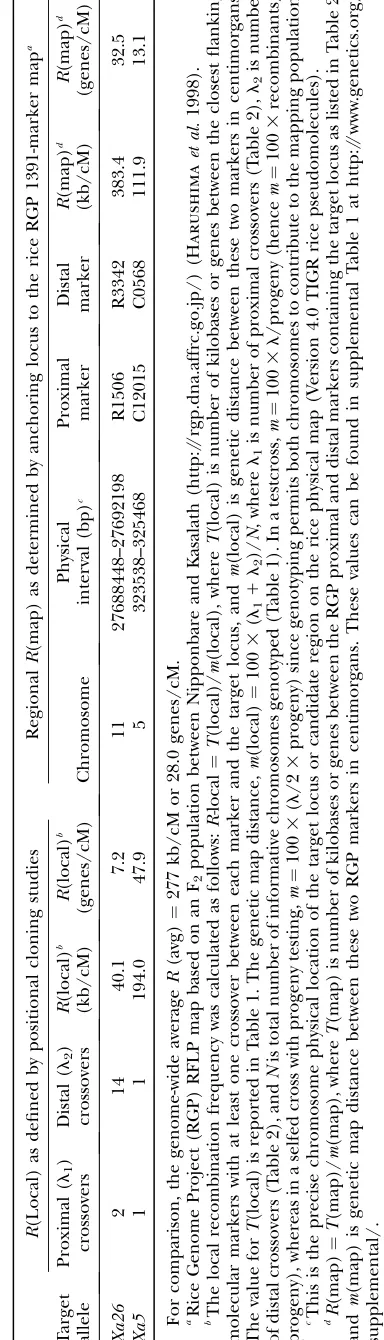
Calculation of R-avg values: The genome-wide average
recombination frequency in kilobases/cM was calculated by dividing the total genome size (430 Mb) (IRGSP 2005) by the total genetic map length (1521 cM) (Harushimaet al.
1998); the average recombination frequency in genes/cM was calculated by dividing the total number of non-transpos-able element-encoded transcription units (42,535) (Yuan
et al.2005) by the map length. The resulting genome-wide recombination frequency (R-avg) in rice is 277 kb/cM and 28 genes/cM.
RESULTS
Initial equations to predict mapping population size: Initially, we employed two equations to predict the size of the fine-mapping population, one of which is de-veloped here. First, we used the Durrett–Tanksley equa-tion (Durrettet al.2002), which estimates the number of F2/post-F2meiotic gametes required to positionally clone an allele as generated from an F1heterozygote; it calculates the probability (P) that if a (proximal) cross-over occurs in the vicinity of a target allele that a second (distal) crossover will be carried by a sibling gamete, such that the distance between the two crossovers will be the kilobase distance T (Figure 1A), for a prescribed number of genotyped gametes (N) (informative chro-mosomes) and for a given recombination frequency (R), according to the following equation:
P ¼1 ½11NT=ð100RÞeNT=ð100RÞ:
The primary assumption of the equation is that the progeny number will vary with the recombination fre-quency: the higher the frequency of recombination, the fewer progeny will be required to detect a crossover be-tween the target allele and flanking molecular markers.
Seematerials and methodsfor additional details.
We then derived a second equation with the goal of making it more user-friendly for researchers. This equa-tion was based on the following premise: if a crossover occurs in a segment (with lengthT) on the proximal side of a target allele in a large population of F2progeny (N), then there is an equal probability that a sibling gamete will carry a crossover on the distal side within a distance of,Tfrom the target allele as shown in Figure Figure1.—An explanation of how the map resolution (T)
1B. This simplifies the equation by only having to calcu-late the probability of a single crossover within the pop-ulation, noting, however, that although on average any two crossovers will be distanceTapart, they may range from zero to 2T(seematerials and methodsfor fur-ther details). The number of F2testcross progeny re-quired to be genotyped to detect sufficient crossovers to achieve a desired kilobase or gene block resolution is thus as follows:
N ¼Logð1PÞ=Logð1T-marker=100RÞ;
where N is the number of meiotic gametes (chromo-somes) that must be genotyped in which it can be deter-mined whether a crossover is located proximal or distal to the target allele,Pis threshold probability of success (e.g., 0.95),T-markeris expected distance between flank-ing molecular markers (kilobases or candidate genes), andR is local or genome-wide average recombination frequency (kb/cM or genes/cM).
Similar to the Durrett–Tanksley equation, this model as-sumes that the phenotype of the trait of interest can be readily scored to determine if a crossover occurred prox-imal or distal to the target allele; henceNis equivalent to the number of testcross progeny, 0.5 times the number of F2(selfed) progeny (if no progeny testing performed), or two times the number of F2 (selfed) progeny (if F3 progeny testing is performed). The derivation of this equation is in thematerials and methodssection.
Empirical gamete number, mapping resolution, and lessons from published studies in rice:To validate the equations noted above, we first analyzed 41 published positional cloning/fine-mapping studies in rice, to ex-tract or calculateNandT(Table 1) (seematerials and
methods). We made several observations that might be
useful to future research groups who wish to undertake positional cloning in rice. First, as in other species, in rice there was a wide range in the number of informative gametes (N) (potential recombinant chromosomes) that were genotyped to positionally clone target alleles: this ranged from only 416 gametes for the Pi-kh allele
(Sharmaet al.2005) to20,000 gametes for the alleles
Gn1a(Ashikariet al.2005),qSH1(Konishiet al.2006),
andBph15 (Yanget al. 2004), an 25-fold range. The average number of informative gametes genotyped was 5686; the median was 4200. The median target resolution (T) achieved was 44.5 kb or five genes. There were seven examples of single-gene resolution mapping (Table 1), and to achieve this resolution, the number of informative gametes employed ranged from 2800 to 26,000 (10-fold range); the average was 11,593 gametes. Single gene resolution mapping in a smaller genome,A. thaliana, has been much rarer (Dinkaand Raizada2006).
Several fine-mapping strategies were used successfully:
1. Of 41 studies, 11 groups reported isolation of a quantitative trait locus (QTL); to reduce the effects
of minor QTL and/or to be able to employ a back-ground with well-characterized molecular markers, the target QTL was isolated by limited backcrossing (BC) or full introgression (near isogenic line, NIL) into a new genetic background. In other examples
(e.g.,qSH1) (Konishiet al.2006), the original QTL
genome was used for mapping such that all but the target QTL was fixed (not segregating); to create heterozygosity in the region containing the target allele for mapping, a corresponding chromosome segment from a polymorphic genotype was crossed in ½segment substitution line (SSL)(Table 1).
2. Because outcrosses/testcrosses are challenging in rice, most studies involved selfing progeny, which has the potential of carrying informative crossover events on both diploid chromosomes, thus poten-tially doubling the effective number of informative gametes (N). One of the challenges created by selfing, however, for recessive alleles, is that it is not possible to determine whether a crossover occurred proximal or distal to the target without checking for the segrega-tion pattern (progeny testing, PT) in the subsequent generation (e.g., F3) to distinguish all genotype com-binations (aa,Aa,AA) at the target locus. Six groups progeny-tested to check the recessive genotype (e.g., chl1) (H. T. Zhanget al.2006). Alternatively, to avoid F3 generation phenotyping, 15 groups (e.g., bc1) (Y. Li et al.2003) preselected recessive (mutant) progeny by phenotyping and then only genotyped this subset, thus discarding 75% of all progeny.
3. There were 12 fully dominant alleles targeted; in these cases, as in recessive alleles, because the proximalvs. distal location of flanking crossovers could not be distinguished without distinguishingAAfromAa geno-types, researchers either progeny-tested in the sub-sequent generation (e.g.,Pi-kh) (Sharmaet al.2005) or, cleverly, preselected only the recessive progeny class for genotyping (e.g.,Xa1) (Yoshimuraet al. 1998). 4. Finally, there were four examples½f5-DU,Rf-1,S32(t),
S5n
where the target alleles were expressed in the haploid generation (e.g., pollen grain, embryo sac) and where the nature of the gene products often required generating outcross/testcross progeny for mapping. In the case off5-DU(Wanget al. 2006), an allele that boosts pollen viability in specific hybrid genotypes, testcross progeny were used for mapping, since phenotyping required a hybrid background to check for segregation of viable pollen grains (either high or low). Similarly, to fine map the S5nlocus (Qiu et al.2005), which confers embryo sac viability to wide-cross hybrids, 8000 hybrids were generated by out-crossing a heterozygous NILS5n/
viability was measured in the spikelets of selfed F2 plants. Finally, in the case ofRf-1, a nuclear locus that restores male gamete (pollen) fertility by overcoming the effects of a mitochondrial½cytoplasmic male ster-ility (CMS)gene, 5145 testcross F2progeny (three-way cross: heterozygote restorer3non-restorer tester) were generated for mapping and the segregation of pollen viability scored (Komoriet al.2003, 2004).
Lessons from calculating empirical local recombina-tion frequencies (R-local) and their use in validating predictive equations: To both validate the equations noted in this study and later understand any discrep-ancies between the experimental data and predictions based on the molecular marker map, we then calculated the experimental (local) recombination frequency (R-local) for each of the 41 successful fine-mapping studies in rice (seematerials and methods) (Table 2). From each study, we counted the number of crossovers located between the closest two markers used to define the final map resolution (T); these are the first recom-binants used to define the edges of the candidate target region. Although we expected to find only 1 crossover on each distal or proximal flank (2 total), in 32 of 41 examples we found between 3 and 16 total crossovers, due to hotspots of recombination and/or poor marker density; such redundant crossover targets suggested that an excess number of progeny were genotyped given the available marker density in the majority of rice posi-tional cloning attempts, an important observation.
Since a high density of molecular markers and large progeny numbers are used in positional cloning, the R-local values provide an interesting snapshot into the variation in recombination frequency in the rice ge-nome: we found that though the genome-wide average R was 277 kb/cM or 28.0 genes/cM in rice, locally, R-values ranged from 3.3 to 1344.2 genes/cM or 28.2 to 14,718 kb/M, an 400-fold and 500-fold range, re-spectively. Strongly influenced by chance, such a wide range in recombination frequencies would largely ex-plain the wide range in the number of progeny that were genotyped in rice (Table 1). The most hyper-recombi-nogenic region (3.3 genes/cM, 28.2 kb/cM) flanked thePi36(t)allele (Liuet al.2005), which required only 1160 informative gametes to achieve a map resolution of 17 kb or two candidate genes. The region with the least amount of recombination (1344.2 genes/cM or 14,718 kb/cM) encompassed the chl9 allele; in this study, although 4906 informative chromosomes were geno-typed, the map resolution was 1500 kb or 137 genes (H. T. Zhanget al.2006). These two groups define the extremes of good and bad ‘‘luck,’’ respectively, in rice, and as such may set upper and lower map-population-size boundaries for future positional cloning attempts in this important species.
We then compared the empirical number of gametes that were genotyped (N) in each study to the number
predicted by both equations (see above) given only the variablesTandR-local; this allowed us to first test the validity of the equations in rice and to modify the equa-tions if necessary. The size of the mapping population (informative chromosomes) (N) predicted by the Durrett– Tanksley equation compared to the empirical data, for givenTandR-local values (in kb/cM), is shown in Figure 2A; we found a strong positive correlation between the mapping size predicted by the Durrett–Tanksley equa-tion and the experimental results (Spearmanr¼0.85, P, 0.0001,n¼41). In at least 10 examples (10/41), however, in spite of using the actual recombination frequencies, we found that the Durrett–Tanksley equa-tion overestimated the mapping populaequa-tion by at least twofold, which would have caused researchers to unnecessarily genotype thousands of extra progeny. The simpler, Single Crossover model appeared to be a slightly better predictor of the progeny mapping pop-ulation size as shown in Figure 2B. Although this second equation predicted the mapping population N with a near-equivalent correlation as the Durrett–Tanksley equation (Spearman r ¼ 0.86; P , 0.0001; n ¼ 41), linear regression analysis of the two models (Figure 3, A and B) demonstrated that the single crossover equation came closer to a linear slope ofm¼1on anx–yscatter plot of predictedvs.experimentalNvalues; in the case of the Durrett–Tanksley model, the best-fit line followed the equationy¼1.70x1323 (goodness of fitr2¼0.76, Sy.x¼5456), whereas for the single crossover equation, the best-fit line wasy¼1.07x833 (r2¼0.76, Sy.x¼ 3426). Although one equation was slightly better than the other, these results demonstrate for the first time that (both) simple formulas, if based on accurate local recombination frequency values, can provide signifi-cant guidance in predicting the mapping population size in the majority of alleles targeted for positional cloning.
Nempirical ¼ 4.744/l
T. Therefore, we adjusted T by multiplying it by 4.744/lT, wherelTis the total number of crossovers in this region. Accordingly, we also rede-fined T asT-marker to note that marker density often rate-limits the physical resolution. The resulting modi-fied Durrett–Tanksley equation is
N ¼ ð4:7443100RÞ=½T-marker3ð4:744=lTÞ;
or simplified;
N ¼ ð100R3lTÞ=T-marker;
where N is total number of informative chromosomes that must be genotyped with the probability of success set atP¼0.95,Ris the local recombination frequency (R-local),T-marker is distance between the closest two molecular markers (in which crossovers are detected relative to the target allele), and lT is number of crossovers between the closest two molecular markers ($2). This is a rewritten version of the standard map distance calculation:m¼1003recombinants/progeny for a testcross, assuming no double crossovers (Haldane 1919).
Figure2.—Testing the validity of two mathematical equations as predictors of the size of the progeny mapping population (N)
We then compared the predictions of the modified Durrett–Tanksley equation, usingR-local values (Table 2), to the published mapping size population values (N); as shown in Figure 3C, the modified equation was 100% predictive (y ¼ 1.0x, r2 ¼ 1.0, F ¼ 0). Using a similar approach, we also modified the Single Crossover equation. By plotting the ratioNmodel/Nempiricalrelative to the number of crossovers (lT) (where lT ¼ l11 l2) (Table 2) on a scatter plot, we found that there was an inverse Power relationship between the two variables such thatNmodel/Nempirical3/lT. Therefore, we modi-fied the genetic map resolution T by the number of crossovers, resulting in the following modified Single Crossover equation:
N ¼Logð1PÞ=Logf1 ½T markerð3=lTÞ=100Rg:
As shown in Figure 3D, again the modified equation was close to 100% predictive of the empirical results (y¼ 1.0x1.5,r2¼1.0).
These modified equations offer some advantages for researchers: these equations define probability explic-itly as the number of crossovers (informative gametes) that a researchers can expect to achieve for a given progeny population. A researcher is taking more of a risk
if the goal is to achieve only two informative gametes, each carrying a crossover on either side of the target allele (lT ¼2), compared to if the target is five informative gametes. These equations also make it explicit that the density of available molecular markers in the target region is critical: if there are few available molecular markers, a researcher does not achieve better resolution by increasing the number of progeny geno-typed (N) beyond a certain threshold. We suggest that users of this equation who wish to predictNshould select T based on a realistic density of achievable molecular markers in the vicinity of the target allele, and adjustlT according to their own risk assessment. For example, if obtaining only two informative recombinant gametes is too risky,Nshould be increased.
Predictive value of the equations using recombina-tion frequencies derived from a MRFM:In the analysis above, we validated both Durrett–Tanksley equations and the Single Crossover equations using published high-resolution, local recombination frequencies (R-local) derived from already fine-mapped alleles. Our goal was to predict the progeny mapping population (N infor-mative gametes) in advance, however, whereas R-local data is not available until the conclusion of a positional cloning attempt. Previousa priorimapping population Figure 3.—Linear
estimates only used the genome-wide average recombi-nation frequency (R-avg) (Durrettet al.2002), but as we have confirmed (Table 2) and as many others have noted (Wuet al.2003; Crawford et al.2004; McVean et al. 2004), recombination frequencies vary tremen-dously along any chromosome. Therefore, we wondered if we could more accurately predict N in advance by employing regional meiotic recombination frequencies from a high-density molecular marker map (R-map). To accomplish this, we first developed a MRFM for 1400 marker intervals in rice, based on the Rice Genome Pro-ject (RGP) F2 ½Nipponbare ( Japonica)3 Kasalath (In-dica)RFLP map (Harushimaet al.1998). MeanR-map values were 33.5 genes/cM and 294 kb/cM, similar to calculations of the whole-genome average recombination frequency (R-avg) for rice (28 genes/cM and 277 kb/cM). The entire R-map data set is located in supplemental Table 1 (http://www.genetics.org/supplemental/) and it should serve as a useful reference for future positional cloning studies in rice.
Next,in silico, we mapped each cloned allele onto a physical and genetic interval on this map as shown in Table 2 (seematerials and methods). We then used the corresponding ‘‘neighborhood’’ recombination fre-quencies (R-map) to calculate mapping population sizes (N). As shown in Figure 4, we found that there was a modest but significant improvement in predicting the number of informative gametes (N) required to be ge-notyped when recombination frequencies (calculated
as kilobases/cM) were based on rice RGPR-map values; as we suspected, we found that there was not a signif-icant correlation between the empirical mapping size (N) vs. mapping sizes predicted by either of the two (unmodified) equations when theR-avg value was used (Spearmanr¼0.30,P¼0.0547,n¼41) (Figure 4, A and D). In contrast, the correlation was significant when R-map values were used (Spearmanr¼0.46,P¼0.0022, n ¼ 41) (Figure 4, B and E) and this correlation in-creased even further when several outliers were re-moved (Spearmanr¼0.61,P,0.0001,n¼36) (Figure 4, C and F). Surprisingly, however, the correlation did not improve even further when the modified equations were used that took into account the number of im-mediate crossovers (lT) (forR-map, Spearmanr¼0.35, P¼0.0232, considered significant); however, the corre-lation was still a significant improvement over when the R-avg value was used in conjunction with the modified equations (Spearman r ¼0.21, P ¼0.19, n ¼41, not significant; data not shown). We conclude that mapping size predictions based on neighborhood (.280-kb seg-ments) recombination frequencies (in kilobases/cM) better predict the number of progeny required to be genotyped to positionally clone a gene than predictions based on using the genome-wide average recombina-tion frequency.
The effect of using R-map recombination frequen-cies calculated as kb/cMvs.genes/cM:Although use of R-map values better predicted the size of the progeny Figure4.—Modest improvement in predicting the size of the progeny mapping population (informative gametes) required to
be genotyped during positional cloning when using neighborhood recombination frequencies extracted from a reference genetic map (R-map) compared to the whole genome average (R-avg) usingR-values based on kilobase/cM calculations. On thex-axis is the mapping population size from published positional cloning studies in rice (see Table 1). On they-axis is the prediction. (A–C) Models based on the Durrett–Tanksley equation (unmodified). (D–F) Models based on the Single Crossover equation (unmod-ified).R-map values were calculated from the 1400-marker Rice Genome Project (RGP) RFLP map (F2of Nipponbare3Kasalath cross) (seematerials and methods). In C and F, five outliers were removed in comparison to B and E, respectively. Both
mapping population compared to the genome-wide aver-age recombination frequency, we were disappointed that the improvement was not more significant. In order to understand the reason, we asked to what extent R-map values calculated as kilobases/cM (from the rice RGP 1400-marker map) in fact correlated with the R-local values that we extracted from the 41 published studies. As shown in Figure 5A, the correlation was in fact poor (Spearmanr¼0.23,P¼0.1428, considered not significant); of course, there was no correlation when R-local was compared toR-avg, so theR-map (kb/cM) values were still useful.
However, we then asked whether the correlation im-proved whenR-map was calculated as genes/cM instead of kb/cM. Limited evidence (Fuet al.2001) suggested that the crossovers contributing toR-map values might primarily be occurring in and around genes. In fact, as shown in Figure 5B, we found a significantly improved correlation betweenR-map values calculated as genes/cM toR-local values also calculated as genes/cM (Spearman r¼0.48,P¼0.0016).
Therefore, we retested whether we could better pre-dict progeny mapping population sizes (N) when using rice RGPR-map values calculated as genes/cM rather than kilobases/cM. Using R-map (genes/cM) calcula-tions shown in Table 2, Figure 6 demonstrates that in-deed the map population (N) predicted by both the (unmodified) Durrett–Tanksley equation and the (un-modified) Single-Crossover equation based onR-map (genes/cM) values better predicted the published re-sults over the genome-wide R-avg (28 genes/cM) or R-map values based on kb/cM (Figure 6vs.Figure 4). In fact, with three outliers removed, the correlation be-tween the progeny size predictions based onR-mapvs. the published data was extremely significant (Spearman r¼0.67,P ,0.0001,n¼38) (Figure 6, C and F). Al-though the predictions did not improve further when the modified equations were used (forR-map, Spear-manr¼0.38,P¼0.0151, considered significant), the predictions were significantly better than when the R-avg value was used in conjunction with the modified equations (Spearmanr¼0.05,P¼0.7662,n¼41, not
significant; data not shown). We conclude that mapping size predictions based on neighborhood (.280-kb seg-ments) recombination frequencies (R-map) better pre-dict the number of progeny required to be genotyped for positional gene cloning in rice when R-values are calculated as genes/cM rather than kilobases/cM, and both are significant improvements over calculations based on the genome-wideR-avg.
The limiting factor is thatR-map values often do not reflect R-local frequencies, but when they do the progeny mapping size can be accurately predicted:As calculated in Table 2 and shown in Figure 7A, the limiting factor is that the neighborhood recombination frequency often does not reflect the local recombina-tion frequency, even though it is more reflective of local rates of recombination than the genome-wide average. The situation may or may not be better for other maps in other species, particularly as more robust, higher-resolution maps are constructed. Indeed, the rice map gave us hope for the future; in spite of the problems with our use of this map (seediscussion) as shown in Figure 7A, we found 11 examples where theR-map values (cal-culated as genes/cM) were only ,30% different than the correspondingR-local value. These corresponded to the following loci: f5-DU, spl11, gl-3, pla1, hd1, moc1, S32(t),bel,dl1,fon4, andPi-d2.When the mapping pop-ulation size (N) was calculated for only these 11 alleles, shown in Figure 7, B–E, linear regression analysis showed that both the modified Durrett–Tanksley equation as well as the modified Single Crossover equation very ac-curately predicted the mapping population size (N) using recombination frequency (R-map) values from the RGP map: the best fit lines were linear (m¼1.2) and the predictions matched the best-fit lines with very high r2values (0.95–0.98). Similar results were obtained for 10 examples whereR-map values, calculated as kb/cM, were used; in that case, the predictions matched the best-fit line also withr2value of 0.98 (slopey¼0.8x 590; data not shown).
The utility of our approach was best demonstrated by comparing the data for bel (Pan et al. 2006) vs. Pi-d2 (Chen et al. 2006); empirically, only 462 informative Figure 5.—Meiotic
gametes (N) were genotyped to fine mapbelto a map resolution (T) of 18 genes; in contrast, 8000 informative gametes were required to fine map Pi-d2 to a map resolution of 33 genes. The RGP map correctly pre-dicted that the recombination frequency (R-local) flanking Pi-d2 was 20-fold lower than that flanking bel. As a result, both modified equations would have predicted in advance that mappingbelto this resolution would require 360 gametes, and that Pi-d2 would require10,000 gametes. If such accurate predictions could be made across the majority of target loci in the future, then researchers will be able generate appropri-ately sized map populations and properly allocate hu-man, growth room, and financial resources.
DISCUSSION
A key frustration during positional gene cloning, also known as map-based cloning, has been that the size of the mapping population has been found to vary. 25-fold within a species (Dinkaand Raizada2006) (Table 1) depending on the target locus, and that this final size has been difficult to predict. As a result, researchers often undertake positional cloning attempts with some fear. More importantly, it has been difficult to estimate
the time, resources, growth space, and personnel re-quired to generate, propagate, genotype, and pheno-type an appropriately sized progeny population. The goal of this research was to create a detailed method-ology to improve mapping size predictability across eukaryotic species once researchers have initially map-ped a target locus to a small interval (1–2 cM). As a side benefit, we have provided a detailed review of positional cloning strategies and results in rice, which should be useful information for the research community studying rice, the world’s most important crop. Building upon the work of Durrettet al.(2002), we have demonstrated the utility of a formula (the Durrett–Tanksley equation) that predicts progeny population size N(Figure 2). By further fine-tuning the Durrett–Tanksley equation, tak-ing into account how many (redundant) crossovers de-fined the map resolution T (a measure of the local marker density), we were able predict the size of the mapping population with 100% accuracy when provided with local, high-resolution recombination frequencies (Figure 3). We also derived and tested a simpler, more user-friendly equation, based on the probability of achieving only one crossover within the progeny pop-ulation, instead of the two calculated by the Durrett– Tanksley equation. We found that the Single Crossover model was as predictive as the Durrett–Tanksley Figure6.—More significant improvement in predicting the size of the progeny mapping population (informative gametes)
required to be genotyped during positional cloning in rice when employing neighborhood recombination frequencies (R-map) from the RGP map calculated as genes/cM rather than kb/cM. On thex-axis is the mapping population size from published positional cloning studies in rice (see Table 1). On they-axis is the prediction. (A–C) Models based on the Durrett–Tanksley equation (unmodified). (D–F) Models based on the Single Crossover equation (unmodified).R-map values were calculated from the 1400-marker Rice Genome Project (RGP) RFLP map (F2of Nipponbare3Kasalath cross) (seematerials and methods). In
equation, and that the number of crossovers (l) was again a useful equation modifier (Figures 2 and 3). With validated equations, and researchers not having the luxury of having access to robust recombination fre-quencies in the vicinity of their target allele, we measured whether recombination frequencies derived from a 1400-marker reference genetic map (supple-mental Table 1 at http://www.genetics.org/supple(supple-mental/) could be useful, and indeed the map population size was more accurately predicted when these values were used instead of the genome-wide average recombination fre-quency (Figures 4 and 6). Since researchers targeting a fully sequenced genome care more about how many candidate genes they must distinguish, not the number of kilobasesper se, we also determined that the models could predict gene resolution as well as or better than the kilobase resolution (Figures 5 and 6). Although the rice map, in conjunction with our formulas, could have accurately predicted several unusually large or small
mapping population-requiring target alleles, including alleles located near centromeres suffering from sup-pressed meiotic recombination (e.g., chl9, Pi-d2, and Bph15), we found that the limiting factor was the cor-relation betweenR-mapvs. R-local recombination fre-quencies (Table 2, Figure 7).
Understanding R-map vs. R-local discrepancies:
There are likely several reasons for why recombination frequencies from a reference genetic map (R-map) in rice often did not match the frequency in the vicinity of target alleles (R-local), and these are important lessons for future attempts to predict mapping population size. First and most obvious, even within a.280-kb interval (1 cM average), the rice RGP map demonstrated that the meiotic recombination frequency could vary signif-icantly (Wuet al.2003) (supplemental Table 1 at http:// www.genetics.org/supplemental/). Second, as is the case with many whole-genome genetic maps, only small num-bers of progeny (typically 100–200) were genotyped to Figure7.—The underlying limiting factor is that the neighborhood (.280 kb) recombination frequencyR-map often does not
generate the RGP map (Harushima et al.1998); as a result, the location of rare crossovers was more subject to chance. In other words, had the RGP map been gen-erated multiple times using independent populations, the recombination frequencies would likely have varied significantly within 1–2-cM intervals. Third, whereas the RGP map was based on two parental genotypes, the rice Indica variety (Kasalath) and the Japonica variety (Nipponbare) (Harushimaet al.1998), only 8 of 41 of the studies that we compared our models to also used these genotypes to generate their mapping populations. Differences between genotypes, such as the density of repetitive DNA or local cytogenetic rearrangements as seen in maize (Bennetzen and Ramakrishna 2002; Wang and Dooner 2006), might have caused R-map values from the RGP map to differ from the published studies. Indeed, it has been shown that domesticated rice cultivars have an unusually high rate of ongoing gene duplications, vary considerably in the location and density of repetitive DNA (e.g., retroelements), and have very high rates of intergenic nucleotide polymorphisms (SNPs, indels), perhaps in part due to human selection in geographically isolated locations (Garriset al.2005; Yuet al.2005; Tanget al.2006). Finally, the RGP map was generated using F2 selfed progeny, whereas the map-ping populations used in the 41 published studies were generated by diverse methods, including the use of NILs, chromosome SSLs, and recombinant inbred lines (RILs), and in at least at one locus with low recombination rates, fon4-1, an200-kb chromosome deletion was involved (H. W. Chuet al.2006). It has been shown that when two chromatids differ in their relatedness to one another, as in RILsvs.NILs, the local recombination frequency may be affected (Burrand Burr1991; Lukacsovich and
Waldman 1999; Li et al. 2006); in the most extreme
case, unequal deletions between chromatids, suppres-sion of meiotic recombination has long been observed
(Rieseberg2001). All of these factors might have
con-tributed to our observation thatR-map values from the rice RGP map often did not match recombination fre-quencies in the vicinity of target alleles.
Applying these results: As for our recommendations to researchers undertaking positional cloning, we rec-ommend that theR-map strategy should only be relied upon when they have access to a reference genetic map that has been demonstrated to have a strong correlation betweenR-map values andR-local values. To make this possible, higher resolution maps, with more markers, must be generated and/or employed to account for sub-centimorganRvariation. In potato, a genetic map with 10,000 markers was recently constructed (vanOset al. 2006), demonstrating progress in this area. Such high-resolution maps will provide researchers with a range of recombination frequencies across a 1–2-cM interval, and thus, at best, researchers could expect to predict an upper and lower range ofN, not the precise number. To improve the robustness (reproducibility) ofR-map fre-quencies, genetic maps must be generated based on sampling hundreds to thousands of progeny rather than only 100–200 individuals (Ferreiraet al. 2006). To make reference map frequencies relevant to the genotypic targets of positional cloning, maps must be constructed from more parental genotype pairs. In addition, for some species, the number of informative gametes (N) might need to be adjusted to account for malevs.female differences in recombination frequency (Lenormand and Dutheil2005) by adjusting the meiosis factor (f)
(see materials and methods). As to whetherR-map
values based on genes/cM or kilobases/cM should be used, we had assumed, given that meiotic recombina-tion in plant genomes has been shown to be highly biased to gene regions, rather than flanking hetero-chromatin (Fu et al. 2001), that if we ascribed most recombination as occurring within or flanking genes, Figure 8.—The final goal of
this research: a mapping popula-tion size predicpopula-tion graph. Shown are the predictions for rice chro-mosome 3 of the number of prog-eny (informative gametes, N) required to positionally clone a target allele to achieve a five-candidate gene map resolution (T) based on the Single Crossover equation (unmodified) with a 95% probability of success. The x-axis denotes the physical base pair location along the sequenced chromosome. Arrows point to previously isolated alleles in rice; the model was effective in predict-ing the relative mapppredict-ing popula-tion size for these alleles (see
resultstext). For example, the graph accurately predicted that 20-fold more progeny would be required to positionally clone
then the genes/cM ratio would be less variable than the kb/cM ratio; in other words, as the number of genes increased in an interval, the frequency of crossovers would also increase in proportion, keeping the genes/cM ratio constant. However, in retrospect, two pieces of data now suggest that this assumption was incorrect. First, in the meiotic recombination frequency calculations we made on the RGP rice map, we found that the genes/cM ratio varied within the genome nearly as much as the kb/cM ratio; the coefficient of variation forR(genes/cM) was 98% across the rice genome (n¼971) compared to 113% forR(kb/cM) (n¼952). Second, if recombina-tion was biased to within or near genes, then the recom-bination frequencies from positional cloning studies (R-local) would be predicted to be higher than the genome-wide average for rice (R-avg¼277 kb/cM); in fact, out of the 41 published studies, 20 studies had a R-local value belowR-avg with 20 above theR-avg, sug-gesting no bias in recombination near genes (Table 2). It is therefore possible that the stronger correlation we found for the RGP map betweenR-mapvs. R-local, when calculated as genes/cM, was random, but this should be tested for more maps and for more species. Indeed, it will be interesting to test the predictions of this paper in both larger and more compact genomes.
As more robust, higher-resolution maps across more parental genotypes become available, our hope is that the methodology we have described here will generate accurate mapping population size graphs that predict a range ofN-values for a given target allele. We conclude by showing an example of such a map in Figure 8, re-presenting our predictions for rice chromosome 3. In spite of the challenges noted, this map did accurately predict the very different mapping population sizes required for the five alleles shown.
We thank the corresponding authors of the positional cloning stud-ies cited here for numerous personal communications. Funds for work on rice genome annotation at The Institute for Genomic Research were through a grant from the National Science Foundation (DBI 0321538) to C. Robin Buell. This research was supported by an Ontario Premier’s Research Excellence Award, an Ontario Ministry of Agricul-ture and Food (OMAF) grant, and a Discovery Grant from the Natural Sciences and Engineering Research Council of Canada, to M.N.R.
LITERATURE CITED
Ashikari, M., H. Sakakibara, S. Y. Lin, T. Yamamoto, T. Takashi
et al., 2005 Cytokinin oxidase regulates rice grain production. Science309:741–745.
Ballinger, D. G., and S. Benzer, 1989 Targeted gene mutations in
Drosophila. Proc. Natl. Acad. Sci. USA86:9402–9406. Bennetzen, J. L., and W. Ramakrishna, 2002 Exceptional
haplo-type variation in maize. Proc. Natl. Acad. Sci. USA 99:9093– 9095.
Botstein, D., R. L. White, M. Skolnickand R. W. Davis, 1980
Con-struction of a genetic linkage map in man using restriction frag-ment length polymorphisms. Am. J. Hum. Genet.32:314–331. Burr, B., and F. A. Burr, 1991 Recombinant inbreds for molecular
mapping in maize—theoretical and practical considerations. Trends Genet.7:55–60.
Chen, X. W., J. J. Shang, D. X. Chen, C. L. Lei, Y. Zouet al., 2006 A
B-lectin receptor kinase gene conferring rice blast resistance. Plant J.46:794–804.
Chu, H. W., Q. Qian, W. Q. Liang, C. S. Yin, H. X. Tanet al.,
2006 The floral organ number4 gene encoding a putative or-tholog of Arabidopsis CLAVATA3 regulates apical meristem size in rice. Plant Physiol.142:1039–1052.
Chu, Z. H., B. Y. Fu, H. Yang, C. G. Xu, Z. K. Liet al., 2006 Targeting
xa13, a recessive gene for bacterial blight resistance in rice. The-oret. Appl. Genet.112:455–461.
Crawford, D. C., T. Bhangale, N. Li, G. Hellenthal, M. J. Rieder
et al., 2004 Evidence for substantial fine-scale variation in recom-bination rates across the human genome. Nat. Genet.36:700– 706.
Dinka, S. J., and M. N. Raizada, 2006 Inexpensive fine mapping
and positional cloning in plants using visible, mapped trans-genes. Can. J. Bot.84:179–188.
Durrett, R. T., K. Y. Chenand S. D. Tanksley, 2002 A simple
for-mula useful for positional cloning. Genetics160:353–355. Ferreira, A., M. F.daSilva, L. Silvaand C. D. Cruz, 2006 Estimating
the effects of population size and type on the accuracy of genetic maps. Genet. Molec. Biol.29:187–192.
Fu, H. H., W. K. Park, X. H. Yan, Z. W. Zheng, B. Z. Shen et al.,
2001 The highly recombinogenic bz locus lies in an unusually gene-rich region of the maize genome. Proc. Natl. Acad. Sci. USA
98:8903–8908.
Garris, A. J., T. H. Tai, J. Coborn, S. Kresovichand S. R. McCouch,
2005 Genetic structure and diversity inOryza sativaL. Genetics
169:1631–1638.
Haga, K., M. Takano, R. Neumannand M. Iino, 2005 The rice
co-leoptile phototropism gene encoding an ortholog of Arabidopsis NPH3 is required for phototropism of coleoptiles and lateral translocation of auxin. Plant Cell17:103–115.
Haldane, J. B. S., 1919 The combination of linkage values and the
calculation of distances between the loci of linked factors. J. Genet.8:299–309.
Harushima, Y., M. Yano, P. Shomura, M. Sato, T. Shimanoet al.,
1998 A high-density rice genetic linkage map with 2275 markers using a single F-2 population. Genetics148:479–494. Hong, Z., M. Ueguchi-Tanaka, K. Umemura, S. Uozu, S. Fujioka
et al., 2003 A rice brassinosteroid-deficient mutant, ebisu dwarf (d2), is caused by a loss of function of a new member of cyto-chrome P450. Plant Cell15:2900–2910.
IRGSP, 2005 The map-based sequence of the rice genome. Nature
436:793–800.
Iyer, A. S., and S. R. McCouch, 2004 The rice bacterial blight
re-sistance gene xa5 encodes a novel form of disease rere-sistance. Mol. Plant Microbe Interact.17:1348–1354.
Komori, T., T. Yamamoto, N. Takemori, M. Kashihara, H.
Matsushimaet al., 2003 Fine genetic mapping of the nuclear
gene, Rf-1, that restores the BT-type cytoplasmic male sterility in rice (Oryza sativaL.) by PCR-based markers. Euphytica129:241– 247.
Komori, T., S. Ohta, N. Murai, Y. Takakura, Y. Kuraya et al.,
2004 Map-based cloning of a fertility restorer gene, Rf-1, in rice (Oryza sativaL.). Plant J.37:315–325.
Komorisono, M., M. Ueguchi-Tanaka, I. Aichi, Y. Hasegawa, M.
Ashikariet al., 2005 Analysis of the rice mutant dwarf and
gla-dius leaf 1. Aberrant katanin-mediated microtubule organization causes up-regulation of gibberellin biosynthetic genes indepen-dently of gibberellin signaling. Plant Physiol.138:1982–1993. Konishi, S., T. Izawa, S. Y. Lin, K. Ebana, Y. Fukutaet al., 2006 An
SNP caused loss of seed shattering during rice domestication. Sci-ence312:1392–1396.
Lenormand, T., and J. Dutheil, 2005 Recombination difference
be-tween sexes: A role for haploid selection. PLoS Biol.3:396–403. Li, D. T., L. M. Chen, L. Jiang, S. S. Zhu, Z. G. Zhaoet al., 2007 Fine
mapping of S32(t), a new gene causing hybrid embryo sac steril-ity in a Chinese landrace rice (Oryza sativaL.). Theoret. Appl. Genet.114:515–524.
Li, L. L., M. Jeanand F. Belzile, 2006 The impact of sequence
di-vergence and DNA mismatch repair on homeologous recombi-nation in Arabidopsis. Plant J.45:908–916.
Li, X. Y., Q. Qian, Z. M. Fu, Y. H. Wang, G. S. Xiong et al.,
Li, Y. H., O. Qian, Y. H. Zhou, M. X. Yan, L. Sun et al.,
2003 BRITTLE CULM1, which encodes a COBRA-like protein, affects the mechanical properties of rice plants. Plant Cell15:
2020–2031.
Liu, X. Q., L. Wang, S. Chen, F. Linand Q. H. Pan, 2005 Genetic
and physical mapping of Pi36(t), a novel rice blast resistance gene located on rice chromosome 8. Mol. Genet. Genom.274:
394–401.
Lukacsovich, T., and A. S. Waldman, 1999 Suppression of
intra-chromosomal gene conversion in mammalian cells by small de-grees of sequence divergence. Genetics151:1559–1568. Luo, A. D., Q. Qian, H. F. Yin, X. Q. Liu, C. X. Yinet al., 2006 EUI1,
encoding a putative cytochrome P450 monooxygenase, regulates internode elongation by modulating gibberellin responses in rice. Plant Cell Physiol.47:181–191.
McVean, G. A. T., S. R. Myers, S. Hunt, P. Deloukas, D. R. Bentley
et al., 2004 The fine-scale structure of recombination rate vari-ation in the human genome. Science304:581–584.
Miyoshi, K., B. O. Ahn, T. Kawakatsu, Y. Ito, J. I. Itoh et al.,
2004 PLASTOCHRON1, a timekeeper of leaf initiation in rice, encodes cytochrome P450. Proc. Natl. Acad. Sci. USA101:875– 880.
Nachman, M. W., 2002 Variation in recombination rate across the
genome: evidence and implications. Curr. Opin. Genet. Dev.
12:657–663.
Nishimura, A., M. Ashikari, S. Lin, T. Takashi, E. R. Angeleset al.,
2005 Isolation of a rice regeneration quantitative trait loci gene and its application to transformation systems. Proc. Natl. Acad. Sci. USA102:11940–11944.
Pan, G., X. Y. Zhang, K. D. Liu, J. W. Zhang, X. Z. Wu et al.,
2006 Map-based cloning of a novel rice cytochrome P450 gene CYP81A6 that confers resistance to two different classes of herbi-cides. Plant Mol. Biol.61:933–943.
Paterson, A., E. Lander, J. Hewitt, S. Peterson, S. Lincolnet al.,
1988 Resolution of quantitative traits into Mendelian factors by using a complete linkage map of restriction fragment length polymorphisms. Nature335:721–726.
Paterson, A. H., M. Freelingand T. Sasaki, 2005 Grains of
knowl-edge: genomics of model cereals. Genome Res. 15: 1643– 1650.
Qiu, S. Q., K. D. Liu, J. X. Jiang, X. Song, C. G. Xuet al., 2005
De-limitation of the rice wide compatibility gene S5(n) to a 40-kb DNA fragment. Theoret. Appl. Genet.111:1080–1086. Raizada, M. N., 2003 RescueMuprotocols for maize functional
ge-nomics. Methods Mol. Biol.236:37–58.
Ren, Z. H., J. P. Gao, L. G. Li, X. L. Cai, W. Huanget al., 2005 A rice
quantitative trait locus for salt tolerance encodes a sodium trans-porter. Nat. Genet.37:1141–1146.
Rieseberg, L. H., 2001 Chromosomal rearrangements and
specia-tion. Trends Ecol. Evol.16:351–358.
Sazuka, T., I. Aichi, T. Kawai, N. Matsuo, H. Kitano et al.,
2005 The rice mutant dwarf bamboo shoot 1: A leaky mutant of the NACK-type kinesin-like gene can initiate organ primordia but not organ development. Plant Cell Physiol.46:1934–1943. Sharma, T. R., M. S. Madhav, B. K. Singh, P. Shanker, T. K. Jana
et al., 2005 High-resolution mapping, cloning and molecular characterization of the Pi-k(h) gene of rice, which confers re-sistance to Magnaporthe grisea. Mol. Genet. Genom.274: 569– 578.
Singer, A., H. Perlman, Y. L. Yan, C. Walker, G. Corley-Smithet al.,
2002 Sex-specific recombination rates in zebrafish (Danio rerio). Genetics160:649–657.
Sun, X. L., Y. L. Cao, Z. F. Yang, C. G. Xu, X. H. Liet al., 2004 Xa26,
a gene conferring resistance toXanthomonas oryzaepv. oryzae in rice, encodes an LRR receptor kinase-like protein. Plant J.37:
517–527.
Suzaki, T., M. Sato, M. Ashikari, M. Miyoshi, Y. Nagato et al.,
2004 The gene FLORAL ORGAN NUMBER1 regulates floral meristem size in rice and encodes a leucine-rich repeat receptor kinase orthologous to Arabidopsis CLAVATA1. Development
131:5649–5657.
Takahashi, Y., A. Shomura, T. Sasakiand M. Yano, 2001 Hd6, a
rice quantitative trait locus involved in photoperiod sensitivity, encodes the alpha subunit of protein kinase CK2. Proc. Natl. Acad. Sci. USA98:7922–7927.
Tanabe, S., M. Ashikari, S. Fujioka, S. Takatsuto, S. Yoshidaet al.,
2005 A novel cytochrome P450 is implicated in brassinosteroid biosynthesis via the characterization of a rice dwarf mutant, dwarf11, with reduced seed length. Plant Cell17:776–790. Tang, T., J. Lu, J. Huang, J. He, S. R. McCouchet al., 2006 Genomic
variation in rice: genesis of highly polymorphic linkage blocks during domestication. PLoS Genet.2:e199.
Tanksley, S. D., M. W. Ganaland G. B. Martin, 1995
Chromo-some landing: a paradigm for map-based gene cloning in plants with large genomes. Trends Genet.11:63–68.
Ueda, T., T. Sato, J. Hidema, T. Hirouchi, K. Yamamotoet al.,
2005 qUVR-10, a major quantitative trait locus for ultraviolet-B resistance in rice, encodes cyclobutane pyrimidine dimer pho-tolyase. Genetics171:1941–1950.
Ueguchi-Tanaka, M., M. Ashikari, M. Nakajima, H. Itoh, E. Katoh
et al., 2005 GIBBERELLIN INSENSITIVE DWARF1 encodes a soluble receptor for gibberellin. Nature437:693–698.
vanOs, H., S. Andrzejewski, E. Bakker, I. Barrena, G. J. Bryan
et al., 2006 Construction of a 10,000-marker ultradense genetic recombination map of potato: Providing a framework for accel-erated gene isolation and a genomewide physical map. Genetics
173:1075–1087.
Wan, X. Y., J. M. Wan, L. Jiang, J. K. Wang, H. Q. Zhai et al.,
2006 QTL analysis for rice grain length and fine mapping of an identified QTL with stable and major effects. Theoret. Appl. Genet.112:1258–1270.
Wang, G. W., Y. Q. He, C. G. Xuand Q. F. Zhang, 2006 Fine
map-ping of f5-Du, a gene conferring wide-compatibility for pollen fertility in inter-subspecific hybrids of rice (Oryza sativaL.). The-oret. Appl. Genet.112:382–387.
Wang, Q. H., and H. K. Dooner, 2006 Remarkable variation in
maize genome structure inferred from haplotype diversity at the bz locus. Proc. Natl. Acad. Sci. USA103:17644–17649. Wang, Z. X., M. Yano, U. Yamanouchi, M. Iwamoto, L. Monnaet al.,
1999 The Pib gene for rice blast resistance belongs to the nu-cleotide binding and leucine-rich repeat class of plant disease re-sistance genes. Plant J.19:55–64.
Wu, J. Z., H. Mizuno, M. Hayashi-Tsugane, Y. Ito, Y. Chidenet al.,
2003 Physical maps and recombination frequency of six rice chromosomes. Plant J.36:720–730.
Wu, T. D., and C. K. Watanabe, 2005 GMAP: a genomic mapping
and alignment program for mRNA and EST sequences. Bioinfor-matics21:1859–1875.
Yamanouchi, U., M. Yano, H. X. Lin, M. Ashikariand K. Yamada,
2002 A rice spotted leaf gene, SpI7, encodes a heat stress tran-scription factor protein. Proc. Natl. Acad. Sci. USA99:7530– 7535.
Yang, H. Y., A. Q. You, Z. F. Yang, F. Zhang, R. F. He et al.,
2004 High-resolution genetic mapping at the Bph15 locus for brown planthopper resistance in rice (Oryza sativaL.). The-oret. Appl.Genet.110:182–191.
Yang, Z., X. Sun, S. Wangand Q. Zhang, 2003 Genetic and physical
mapping of a new gene for bacterial blight resistance in rice. The-oret. Appl. Genet.106:1467–1472.
Yano, M., Y. Katayose, M. Ashikari, U. Yamanouchi, L. Monnaet al.,
2000 Hd1, a major photoperiod sensitivity quantitative trait lo-cus in rice, is closely related to the Arabidopsis flowering time gene CONSTANS. Plant Cell12:2473–2483.
Yoshimura, S., U. Yamanouchi, Y. Katayose, S. Toki, Z. X. Wang
et al., 1998 Expression of Xa1, a bacterial blight-resistance gene in rice, is induced by bacterial inoculation. Proc. Natl. Acad. Sci. USA95:1663–1668.
Yu, J., J. Wang, W. Lin, S. Liand H. E. A. Li, 2005 The genomes of
Oryza sativa: a history of duplications. PLoS Biol3:e38. Yuan, Q. P., O. Y. Shu, A. H. Wang, W. Zhu, R. Maitiet al., 2005 The
Institute for Genomic Research Osa1 rice genome annotation da-tabase. Plant Physiol.138:17–26.
Zeng, L. R., S. H. Qu, A. Bordeos, C. W. Yang, M. Baraoidanet al.,
2004 Spotted leaf11, a negative regulator of plant cell death and defense, encodes a U-box/armadillo repeat protein en-dowed with E3 ubiquitin ligase activity. Plant Cell16:2795–2808. Zhang, H. T., J. J. Li, J. H. Yoo, S. C. Yoo, S. H. Choet al., 2006 Rice
Zhang, K. W., Q. Qian, Z. J. Huang, Y. Q. Wang, M. Li et al.,
2006 GOLD HULL AND INTERNODE2 encodes a primarily multifunctional cinnamyl-alcohol dehydrogenase in rice1. Plant Physiol.140:972–983.
Zhu, Y. Y., T. Nomura, Y. H. Xu, Y. Y. Zhang, Y. Peng et al.,
2006 ELONGATED UPPERMOST INTERNODE encodes a cy-tochrome P450 monooxygenase that epoxidizes gibberellins in a novel deactivation reaction in rice. Plant Cell18:442–456. Zou, J. H., Z. X. Chen, S. Y. Zhang, W. P. Zhang, G. H. Jianget al.,
2005 Characterizations and fine mapping of a mutant gene for
high tillering and dwarf in rice (Oryza sativaL.). Planta222:604– 612.
Zou, J. H., S. Y. Zhang, W. P. Zhang, G. Li, Z. X. Chen et al.,
2006 The rice HIGH-TILLERING DWARF1 encoding an ortho-log of Arabidopsis MAX3 is required for negative regulation of the outgrowth of axillary buds. Plant J.48:687–696.