1556-6811/07/$08.00
⫹
0
doi:10.1128/CVI.00071-07
Copyright © 2007, American Society for Microbiology. All Rights Reserved.
Detection of
Histoplasma
Antigen by a Quantitative Enzyme
Immunoassay
䌤
Patricia A. Connolly,* Michelle M. Durkin, Ann M. LeMonte, Emily J. Hackett, and L. Joseph Wheat
MiraVista Diagnostics and Mirabella Technologies, Indianapolis, Indiana
Received 7 February 2007/Returned for modification 24 May 2007/Accepted 14 September 2007
The second-generation
Histoplasma
antigen immunoassay is semiquantitative, expressing results as a
comparison to a negative control, which requires repeat testing of the prior specimen with the current
specimen to accurately determine a change in antigen. Reporting results in this manner often is confusing
to the ordering physician and laboratory. Development of a quantitative assay could improve accuracy,
reduce interassay variability, and eliminate the need to test the prior sample with the current sample in
the same assay. Calibrators with known concentrations of
Histoplasma
antigen were used to quantitate
antigen in specimens from patients with histoplasmosis and from controls. Samples from cases of
disseminated histoplasmosis or other mycoses and controls were tested to evaluate the performance
characteristics of the quantitative assay. Paired specimens were evaluated to determine if quantitation
eliminated the need to test the current and prior specimens in the same assay to assess a change in
antigen. The sensitivity in samples from patients with AIDS and disseminated histoplasmosis was 100%
in urine and 92.3% in serum. Cross-reactions occurred in 70% of other endemic mycoses, but not in
aspergillosis. Specificity was 99% in controls with community-acquired pneumonia, medical conditions in
which histoplasmosis was excluded, or healthy subjects. A change in antigen level categorized as an
increase, no change, or decrease based on antigen units determined in the same assay agreed closely with
the category of change in nanograms/milliliter determined from testing current and prior specimens in
different assays. Sensitivity, specificity, and interassay precision are excellent in the new third-generation
quantitative
Histoplasma
antigen immunoassay.
Antigen detection is a useful method for the diagnosis of
histoplasmosis (8). Until now, antigen results have been
ex-pressed semiquantitatively as antigen units (calculated as
en-zyme immunoassay [EIA] units [EU]) based upon comparison
to a negative control. Antigen levels decline with effective
therapy (9, 12) and increase with relapse (13), providing a
useful method for monitoring treatment. Based upon analysis
of the course of antigen clearance during treatment of
his-toplasmosis in patients with AIDS (4, 6, 7), a
ⱖ
4-EU increase
in antigen was chosen as evidence suggesting a relapse of
histoplasmosis. In that evaluation, the change in antigen units
between current and prior specimens tested concurrently
rarely exceeded 4 EU in patients who did not relapse clinically
(unpublished observation).
Due to interassay variability, prior specimens have been
tested simultaneously with current specimens to accurately
as-sess changes in antigen levels. Test reports including current
and prior results often are confusing, however, and do not
always reach the ordering physician. In this report, a method
for quantitation of
Histoplasma capsulatum
antigen is
de-scribed, and its performance characteristics, including
accu-racy, specificity, sensitivity in patients with AIDS and
dissem-inated histoplasmosis, and interassay precision, are determined
along with its potential usefulness for monitoring therapy.
MATERIALS AND METHODS
Preparation of purifiedHistoplasmagalactomannan.Galactomannan was pu-rified fromHistoplasmayeast by following published methods (1). Briefly, galac-tomannan was extracted fromH. capsulatumyeast cells with 0.25 M sodium hydroxide and precipitated with 3 volumes of absolute ethanol. The ethanol precipitate was further purified by concanavalin A chromatography, followed by Sepharose CL-6B size-exclusion and DEAE ion-exchange chromatographies. The resulting galactomannan was studied using gas chromatography/mass spec-trometry for glycosyl composition analysis, and both one-dimensional and two-dimensional nuclear magnetic resonances were used to measure carbon shifts; terminal (136)-␣-D-galactofuranose was identified in the major portion of the
Histoplasmagalactomannan, the characterization and structure of which have been published previously (L. J. Wheat, U.S. patent application 20,070,020,711). Preparation of urine calibrators.Antigen calibrators were prepared from a pool of urine specimens from patients with antigen results above 10 EU by the second-generation assay. Dilutions of the urine pool were prepared, and the concentration ofH. capsulatumgalactomannan antigen in those dilutions was determined by comparing them to a standard curve of the galactomannan purified from the yeast as described above. Final calibrators have been se-lected at the following concentrations: 39, 28, 19, 14, 10, 6, 3.4, 1.7, and 0.6 ng/ml.
Clinical samples.Specimens used in this analysis were retrieved from those stored frozen at MiraVista Diagnostics. Serum and urine specimens obtained at baseline or treatment week 1 or 2 that were collected from AIDS patients who underwent treatment for disseminated histoplasmosis with fluconazole were used to determine the sensitivity of the new assay in this population (7). These samples, from histoplasmosis cases in patients with AIDS used in the receiving operator characteristic (ROC) curve analysis, were obtained through a clinical trial that was approved by the institution’s institutional review board. Addition-ally, 228 serum- or urine-paired samples from 92 patients, including 20 patients from the above-described trial who were known to have relapsed and 72 with multiple positive urine specimens previously submitted forHistoplasmaantigen testing at MiraVista Diagnostics, were tested twice on different days, and results were calculated as EU using the cutoff value or as nanograms/milliliter by extrapolation from the standard curve. These sample pairs were chosen to in-clude a full spectrum of antigen levels and changes in levels between current and prior specimen pairs, including pairs showing an increase in antigen of at least 4
* Corresponding author. Mailing address: MiraVista Diagnostics,
4444 Decatur Blvd., Indianapolis, IN 46241. Phone: (317) 856-2681,
ext. 451. Fax: (317) 856-3685. E-mail: pconnolly@miravistalabs.com.
䌤
Published ahead of print on 3 October 2007.
1587
on August 17, 2020 by guest
http://cvi.asm.org/
EU, a decrease of at least 4 EU, or no change. The 4-EU threshold was based upon an analysis of changes in antigen levels during successful suppressive therapy for histoplasmosis (4), in which increases ofⱖ4 EU were rare, and was used as a criterion for relapse in a study of treatment withdrawal in patients with AIDS who achieved immune reconstitution (3). Controls included patients with other endemic mycoses (blastomycosis, 10 patients; coccidioidomycosis, 10 pa-tients; paracoccidioidomycosis, 5 papa-tients; and penicilliosis marneffei, 5 patients), patients with aspergillosis withAspergillus fumigatusgalactomannan antigenemia (n⫽9), patients with mycoplasma pneumonia (n⫽25),H. capsulatum -antigen-negative patients with other diseases (n⫽25), and healthy subjects (n⫽25 urine, 25 sera). Retrieval of clinical data on the patients who had a negativeH. capsulatumantigen test and who were later determined to have other diseases was conducted under an institutional-review-board-approved protocol, as was the collection of samples from patients withMycoplasmapneumonia. For all clinical samples included in this analysis, results were unlinked to patient iden-tifiers or current procedural terminology codes and were not made available to the ordering physicians for use in patient care.
H. capsulatumsecond-generation antigen assay.TheH. capsulatum second-generation antigen assay is modified (10) from the original EIA (2). In brief, the test is a sandwich EIA using microplates coated with polyclonal rabbit
anti-Histoplasmaantibodies (capture antibody). Patient specimens and controls are incubated in the precoated plates, permitting binding of antigen to the capture antibody. Bound antigen then is detected with a biotinylated detector antibody, followed by detection with streptavidin horseradish peroxidase and tetramethyl-benzidine. The detector antibody has been modified (10) to reduce false-positive results caused by anti-rabbit antibodies (11). Results are calculated by establish-ing a cutoff value for positivity that is a function of the mean negative control values. Individual specimen results are divided by that cutoff to generate EU, and EU ofⱖ1.0 are considered positive.
For quantitation, the antigen content of the assay calibrators was determined by comparison to reference standards containing known concentrations ofH. capsulatumgalactomannan. The optimal antigen concentrations for the calibra-tors, which were calculated using a four-parameter standard curve fit, were determined to range from 0.6 to 39 ng/ml. Results were classified as positive or negative as described above, using the cutoff value for positivity. Results for positive specimens were determined by extrapolation from the calibration curve and were expressed in nanograms/milliliter. Specimens with optical density (OD) results that were greater than or equal to the cutoff for positivity but that were less than the 0.6-ng/ml standard were reported as being “positive,⬍0.6 ng/ml,” and those with results exceeding the 39-ng/ml standard were reported as being “positive,⬎39 ng/ml.” Samples with OD values less than the cutoff for positivity were reported as “none detected.”
Statistical analysis.ROC curve analysis was performed to determine the cutoff for positivity that would give the optimal sensitivity and specificity and to calculate positive and negative predictive values and likelihood ratios. Compar-isons of changes in antigen in paired samples, as calculated using the semiquan-titative or quansemiquan-titative assay methods, were evaluated by linear regression anal-ysis. To test the hypothesis that quantitation eliminated the need to include the prior specimen in the same assay, changes in antigen levels determined using current and prior specimen pair results tested simultaneously were compared to those using current and prior results from different assays.
RESULTS
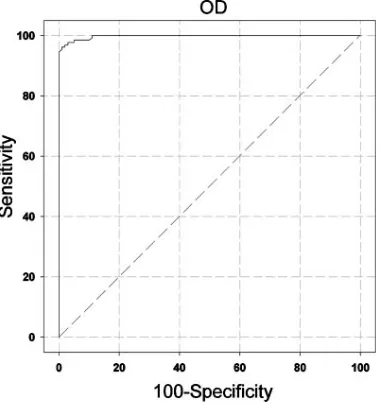
ROC analysis.
Serum and urine specimens (
n
⫽
130) from
65 cases of disseminated histoplasmosis and 100 controls
with-out fungal infection were tested simultaneously. ROC analysis
identified the optimal cutoff for positivity to be the optical
density that was equal to three times the assay negative control
(Fig. 1). At this cutoff, using a 10% disease prevalence, the
sensitivity was 95.4%, the specificity was 99.0%, the positive
predictive value was 91.4%, the negative predictive value was
99.6%, and the area under the curve was 0.997. The positive
likelihood ratio was 95.4, and the negative likelihood ratio was
0.05.
Results for histoplasmosis cases and controls using the
ROC-defined cutoff.
The sensitivity was 100% in urine samples
and 92.3% in serum samples from the disseminated
histoplas-mosis cases (Fig. 2). Cross-reactions were noted in 21 of 30
(70%) controls with other endemic mycoses (blastomycosis,
7/10 patients; coccidioidomycosis, 6/10 patients;
paracoccid-ioidomycosis, 4/5 patients; and penicilliosis marneffei, 4/5
pa-tients) but not with aspergillosis. The specificity in nonfungal
controls was 99%. Five clinical specimens with results of
⬎
39
ng/ml of antigen were diluted 1:500 and retested.
Multiplica-tion of the nanograms/milliliter at that diluMultiplica-tion by 500 showed
that the antigen concentration ranged from 729 to
⬎
11,480
ng/ml. Interassay agreement for all specimens tested three
separate times was evaluated by comparing the coefficients of
variation. The mean coefficient of variation was 24.01% for
results determined as EU, and that for results calculated as
nanograms/milliliter was 11.19% (
P
⬍
0.0001).
Interassay agreement of changes in nanograms/milliliter in
histoplasmosis cases with paired current and prior specimens.
Paired current and prior specimens from patients with
his-toplasmosis were tested three times in separate assays.
Changes in antigen levels between paired samples showed
ex-cellent agreement when calculated as nanograms/milliliter on
the same day (from the same assay) as opposed to those
cal-culated across different days (from different assays) (Fig. 3).
Changes in antigen concentration in nanograms/milliliter
between a current and prior specimen calculated from
sepa-rate assays according to category of change in EU in the same
assay.
The changes in antigen levels from sequential samples
from individual patients were determined by testing all samples
simultaneously and repeating that for a total of three tests. The
same-day test results of those samples were calculated as EU,
and antigen level changes that were proven reproducible were
used to categorize the change in EU as
ⱖ
4-EU increases,
ⱖ
4-EU decreases, or no change (
⬍
4-EU increase or
de-crease). Next, the change in antigen concentration, calculated
quantitatively as nanograms/milliliter, for the current specimen
compared to the antigen concentrations of prior specimens
FIG. 1. ROC curve depicting assay sensitivity and specificity, based
upon testing serum and urine specimens from 65 patients with AIDS
and disseminated histoplasmosis and 100 controls with mycoplasma
pneumonia, other conditions for which histoplasmosis was excluded,
and healthy subjects. With a cutoff OD of 0.065 (three times the mean
normal), the sensitivity is 95.4% and the specificity is 99.0%.
on August 17, 2020 by guest
http://cvi.asm.org/
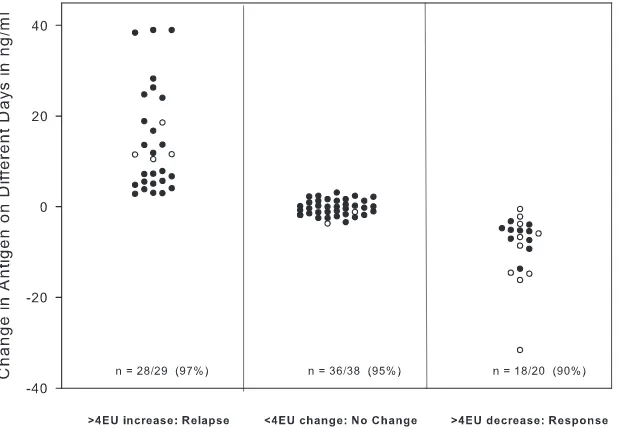
that were determined on different days (separate assays) was
plotted according to the category determined from the change
in EU that was determined on the same day (in the same assay)
(Fig. 4). A
⬎
3-ng/ml increase for specimens with results below
20 ng/ml (
n
⫽
25) and
⬎
15% for those that were
ⱖ
20 ng/ml (
n
⫽
4) occurred in 97% of cases with a
ⱖ
4-EU increase, while a
similar decrease in nanograms/milliliter occurred in 90% of
cases with a
ⱖ
4-EU decrease (
n
⫽
10 with results of
⬍
20
ng/ml, and
n
⫽
10 with results of
ⱖ
20 ng/ml). No significant
change in nanograms/milliliter occurred in 95% of cases
with-out a
ⱖ
4-EU change.
DISCUSSION
The sensitivity of the new assay was 100% for antigenuria
and 92.3% for antigenemia in AIDS patients with disseminated
histoplasmosis, higher than that previously reported (14). The
specificity was 99%. Assuming the prevalence of disseminated
histoplasmosis is about 10%, based upon the frequency of
positive antigen results in new specimens tested at MiraVista
Diagnostics, the positive predictive value is 91.4% and the
negative predictive value is 99.5%. Studies are needed to assess
the sensitivity in other clinical types of histoplasmosis, as well
as in disseminated disease in patients with immunosuppressive
disorders other than AIDS or with no underlying
immunosup-pression. Cross-reactions were noted for patients with other
endemic mycoses, including coccidioidomycosis.
Quantitation eliminated the need to retest the prior
speci-men with the current specispeci-men in the same assay to accurately
assess changes in the antigen level. Change in ng/ml
deter-mined in different assays correlated well with change in antigen
EU measured in the same assay. Furthermore, the category of
change (increase, no change, decrease) in ng/ml determined in
different assays showed excellent agreement with the category
of change in EU determined in the same assay. A
⬎
3-ng/ml
change for specimens with results below 20 ng/ml and a
⬎
15% change for those of
ⱖ
20 ng/ml correlated with a
ⱖ
4-EU
change in more than 90% of cases: 97% for an increase in
FIG. 2. Sensitivity in disseminated histoplasmosis in samples from patients with AIDS and specificity in samples from controls. The antigen
concentration, in nanograms/milliliter, is shown on the vertical axis. The sensitivity in urine was 100%, and in serum it was 92.3%; the specificity
was 99.0% in controls without fungal infections.
FIG. 3. Interassay agreement of changes in nanograms/milliliter in
histoplasmosis cases with paired current and prior specimens,
compar-ing results determined in the same assay (same day) with those
deter-mined in different assays (different days). Data below the 0 value
represent pairs in which the concentration decreased in the current
specimen compared to that of the prior specimen, and data above 0
represent pairs in which the concentration increases in the current
specimen compared to that of the prior specimen.
on August 17, 2020 by guest
http://cvi.asm.org/
concentration and 90% for a decrease. Agreement for current/
prior pairs showing no change,
⬍
4 EU, was 95%.
In the specimens obtained at baseline or week 1 or 2 of
treatment with fluconazole from AIDS patients with
dissemi-nated histoplasmosis, the antigen concentration was
⬎
39 ng/ml
in urine in 47.7% of cases and was
⬎
39 ng/ml in serum in
29.2% of cases. Changes in antigen concentration cannot be
evaluated in specimens for which results exceed the highest
point of calibration in the quantitative assay. Upon dilution,
for specimens with results of
⬎
39 ng/ml, the antigen
concen-tration was estimated to range from almost 1,000 to more than
10,000 ng/ml. When antigenuria exceeds the highest standard
and measuring changes in antigen levels to assess response to
therapy may not be possible, monitoring antigenemia is
rec-ommended. Once antigenemia has cleared, antigenuria should
be monitored.
Persistent low-level antigenuria (
⬍
4 EU), however, may not
represent active infection or predict relapse after stopping
therapy. In the treatment withdrawal study, low-level
antigen-uria was present in 19% of cases when treatment was stopped,
and none relapsed (3). Antigenemia was present in none.
Stud-ies are needed to determine if persistent antigenuria in the
quantitative assay correlates with a risk for relapse after
ap-propriate courses of treatment are discontinued.
In conclusion, these studies demonstrate that the method
improvements that allow for the calculation of antigen results
quantitatively have resulted in a test system superior to that of
antigen results expressed as EU. The quantitative
third-gener-ation assay demonstrates excellent accuracy and precision,
sup-porting the aim of no longer needing to test prior specimens
alongside the current sample when using the test to monitor
therapy.
ACKNOWLEDGMENTS
We thank Chadi Hage and Deanna Fuller, Indiana University
School of Medicine, for providing information about the clinical
con-trols in which histoplasmosis was excluded. We also thank James
Sum-mersgill, University of Louisville School of Medicine, for providing the
Mycoplasma
pneumonia controls.
We disclose that all of the authors are employees of MiraVista
Diagnostics and MiraBella Technologies, the company that developed
and performs
Histoplasma
antigen testing.
The samples from histoplasmosis cases in patients with AIDS used
in the ROC curve analysis were obtained through a clinical trial that
was sponsored by The AIDS Clinical Trials Group and Mycoses Study
Group of the National Institute of Allergy and Infectious Diseases,
National Institutes of Health, under contract numbers AI25859 and
NO-1-AI-65296.
REFERENCES
1.Azuma, I., F. Kanetsuna, Y. Tanaka, Y. Yamamura, and L. M. Carbonell. 1974. Chemical and immunological properties of galactomannans obtained from Histoplasma duboisii, Histoplasma capsulatum, Paracoccidioides brasiliensis and Blastomyces dermatitidis. Mycopathol. Mycol. Appl.54:111– 125.
2.Durkin, M. M., P. A. Connolly, and L. J. Wheat.1997. Comparison of radioimmunoassay and enzyme-linked immunoassay methods for detection ofHistoplasma capsulatumvar.capsulatumantigen. J. Clin. Microbiol.35: 2252–2255.
3.Goldman, M., R. Zackin, C. J. Fichtenbaum, D. J. Skiest, S. L. Koletar, R. Hafner, L. J. Wheat, P. M. Nyangweso, C. T. Yiannoutsos, C. T. Schnizlein-Bick, S. Owens, and J. A. Aberg.2004. Safety of discontinuation of mainte-nance therapy for disseminated histoplasmosis after immunologic response to antiretroviral therapy. Clin. Infect. Dis.38:1485–1489.
4.Hecht, F. M., J. Wheat, A. H. Korzun, R. Hafner, K. J. Skahan, R. Larsen, M. T. Limjoco, M. Simpson, D. Schneider, M. C. Keefer, R. Clark, K. K. Lai, J. M. Jacobson, K. Squires, J. A. Bartlett, and W. Powderly.1997. Itra-conazole maintenance treatment for histoplasmosis in AIDS: a prospective, multicenter trial. J. Acquir. Immun. Defic. Syndr. Hum. Retrovir.16:100– 107.
5. Reference deleted.
6.Wheat, J., R. Hafner, A. H. Korzun, M. T. Limjoco, P. Spencer, R. A. Larsen, F. M. Hecht, W. Powderly, et al.1995. Itraconazole treatment of
dissemi-FIG. 4. Changes in antigen concentration between a current and prior specimen first categorized according to the change in antigen EU in the
same assay and then plotted with the change in antigen concentration calculated quantitatively as nanograms/milliliter from separate days’ assays.
The number/total (percent) shown on the column designates agreement between the category of change in nanograms/milliliter as determined
from different days’ assays with change in antigen EU determined from the same assay. For the determination of agreement, a significant change
in nanograms/milliliter was defined as
⬎
3 ng/ml when the concentration in the prior specimen was
⬍
20 ng/ml (designated by closed circles on the
graph) and
⬎
15% when the concentration in the prior specimen was
ⱖ
20 ng/ml (open circles).
on August 17, 2020 by guest
http://cvi.asm.org/
nated histoplasmosis in patients with the acquired immunodeficiency syn-drome. Am. J. Med.98:336–342.
7.Wheat, J., S. MaWhinney, R. Hafner, D. McKinsey, D. Chen, A. Korzun, K. J. Shakan, P. Johnson, R. Hamill, D. Bamberger, P. Pappas, J. Stansell, S. Koletar, K. Squires, R. A. Larsen, T. Cheung, N. Hyslop, K. K. Lai, D. Schneider, C. Kauffman, M. Saag, W. Dismukes, W. Powderly, et al.1997. Treatment of histoplasmosis with fluconazole in patients with acquired im-munodeficiency syndrome. Am. J. Med.103:223–232.
8.Wheat, L. J.2003. Current diagnosis of histoplasmosis. Trends Microbiol. 11:488–494.
9.Wheat, L. J., G. Cloud, P. C. Johnson, P. Connolly, M. Goldman, A. Le Monte, D. E. Fuller, T. E. Davis, and R. Hafner.2001. Clearance of fungal burden during treatment of disseminated histoplasmosis with liposomal am-photericin B versus itraconazole. Antimicrob. Agents Chemother.45:2354– 2357.
10.Wheat, L. J., P. Connolly, M. Durkin, B. K. Book, and M. D. Pescovitz.2006. Elimination of false-positive Histoplasma antigenemia caused by human
anti-rabbit antibodies in the second-generation Histoplasma antigen assay. Transplant. Infect. Dis.8:219–221.
11.Wheat, L. J., P. Connolly, M. Durkin, B. K. Book, A. J. Tector, J. Fridell, and M. D. Pescovitz.2004. False-positive Histoplasma antigenemia caused by antithymocyte globulin antibodies. Transplant. Infect. Dis.6:23–27. 12.Wheat, L. J., P. Connolly, N. Haddad, A. Le Monte, E. Brizendine, and R.
Hafner.2002. Antigen clearance during treatment of disseminated histoplas-mosis with itraconazole versus fluconazole in patients with AIDS. Antimi-crob. Agents Chemother.46:248–250.
13.Wheat, L. J., P. Connolly-Stringfield, R. Blair, K. Connolly, T. Garringer, and B. P. Katz.1991. Histoplasmosis relapse in patients with AIDS: detec-tion using Histoplasma capsulatum variety capsulatum antigen levels. Ann. Intern. Med.115:936–941.
14.Williams, B., M. Fojtasek, P. Connolly-Stringfield, and J. Wheat.1994. Diagnosis of histoplasmosis by antigen detection during an outbreak in Indianapolis, Ind. Arch. Pathol. Lab. Med.118:1205–1208.