1
DOI: 10.5897/JAHR2018.0457Article Number: FD0C94F56680 ISSN 2141-2359
Copyright © 2018
Author(s) retain the copyright of this article http://www.academicjournals.org/JAHR
Journal of AIDS and HIV Research
Full Length Research Paper
A prospective study on the changes of clinical values in
HIV-Infected patients attending Kenyatta National
Hospital Comprehensive Care Center
Jackson Ireri Mrama
1*, Ngeranwa, J. N.
1, Mburu, D. N.
1, Jaoko, W.
2and
Sekadde-Kigondu C.B.
31
Department of Biochemistry and Biotechnology, Kenyatta University, Nairobi, Kenya.
2
Department of Medical Microbiology, University of Nairobi, Kenya.
3
Department of Human Pathology, University of Nairobi, Kenya.
Received 9 January, 2018; Accepted 1 March, 2018
Changes in serum levels of aspartate aminotransferase (AST), alanine aminotransferase (ALT), alkaline phosphatase (ALP), gamma-glutamyl transferase (G-GT), total protein (TP), albumin (ALB), total bilirubin (T. Bil), direct bilirubin (D. Bil) are assayed to monitor liver function; while those of creatinine (CRT) and urea (UR) are for kidney functions. These two organs produce hepcidin and erythropoietins, respectively that play major roles in haemopoiesis and so may be involved in HIV- associated anemia. Anemia occurs in over 70% of HIV-infected. The objective of this study was to monitor liver and kidney derangements in HIV based on CD4+ cell levels for 6 months. This was a longitudinal descriptive study conducted at Kenyatta National Hospital Comprehensive Care Centre and involved: 184 HIV seropositive and 101 HIV seronegative blood donors as a comparative group. The comparative group demonstrated significantly higher T.Bil and D.Bil mean values in males than in females. Increases in each of: G-GT, T. Bil, D. Bil, AST, ALT and CRT above the upper limit of the control were observed. Increases in G-GT were highest in CD4+ above 200 cells /mm3; decreases in the levels of ALP and ALB were lowest in CD4+ < 200 cells / mm3 group. Increases in G-GT with decreases in ALP were possibly due to cardiac-related disorders. Serum levels of AST, ALT and CRT are not affected by CD4+ levels. Decreases in the levels of ALB in CD4+ < 200 cells/mm3 group were thought to be partly due to: anemia, malnutrition or hypercatabolism. Hypoalbuminemia may result in altered albumin: globulin ratio. Determinations of: albumin: globulin ratio, gender-based reference ranges for T. Bil and D. Bil, hepcidin and erythropoietin are recommended.
Key words: Study, clinical values, HIV infection.
INTRODUCTION
Biochemical parameters are routinely evaluated in the laboratory to detect liver and kidney derangements. These two organs play a major role in erythropoiesis by
producing hepcidin and erythropoietin respectively (Ganz and Nemeth, 2012; Amanzada et al., 2011; Beverborg et al., 2015). Inefficiencies of these organs will be key to anemia development. Anemia is the commonest
hematological abnormality in immunodeficiency virus (HIV) infection with as many as 70 - 80% of the patients
2
alanine aminotransferase, alkaline phosphatase, gamma - glutamyl transferase, total protein, albumin, total bilirubin and direct bilirubin are determined. Liver disease is the most common non-AIDS related cause of death among HIV-infected patients, accounting for 14-18% of all deaths and up to 90% of patients with AIDS have had abnormalities of the liver-associated enzymes (Poles et al., 1997). Increases in ALT and AST is indicative of hepatocellular injury (Mata-Marin et al., 2009; Clark et al., 2003). A rise in the levels of both ALP and GGT indicate cholestatic disease (Patil et al., 2013). Elevation of ALP occurs as a result of obstructed bile flow of either the intra - hepatic or extra - hepatic biliary tree (Patil et al., 2013). Serum levels of GGT is associated with morbidity, including cardiovascular disease independent of liver disease or alcohol consumption (Rahman et al., 2014; Jiang et al., 2013). Decreased levels of ALB have been reported in HIV infected antiretroviral therapy (ART)-naïve patients (Dusingize et al., 2015). Albumin is a measure of hepatic synthetic function with albumin levels decreased in chronic liver disease (Limdi and Hyde, 2003). It has been previously reported that both hypoalbuminemia and hyperproteinemia are associated with a polyclonal gamma-globulinemia in HIV seropositive patients (Hunziker et al., 2003). Bilirubin, a yellow compound arising from haem iron, is used either to monitor for toxicity to ARV or assess liver function where viral hepatitis is a co-infection. Kidney functional state is assessed by measuring serum levels of urea and creatinine. Kidney disease has been reported as an important complication of human immunodeficiency virus (HIV) infection that may be associated with progressing to AIDS and death (Agbaji et al., 2011; Scarpino et al., 2015). Many reports of the biochemical changes in HIV infection are derived from populations in industrialized nations.In this study changes in clinical parameters were done to evaluate liver and kidney derangements in HIV – infected adults grouped into CD4+ cell counts of: < 200 -, 200-499 - and ≥ 500 cells/mm3 over six months’ period.
MATERIALS AND METHODS
The study protocol was approved by Kenyatta National Hospital/ University of Nairobi (KNH/UoN) ethics and research committee. The study was conducted between 2013 and 2016 period and the study population was comprised of: HIV seropositive subjects on various ARV regimens for periods exceeding six months, HIV ARV – naïve subjects and HIV seronegative blood donors (comparative group). In total the subjects were 184 and the blood donors were 101. All the participants were adults aged between 18 and 60 years and were recruited consecutively as they consented. Clinical and social demographic characteristics of the study participants were
Mrama et al. 57
recorded. The study subjects were grouped into CD4+ < 200 (n = 22) -, 200-499 (n = 86) – and ≥ 500 (n = 76) cells/mm3 groups
based on the CD4+ counts in the blood sample at recruitment. The CD4+ groups were further grouped into males and females: CD4+ < 200 (13 males and 9 females) -, 200-499 (43 males and 43 females) - and ≥ 500 (9 males and 67 females) cells/mm3
groups. A total of 5 ml of blood samples were obtained from each study subject at recruitment (F0), after 3 months (F1) and after 6 months
(F2) during the study; while blood sample were obtained from the
comparative group at the recruitment stage only. The blood samples were assigned study numbers, divided into two milliliters and three milliliters portions and dispensed into EDTA vacutainers and plain tubes respectively. The EDTA samples were used for CD4+ cell counts; while sera from blood samples in plain vacutainers were used for: aspartate aminotransferase (AST), alanine aminotransferase (ALT), alkaline phosphatase (ALP), gamma - glutamyl transferase (G-GT), total protein (TP), albumin (ALB), total bilirubin (T. Bil), direct bilirubin (D. Bil), creatinine (CRT) and urea (UR). The CD4+ counts were done on a FACS CALIBUR® machine that used commercial controls set at zero, low, medium and high concentrations for quality control. Biochemistry parameters were measured using a fully automated HUMASTAR: 600 ® analyzer using normal and pathological commercial controls for quality control. The reagents employed for the analyses were Human ® products from Germany procured through the local agent, CEM LABs limited. Parameters whose mean demonstrated significant differences after comparing male and female mean values in the comparative group, were also analyzed under males and females separately in HIV seropositive respondents. The results of the tests were recorded as raw data in laboratory note book, entered into excel computer data base then after cleaning and verification transported into statistical package for the social sciences (SPSS) version 21 and analysis done there-in. Means, standard error of the mean, minimum and maximum ranges were determined. Comparison of the means between males and females; between HIV negative and HIV positive respondents was done using student - t test. HIV negative respondents’ 95% confidence interval (C.I) was used as reference ranges to determine increased or decreased parameters of HIV positive respondents.
RESULTS
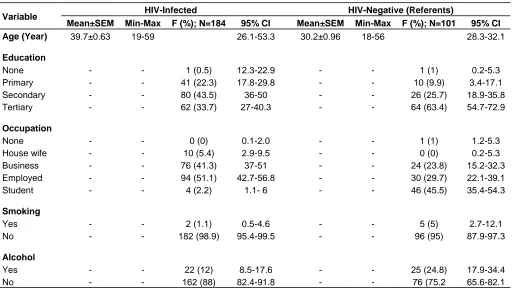
Demographic characteristics of the respondents are presented in Table 1. For the comparative group, the mean age was 30.2 years, 74.3% were male, 63.4% had tertiary education, 45.5% were students, 95% were non-smokers and 75.2% did not consume alcohol. For the HIV positive group, the mean age was 39.7, 64.7% were females, 43.5% had secondary education, 51.1% were employed, 98.9 % were non-smokers and 88% were teetotaler. The CD4+ cell levels for all the respondents were determined at the commencement of the study and also on the third and sixth months, for the HIV infected individuals. Baseline data indicated that the CD4+ counts for the HIV negative control group averaged 780.9 ±31.2 cells /mm3 while that of the HIV positive individuals was *Corresponding author. E-mail: jacksonirerimrama@gmail.com.
3
Table 1. Demographic characteristics of the respondents.
Variable HIV-Infected HIV-Negative (Referents)
Mean±SEM Min-Max F (%); N=184 95% CI Mean±SEM Min-Max F (%); N=101 95% CI
Age (Year) 39.7±0.63 19-59 26.1-53.3 30.2±0.96 18-56 28.3-32.1
Education
None - - 1 (0.5) 12.3-22.9 - - 1 (1) 0.2-5.3 Primary - - 41 (22.3) 17.8-29.8 - - 10 (9.9) 3.4-17.1 Secondary - - 80 (43.5) 36-50 - - 26 (25.7) 18.9-35.8 Tertiary - - 62 (33.7) 27-40.3 - - 64 (63.4) 54.7-72.9
Occupation
None - - 0 (0) 0.1-2.0 - - 1 (1) 1.2-5.3
House wife - - 10 (5.4) 2.9-9.5 - - 0 (0) 0.2-5.3 Business - - 76 (41.3) 37-51 - - 24 (23.8) 15.2-32.3 Employed - - 94 (51.1) 42.7-56.8 - - 30 (29.7) 22.1-39.1 Student - - 4 (2.2) 1.1- 6 - - 46 (45.5) 35.4-54.3
Smoking
Yes - - 2 (1.1) 0.5-4.6 - - 5 (5) 2.7-12.1 No - - 182 (98.9) 95.4-99.5 - - 96 (95) 87.9-97.3
Alcohol
Yes - - 22 (12) 8.5-17.6 - - 25 (24.8) 17.9-34.4 No - - 162 (88) 82.4-91.8 - - 76 (75.2 65.6-82.1
Table 2. Baseline levels of CD4 count among the HIV positive respondents.
Respondent group Number CD4+ cell counts (Mean±SEM)
Baseline 3 Months 6 Months
HIV positive
All 184 333±19.7 501.6±25.4 497.1±19.7 CD4+ <200 cells/mm3 22 119±15.1 261.4±54.7 279.4±59.6 CD4+200-499 cells/mm3 86 376.5±19.9 402.8±38.7 363.8±9.2 CD4+ ≥500 cells/ mm3
76 723.8±32.2 666.7±49.1 720.8±27.5 ARV treated 152 502.7±23.5 548±29 538±22 ARV naive 32 562.7±68.6 279±19 301±24
333.0 ± 19.7 cells / mm3. Follow up data on the HIV positive respondents indicated that the CD4+ levels at three and six months were elevated to 501.6±25.4 and 497 ± 19.7 cells / mm3, respectively. The HIV positive respondents were categorized into three groups, according to WHO guidelines, and the CD4+ cell counts for each category determined. The details of the CD4+ baseline values are given in Table 2.
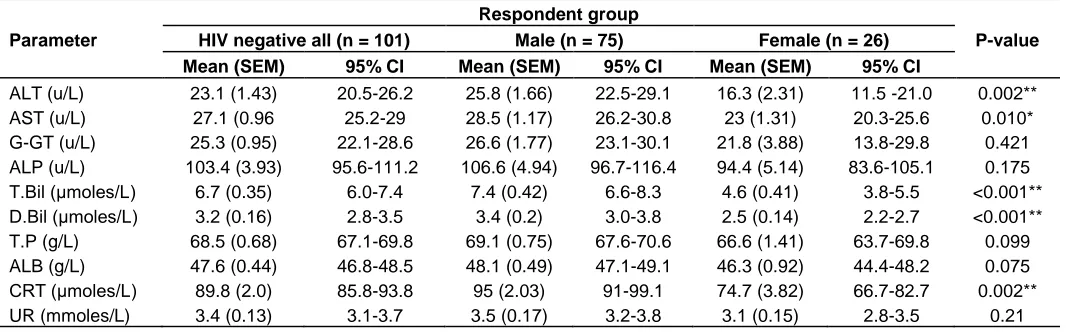
Differences in biochemistry parameters in HIV negative respondents.
HIV-negative male respondents showed significantly
higher mean values than those of HIV negative female respondents in: alanine aminotransferase, aspartate aminotransferase, total bilirubin, direct bilirubin and creatinine. The mean values of these parameters were analyzed for male and for females separately in the HIV positive respondents. Details of the compared male and female biochemistry parameters are demonstrated in Table 3.
Changes in biochemistry parameters in HIV positive respondents over time
4
Mrama et al. 59
Table 3. Differences in biochemistry mean values between male and female HIV negative respondents
Parameter
Respondent group
P-value
HIV negative all (n = 101) Male (n = 75) Female (n = 26)
Mean (SEM) 95% CI Mean (SEM) 95% CI Mean (SEM) 95% CI
ALT (u/L) 23.1 (1.43) 20.5-26.2 25.8 (1.66) 22.5-29.1 16.3 (2.31) 11.5 -21.0 0.002** AST (u/L) 27.1 (0.96 25.2-29 28.5 (1.17) 26.2-30.8 23 (1.31) 20.3-25.6 0.010* G-GT (u/L) 25.3 (0.95) 22.1-28.6 26.6 (1.77) 23.1-30.1 21.8 (3.88) 13.8-29.8 0.421 ALP (u/L) 103.4 (3.93) 95.6-111.2 106.6 (4.94) 96.7-116.4 94.4 (5.14) 83.6-105.1 0.175 T.Bil (μmoles/L) 6.7 (0.35) 6.0-7.4 7.4 (0.42) 6.6-8.3 4.6 (0.41) 3.8-5.5 <0.001** D.Bil (μmoles/L) 3.2 (0.16) 2.8-3.5 3.4 (0.2) 3.0-3.8 2.5 (0.14) 2.2-2.7 <0.001** T.P (g/L) 68.5 (0.68) 67.1-69.8 69.1 (0.75) 67.6-70.6 66.6 (1.41) 63.7-69.8 0.099 ALB (g/L) 47.6 (0.44) 46.8-48.5 48.1 (0.49) 47.1-49.1 46.3 (0.92) 44.4-48.2 0.075 CRT (μmoles/L) 89.8 (2.0) 85.8-93.8 95 (2.03) 91-99.1 74.7 (3.82) 66.7-82.7 0.002** UR (mmoles/L) 3.4 (0.13) 3.1-3.7 3.5 (0.17) 3.2-3.8 3.1 (0.15) 2.8-3.5 0.21
ALT, Alanine aminotransferase; AST, aspartate aminotransferase; G-GT, L-gamma-glutamyl transferase; ALP, alkaline phosphatase; T.BI, total bilirubin; D.BIL, direct bilirubin; TP, total protein; ALB, albumin; CRT, creatinine; UR, urea. *Significant differences between male and female mean values at P < 0.05 (two-tailed) using t-test; **Significant differences between male and female mean values at p < 0.01 (one-tailed) using t-test.
respondents at baseline stage in: CD4+ < 200 -, 200 – 499 - and CD4+ ≥ 500 cells /mm3
groups. This parameter however, showed significant decrease from the baseline stage to the third and to the sixth months’ stages of the study in CD4+≥ 500 cells /mm3
group. In ALP significant decrease of the mean value below the control lower limit was observed at baseline stage in CD4+ 200 – 499 cells /mm3 group; while significant increase was observed in CD4+ ≥ 500 cells /mm3 group. The parameter showed significant decreases between: the baseline and the sixth month’s samples in CD4+ 200 – 499 cells /mm3
group and between the baseline mean value and the mean value of the sixth month’s sample in CD4+≥ 500 cells /mm3 group. When all the mean values of ALP in the CD4+ 200 – 499 cells/mm3 group were compared, they were significantly different. Albumin showed significant decreases below the control lower limit in the baseline mean values in the CD4+ cell groups. Urea (UR) demonstrated significant decreases below the control lower limit in the baseline mean values in: CD4+ 200 – 499 - and CD4+≥ 500 cells /mm3
groups. Details of these changes are shown in Table 4.
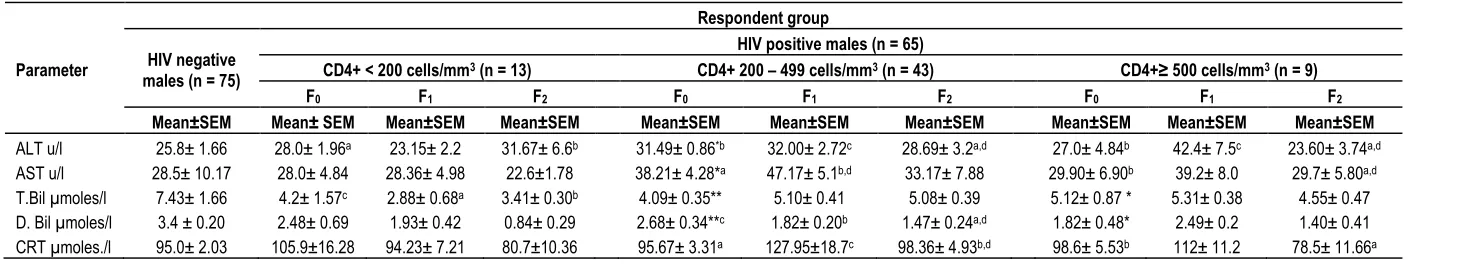
Changes in biochemistry parameters in HIV positive male respondents over time
Significant increase in ALT mean values above the control upper limit was only observed at the baseline stage in CD4+ 200 – 499 cells /mm3 group. Within this CD4+ group the parameter showed significant increase between baseline and the third month’s mean values, followed by a significant decrease in the sixth month’s mean value. There was a significant difference among the mean values of the parameter in the group. In the CD4+ < 200 cells /mm3 group, ALT showed a significant
increase between the baseline mean value and the sixth month’s mean value. The parameter increased significantly above the baseline mean value in the third month sample, then decreased significantly in the sixth month’s sample. When compared, the means of this parameter were significantly different in the CD4+ ≥ 500 cells /mm3 group. Aspartate aminotransferase mean value was significantly increased above the control upper limit in the baseline stage of CD4+ 200 – 499 cells /mm3
group. It also increased significantly between the baseline and the third month samples. On comparison, all the means of the parameter in the CD4 group were significantly different. Significant decrease in AST mean value was observed between the baseline and the sixth month’s mean values in CD4+ ≥ 500 cells /mm3
group. Direct bilirubin (D. Bil) demonstrated significant decrease below the control lower limit at baseline stages of both CD4+ 200 – 499 - and CD4+≥ 500 cells /mm3
groups. The means of parameter showed significant decrease from the baseline to the third month and then to the sixth month’s values in CD4+ < 200 cells/mm3
group. All the means of this parameter in the CD+4 group were significantly different when compared. Creatinine increased significantly above the control upper limit at baseline and third month stages in CD4+200 - 499 cells/mm3 group but decreased significantly in the sixth month’ s sample. When all the mean values of the parameter in CD4+200 - 499 cells/mm3 group were compared, they were significantly different. The details of these changes are shown in Table 5.
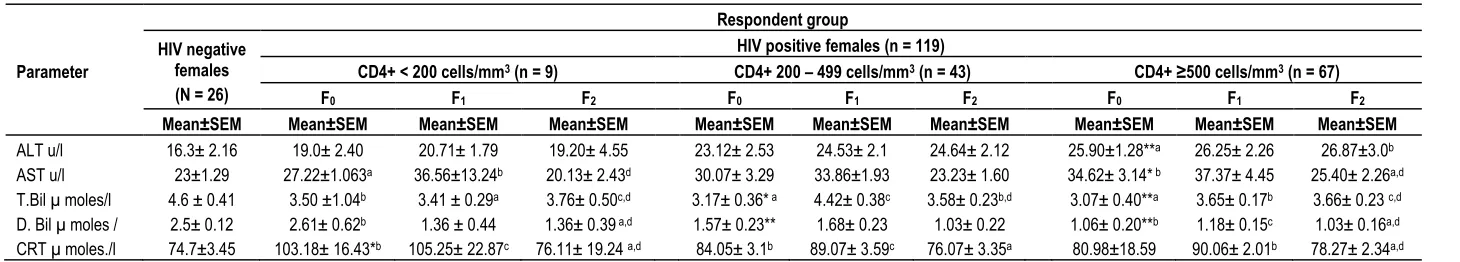
Changes in biochemistry parameters in HIV positive female respondents over time
5
Table 4. Changes in Biochemistry parameters in HIV positive respondents over time.
Parameter
Respondent group
HIV negative all (N = 101)
HIV – positive all (n = 184)
CD4+ <200 cells/mm3 (n = 22) CD4+ 200 – 499 cells/mm3 (n = 86) CD4+ ≥ 500 cells/mm3 (n = 76)
F0 F1 F2 F0 F1 F2 F0 F1 F2
Mean±SEM Mean±SEM Mean±SEM Mean±SEM Mean±SEM Mean±SEM Mean±SEM Mean±SEM Mean±SEM Mean±SEM
G-GT u/l 25.3± 0.9 37± 2.69** 36.3± 0.94 31.8± 2.0 59 ± 4.78** 67.2± 5.05 56.8± 4.65 62.5± 7.83**c 56.6± 5.65b 53.3± 6.80a
ALP u/l 103.4± 0.93 81.8± 9.28 85.2± 3.69 78.0± 4.61 95.9 ± 3.65**b 97.7± 4.21 82.2± 3.78a,d 110.5± 5.04** 102.9±3.99 89.9± 3.81a
T.P g/l 68.5± 0.68 66.3± 1.37** 67.5± 0.81c 57.3± 1.47a,d 64.5 ± 1.46b 69.5 ± 0.92c 63.1± 0.78a,d 65.5± 0.94b 67.5± 0.92c 60.6± 0.1a,d
ALB. g/l 47.6± 0.44 43.2± 1.22** 42.2± 0.70 40.3± 0.85 44 ± 0.53* 45.7± 0.50 43.7± 0.57 45.4± 0.56** 45.2± 0.44 42.4± 0.61
UR µ/l 3.4± 0.13 2.9± 0.34 3.2± 0.30 1.7± 1.17 2.9 ± 0.11** 3± 0.12 2.6± 0.10 3.1 ± 0.13** 2.8 ± 0.14 2.4± 0.15
F0 = Baseline, F1 = Follow up at 3 months; F2 = Follow up at 6 months. *Significant difference in mean values at p<0.05 (two-tailed) between HIV negative respondent and HIV positive respondents at baseline using t-test; **Significant difference in mean values at p<0.01 (one-tailed) between HIV negative respondents and HIV positive respondents at baseline using t-test. a, b, c Significant differences (p< 0.05) in mean values between: F0 and F1; F1 and F2 within CD4 groups in the order of mean vales: a< b< C using t-test. d
Significant difference (p< 0.01) within CD4 group using ANOVA for multiple comparisons.
Table 5. Changes in Biochemistry parameters in HIV positive male respondents over time
Parameter
Respondent group
HIV negative males (n = 75)
HIV positive males (n = 65)
CD4+ < 200 cells/mm3 (n = 13) CD4+ 200 – 499 cells/mm3 (n = 43) CD4+≥ 500 cells/mm3 (n = 9)
F0 F1 F2 F0 F1 F2 F0 F1 F2
Mean±SEM Mean± SEM Mean±SEM Mean±SEM Mean±SEM Mean±SEM Mean±SEM Mean±SEM Mean±SEM Mean±SEM
ALT u/l 25.8± 1.66 28.0± 1.96a 23.15± 2.2 31.67± 6.6b 31.49± 0.86*b 32.00± 2.72c 28.69± 3.2a,d 27.0± 4.84b 42.4± 7.5c 23.60± 3.74a,d
AST u/l 28.5± 10.17 28.0± 4.84 28.36± 4.98 22.6±1.78 38.21± 4.28*a 47.17± 5.1b,d 33.17± 7.88 29.90± 6.90b 39.2± 8.0 29.7± 5.80a,d
T.Bil µmoles/l 7.43± 1.66 4.2± 1.57c 2.88± 0.68a 3.41± 0.30b 4.09± 0.35** 5.10± 0.41 5.08± 0.39 5.12± 0.87 * 5.31± 0.38 4.55± 0.47
D. Bil µmoles/l 3.4 ± 0.20 2.48± 0.69 1.93± 0.42 0.84± 0.29 2.68± 0.34**c 1.82± 0.20b 1.47± 0.24a,d 1.82± 0.48* 2.49± 0.2 1.40± 0.41
CRT µmoles./l 95.0± 2.03 105.9±16.28 94.23± 7.21 80.7±10.36 95.67± 3.31a 127.95±18.7c 98.36± 4.93b,d 98.6± 5.53b 112± 11.2 78.5± 11.66a
F0 = Baseline; F1= Follow up after 3 months; F2 = follow up after 6 months. * Significant difference between HIV negative mean value and HIV positive mean value at baseline at p < 0.05 (two-tailed) using t-test. **Significant difference between HIV negative mean value and HIV positive mean value at p < 0.01 (one-tailed) using t-test. a, b, c Significant difference (p <0.05) in mean values between F0 & F1 and F1 & F2 within CD4+ cell groups in the order of means a<b<c. d Significant difference (p < 0.05) in mean values within a CD4+ group.
control upper limit was observed in CD4+ ≥ 500 cells / mm3 group at baseline stage. The parameter also increased significantly between
the baseline and the sixth month’s samples in the same group. There was a significant increase in AST mean values between the baseline and the
third month’s sample in CD4+ < 200 cells /mm3
6
Mrama et al. 61
Table 6. Changes in biochemistry parameters in HIV positive female respondents over time
Parameter
Respondent group HIV negative
females (N = 26)
HIV positive females (n = 119)
CD4+ < 200 cells/mm3 (n = 9) CD4+ 200 – 499 cells/mm3 (n = 43) CD4+ ≥500 cells/mm3 (n = 67)
F0 F1 F2 F0 F1 F2 F0 F1 F2
Mean±SEM Mean±SEM Mean±SEM Mean±SEM Mean±SEM Mean±SEM Mean±SEM Mean±SEM Mean±SEM Mean±SEM
ALT u/l 16.3± 2.16 19.0± 2.40 20.71± 1.79 19.20± 4.55 23.12± 2.53 24.53± 2.1 24.64± 2.12 25.90±1.28**a 26.25± 2.26 26.87±3.0b
AST u/l 23±1.29 27.22±1.063a 36.56±13.24b 20.13± 2.43d 30.07± 3.29 33.86±1.93 23.23± 1.60 34.62± 3.14* b 37.37± 4.45 25.40± 2.26a,d
T.Bil µ moles/l 4.6 ± 0.41 3.50 ±1.04b 3.41 ± 0.29a 3.76± 0.50c,d 3.17± 0.36* a 4.42± 0.38c 3.58± 0.23b,d 3.07± 0.40**a 3.65± 0.17b 3.66± 0.23 c,d
D. Bil µ moles / 2.5± 0.12 2.61± 0.62b 1.36 ± 0.44 1.36± 0.39 a,d 1.57± 0.23** 1.68± 0.23 1.03± 0.22 1.06± 0.20**b 1.18± 0.15c 1.03± 0.16a,d
CRT µ moles./l 74.7±3.45 103.18± 16.43*b 105.25± 22.87c 76.11± 19.24 a,d 84.05± 3.1b 89.07± 3.59c 76.07± 3.35a 80.98±18.59 90.06± 2.01b 78.27± 2.34a,d
F0 = Baseline, F1 = Follow up at 3 months, F2 = Follow up at 6 months *Significant difference between HIV negative mean values and HIV positive at baseline at p<0.05 (two-tailed) using t-test. **Significant difference between HIV – negative mean values and HIV positive. Baseline mean values at p<0.01(one-tailed) using t-test. a, b, c Significant differences (p <0.05) in mean values between: F0 and F1; F1 and F2. within CD4 groups in the order of mean values: a< b< C. d Significant difference in mean values (p< 0.01) within CD4 group using ANOVA for multiple comparison.
aminotransferase demonstrated significant increase above the control upper limit in CD4+ ≥ 500 cells /mm3 group. When all the mean values of this parameter in CD4+ ≥ 500 cells /mm3
group were compared, they differed significantly. Total bilirubin showed significant decrease below the control lower limit cells / mm3 at baseline stages of: CD4+ 200 – 499 - and CD4+ ≥ 500 cells /mm3
groups. The mean values of this parameter in CD4+< 200 cells / mm3 group decreased significantly between the third and the sixth months’ samples. When the mean values of this parameter in thesamegroupwerecompared, they differed significantly. Total Bilirubin demonstrated significant increases between the baseline and the third month’s mean values in CD4 + ≥ 500 cells /mm3 group. All the mean values of the parameter in the CD4+ group differed significantly when compared. Direct bilirubin mean values increased significantly above the control upper limit at the baselines stages of CD + 200 – 499 -
and CD4+ ≥ 500 cells /mm3
groups. The mean values of this parameter decreased significantly between the baseline and the sixth month’s samples in CD4+ < 200 cells / mm3 group. When all the mean values of the parameter in the CD4+ group were compared, they were significantly different. In CD4+ ≥ 500 cells/mm3
group D. Bil showed significant increase between the baseline and the third month’s mean values but significantly decreased between the third and the
sixth months’ mean values. Creatinine mean values significantly increase
above the controls upper limit in CD4+ < 200 cells /mm3 group at the baseline stage. The values also increased between the baseline and the third month’s samples but significantly decreased between the third and the sixth months’ samples in the CD4+ group. When the mean values of the parameter in the CD4+ group were compared, they were significantly different. The mean values of CRT demonstrated significant increases
between the baseline and the third month’s samples and significant decreases between the third and the sixth months’ samples in CD4+ 200 – 499 cells /mm3
group. Similar changes of the mean values of CRT were observed in CD4+ ≥ 500 cells /mm3 group (Table 6).
DISCUSSION
Among the HIV seronegative respondents, significantly higher ALT (p = 0.002), AST (p = 0.01) and CRT (p = 0.01) mean values in males than in females were confirmed (Koran et al., 2007). These gender-based variations have been previously attributed to the direct effect of sex hormones (Murphy, 2014).
7
and a half times above referents upper limit in CD4+ < 200 cells/mm3 group and by between two and about two and a half times above the limit in both CD4+ 200 – 499 - and ≥500 cells/mm3groups. The higher GGT levels observed in CD4+ 200 - 499 and in CD4+ ≥500 cells/mm3
groups may be related to higher white blood cells count, red blood cells count, higher hematocrit and haemoglobin levels which may characterize these groups. These parameters have been associated with levels of G-GT in earlier reports (Ramana et al., 2012). Conversely, the decreases in ALP mean values below the control lower limit were most marked in CD4+ < 200 cells/mm3 group. Decreased ALP levels have been reported in cardiac surgery and cardiopulmonary bypass, malnutrition, magnesium deficiency, hypothyroidism and severe anemia (Lum, 1995). Increases in GGT levels with decreases in ALP levels have been associated with cardiac related disorders (Jiang et al., 2013) rather than biliary disease (Lum and Gambino, 1972). Levels of HIV – associated anemia are reported to increase with the severity of the disease (Meidani et al., 2013). In this study CD4+ < 200 cells /mm3 represent the severest stage of HIV. Subsequently high levels of anemia that could characterize the stage may be one cause of the marked decreases in ALP observed. This would be confirmed by determining hemoglobin levels.
Slight to moderately elevated levels of ALT and AST were observed in both male and female HIV positive respondents with no CD4+group based characteristic trends. This shows changes in these two enzymes are not affected by changes in CD4+ cells. Earlier reports have indicated that HIV disease progress does not alter the levels of these two liver enzymes (Dusingize et al., 2015). Increases in ALT and AST have previously been reported in myocardial infarction, acute liver cell damage, viral hepatitis and carbon tetrachloride poisoning (Dusingize et al., 2015; Netto et al., 2009). Levels of hypoalbuminemia decreased with increases in CD4+ cells suggesting that there may be altered albumin: globulin ratio; levels of globulins will be higher in CD4+ < 200 cells/mm3 group. This consequently suggests that levels of hypergammaglobulinemia in HIV reported elsewhere (Audu et al., 2004; Patil and Raghuwanshi, 2009) is highest in this stage of the disease marking the severity of this disease. Determination of albumin: globulin ratios would confirm these suggestions. Hypoalbuminaemia in HIV infection has also been reported previously following use of certain antiretroviral agents (Ibeh et al., 2013). The observed decreases in both the total and direct bilirubin in HIV positive respondents is clinically insignificant; only hyperbilirubinemia is of significance in HIV infection and arises from jaundice, liver disease, hemolytic anemia and blockage of the bile duct (Wolf, 1999; VanWagner and Green, 2015). Increased levels of creatinine in HIV positive respondents observed did not demonstrate any
trends in the CD4+ groups indicating that the serum levels of this parameter are not associated with HIV disease progress.
Establishment of gender – based reference ranges for T. Bil and D. Bil values are recommended. Assays of cardiac enzymes in monitoring the progress of HIV management are recommended. Determination of Albumin: globulin ratios in HIV monitoring is recommended Albumin is a carrier protein for bilirubin, hormones, metals, vitamins, and drugs (Merlot and Richardson, 2014; Naveen et al., 2016). So the impact of hypoalbuminemia on drug therapies and food supplements in the management of HIV-associated pathologies need to be determined. Similar study on ARV- treated and ARV- naïve patients separately is recommended.
Study limitations
The recruitmentofstudyrespondentswasnot randomized and this may have reduced the strength of making population inferences of the studied characteristics. The details of antiretroviral therapy regimens and HIV- coinfection and their therapies were not put into account in this research work.
CONFLICT OF INTERESTS
The authors declare that they have no conflict of interest.
REFERENCES
Agbaji OO, Onu A, Agaba PE. Muazu MA, Falang KD, Idoko JA (2011). Predictors of impaired renal function among HIV infected patients commencing highly active antiretroviral therapy in Jos, Nigeria. Niger. Med. J. 52(3):182-185.
Amanzada A, Goralczyk AD, Reinhardt L, Moriconi F, Cameron S, Mihm S (2011). Erythropoietin rs1617640 G allele associates with an attenuated rise of serum erythropoietin and a marked decline of hemoglobin in hepatitis C patients undergoing antiviral therapy. BMC Infect. Dis. 14:503.
Audu RA, Akanmu AS, Mafe AG, Efienemokwu C, Musa AZ, Lemoha E, Odunaike MI, Funso-Adebayo EO, Meshack E, Idigbe EO (2004). Changes in Serum Proteins and Creatinine levels in HIV Infected Nigerians. Niger. J. Health Biomed. Sci. 3(2):69-72.
Beverborg GN, Verweij N, Klip T van der- Wa H, Voors A, van Veldhuisen D, Gansevoort N, Bakker S, Harst P, Meer P (2015). Erythropoietin in the General Population: Reference Ranges and Clinical, Biochemical and Genetic Correlates. PLoS One 10(4):e0125215.
Clark JM, Brancati FL, Diehl AM (2003). The prevalence and etiology of elevated aminotransferase levels in the United States. Am. J. Gastroenterol. 98(5):960-967.
8
Ganz T, Nemeth E (2012). Hepcidin and iron homeostasis. Biochim.Biophys. Acta 1823(9):1434-1443.
Hunziker L, Recher M, Macpherson AJ (2003). Hypergammaglobulinemia and autoantibody induction mechanisms in viral infections. Nature Immunol. 4:343-349.
Ibeh B, Omodamiro O, Ibeh U, Habu J (2013). Biochemical and haematological changes in HIV subjects receiving winniecure antiretroviral drug in Nigeria. J. Biomed. Sci.20(1):73.
Jiang S, Jiang D, Tao Y (2013). Role of gamma-glutamyltransferase in cardiovascular diseases. Exp. Clin. Cardiol. 18:53-56.
Koran K, Addae M, Ocran J, Adu-Amankwah S, Rogers WO, Nkrumah FK (2007). Population based reference intervals for common blood haematological and biochemical parameters in the Akuapem North district. Ghana Med. J.41:160-166.
Limdi JK, Hyde GM (2003). Evaluation of abnormal liver function tests. Postgrad. Med. J. 79(932):307-312.
Lum G (1995). Significance of Low Serum Alkaline Phosphatase Activity in a Predominantly Adult Male Population Clinical. Chemistry 41(4):515-518.
Lum G, Gambino SR (1972). Serum gamma-glutamyl transpeptidase activity as an indicator of disease of liver, pancreas, or bone. Clin. Chem. 18(4):358-362.
Mata-Marín JA1, Gaytán-Martínez J, Grados-Chavarría BH, Fuentes-Allen JL, Arroyo-Anduiza CI, Alfaro-Mejía A (2009). Correlation between HIV viral load and aminotransferases as liver damage markers in HIV infected naive patients: A concordance cross-sectional study. Virol. J. 6:181.
Meidani M, Rezaei F, Maracy RM, Avijgan M, Tayeri K (2013). Prevalence, severity, and related factors of anemia in HIV/AIDS patients. J. Res. Med. Sci. 17(2):138-142.
Merlot AM, Richardson DR (2014).Unraveling the mysteries of serum albumin –more than just a serum protein. Front. Physiol. 5:299. Murphy WG (2014). The sex difference in haemoglobin levels in adults
–Mechanisms, causes, and consequences. Blood Rev.28(2):41-47.
Mrama et al. 63
Naveen R, Akshata K, Pimple S, Chaudhari PA (2016). Review on albumin as drug carrier in treating different diseases and disorders. Pharm. Sin. 7(1):11-15.
Netto I, Borgaonkar K, Lobo R (2009). Aminotransferase profile in HIV positive patients. Indian J. Sex. Transm. Dis. 30(2):121.
Patil R, Kamble P, Raghuwanshi U (2013). Serum ALP and GGT Levels in HIV Positive patients. Int. J. Recent Trends Sci. Technol. 5(3):155-157.
Patil R, Raghuwanshi U (2009). Serum Protein, Albumin, Globulin Levels, and A/G Ratio in HIV Positive Patients. Biomed. Pharmacol. J. 2(2):321-325.
Poles MA, Lew EA, Dieterich DT (1997). Diagnosis and treatment of hepatic disease in patients with HIV. Gastroenterol. Clin. North Am. 26:291-321.
Rahman MM, Giti S, Islam MS, Rahman MM (2014). Haematological Changes in Peripheral Blood of HIV –Infected Persons with Correlation to CD4 Cell Count. J. Bangladesh Coll. Phys. Surg. 32:130-136.
Ramana KV, Rao R (2012). Abnormal levels of γ-glutamyl transpeptidase (GGTP), ALT, AST in human immunodeficiency virus-1 (HIV-virus-1) infection. Biochem. Physiol. virus-1(virus-10virus-1):2-4.
Scarpino M, Santoro M, Pellicano G (2015). HIV infection and kidney disease: literature review. Infect. Dis. Trop. Med. 1(4):E195.
VanWagner L, Green R (2015). Evaluating Elevated Bilirubin Levels in Asymptomatic Adults. J. Am. Med. Assoc. 313(5):516-517.