Western University Western University
Scholarship@Western
Scholarship@Western
Electronic Thesis and Dissertation Repository
7-28-2016 12:00 AM
Development and Optimization of Solid Polymer Electrolyte for
Development and Optimization of Solid Polymer Electrolyte for
Lithium Ion Batteries
Lithium Ion Batteries
Ladan Eskandarian
The University of Western Ontario
Supervisor Oleg Semenikhin
The University of Western Ontario Graduate Program in Chemistry
A thesis submitted in partial fulfillment of the requirements for the degree in Master of Science © Ladan Eskandarian 2016
Follow this and additional works at: https://ir.lib.uwo.ca/etd
Part of the Materials Chemistry Commons, and the Physical Chemistry Commons
Recommended Citation Recommended Citation
Eskandarian, Ladan, "Development and Optimization of Solid Polymer Electrolyte for Lithium Ion Batteries" (2016). Electronic Thesis and Dissertation Repository. 3897.
https://ir.lib.uwo.ca/etd/3897
This Dissertation/Thesis is brought to you for free and open access by Scholarship@Western. It has been accepted for inclusion in Electronic Thesis and Dissertation Repository by an authorized administrator of
i
Abstract
This thesis focuses on the development of new poly(ethylene oxide) (PEO)-based solid polymer
electrolytes (SPEs) in order to enhance their ionic conductivity at ambient temperature and
fabricate the prototypes of novel Li ion batteries using these SPEs. Different types of SPEs have
been developed: (i) blends of high molecular weight PEO and low molecular weight poly(vinyl
acetate) (PVAc); (ii) composites of high molecular weight PEO and titanium dioxide
(TiO2)nanoparticles; and (iii) blend-based composite electrolytes consisting of PEO and PVAc
with dispersed TiO2. The SPEs were characterized by scanning electron microscopy (SEM),
thermal gravimetric analysis (TGA), and differential scanning calorimetry (DSC). The
electrochemical performance of the battery prototypes were determined by galvanic cycles at
various current densities.
The results revealed that the crystallization of PEO was easily suppressed by blending it with
PVAc. The resistance of these blends were found to decrease with an increase in the PVAc
content. TiO2 nanoparticles were found to be a compatible filler with the PEO matrix, as was
proven by the lowered crystallinity, glass transition and melting temperatures of the matrix, as
well as a significantly enhanced conductivity at ambient temperature.
A new type of SPE has been prepared by adding both PVAc and TiO2 to PEO-based electrolyte.
The amorphous nature of the new electrolyte was confirmed by DSC. Several prototypes of a
Li-ion battery, based on this blend-based composite electrolyte and utilizing LiFePO4 as cathode
and Al as anode, were assembled and cycled at different current densities at room temperature,
resulting in excellent performance. The best prototype so far showed more than 500
charge-discharge cycles with the coulombic efficiency approaching 100% and the resistance decreasing
to 500 Ω.cm2.
Keywords
solid polymer electrolyte, poly(ethylene oxide), poly(vinyl acetate), titanium dioxide
ii
iii
Acknowledgments
I’d like to thank my supervisor, Dr. Oleg Semenikhin for his expert guidance over the past two
years. Whenever I was frustrated and downcast over the most recent batch of seemingly
nonsensical results, he would inevitably interpret the same data in a different and much more
positive light.
I received incredible support from members of the Semenikhin Lab. From the first day, Mike
Nieradko and David Pipher showed me the graduate school ropes. It was a pleasure getting to
know Dr. Jamie Noël and Dr. Jiju Joseph, talented chemists who would always greet you with a
smile. They were hard workers and willing sounding boards for discussing the finer points of
electrochemistry especially impedance spectroscopy.
I’d like to give a special thanks to my undergraduate research assistant, Fareshta Zargarzadah.
She helped me in lots of sample preparation and prototype cycling in the summer of 2014. A lot
of thanks to my friends, Aria Khalili, Elmira Pajootan, Mehdi Rahimdokht, Mojtaba Momeni
and Rohit Kulkarni who have been helpful and cooperative through all stages of my academic
study. I could count on them to find the answer to literally any question, and do it with a smile.
Last I’d like to thank my parents and my sister. Despite the many miles between us, I felt their
constant love and support throughout the process. They were with me for the good times and
iv
Table of Contents
Abstract ... i
Acknowledgments ... iii
Table of Contents ... iv
List of Tables ... vii
List of Figures ... viii
List of Schemes ... xi
Acronyms ... xii
Symbols ...xiii
Chapter 1 ... 1
1 INTRODUCTION ... 1
1.1 Background/motivation ... 1
1.1.1 General Views on Rechargeable Lithium Batteries ... 1
1.1.1.1 Negative Electrode Materials: Aluminum ... 3
1.1.1.2 Positive Electrode Materials ... 4
1.1.1.3 Electrolyte ... 6
1.2 Objectives ... 9
1.3 Contributions ... 9
1.4 References ... 10
Chapter 2 ... 13
2 AN OVERVIEW OF SOLID POLYMER ELECTROLYTES ... 13
2.1 History of solid polymer electrolytes ... 13
2.2 Fundamentals of SPE ... 14
2.2.1 Formation of polymer-lithium salt complex ... 14
2.2.2 Ion conduction mechanism in SPEs ... 18
2.2.3 Phase diagram of PEO based SPE ... 19
2.2.4 Ion conduction in semi-crystalline SPEs... 22
2.2.5 Approaches to improve ionic conductivity in SPEs ... 23
2.2.5.1 Composite SPEs ... 23
2.2.5.2 Blend polymers composite SPEs ... 26
2.3 Summary ... 27
2.4 References ... 28
v
3 MATERIALS AND METHODS ... 32
3.1 Materials ... 32
3.2 Apparatus ... 32
3.3 Aluminum and Copper Substrate Preparation... 33
3.4 Cathode Preparation ... 33
3.5 Preparation and Spin-Coating of SPE ... 34
3.6 Solid Polymer Electrolyte Properties and Electrochemical Characterization Summary ... 35
3.7 Lithium-Ion Battery Coin Cell Assembly and Testing ... 37
3.8 Characterizations ... 38
3.8.1 Electrochemistry Techniques and Methodology used in Lithium-Ion Battery Research ... 38
3.8.1.1 Galvanic Cycling... 38
3.8.1.2 Determination of the IR drop from galvanic cycles ... 40
3.8.1.3 Analysis of the potential vs. time ... 42
3.8.2 Morphological analysis ... 43
3.8.2.1 Scanning Electron Microscopy (SEM) ... 43
3.8.3 Thermal analysis ... 44
3.8.3.1 Thermogravimetric Analysis (TGA) ... 46
3.8.3.2 Differential Scanning Calorimetry (DSC) ... 46
3.8.4 Data Accuracy and Precision ... 46
3.9 References ... 49
Chapter 4 ... 50
4 PREPARATION AND STUDIES OF THE POLYMER COMPOSITES TO BE USED AS ELECTROLYTES IN LI ION BATTERY PROTOTYPES ... 50
4.1 Thermal behaviour of SPEs with different contents of PVAc ... 51
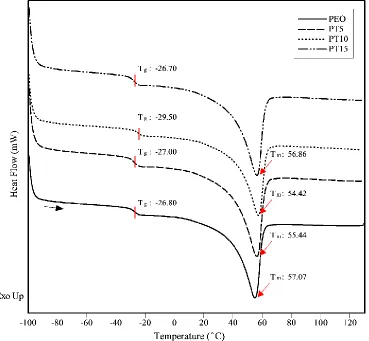
4.1.1 DSC analysis ... 51
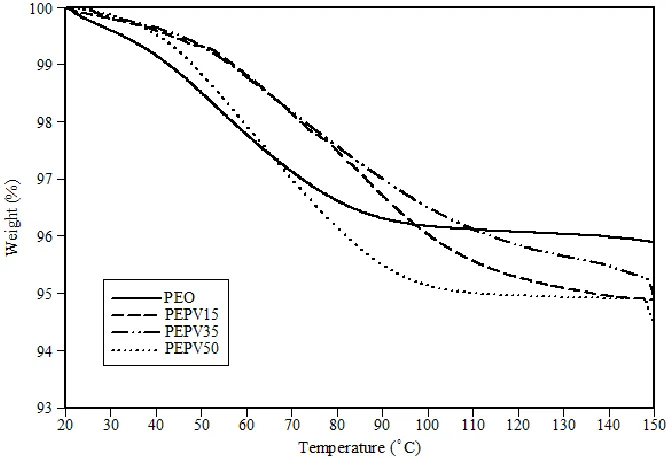
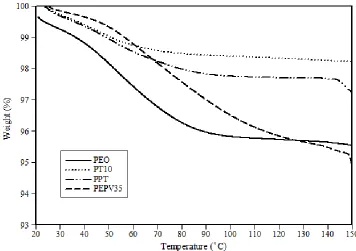
4.1.2 TGA analysis ... 53
4.2 Thermal behaviour of SPEs with different contents of TiO2 ... 54
4.2.1 Differential scanning calorimetry (DSC) ... 54
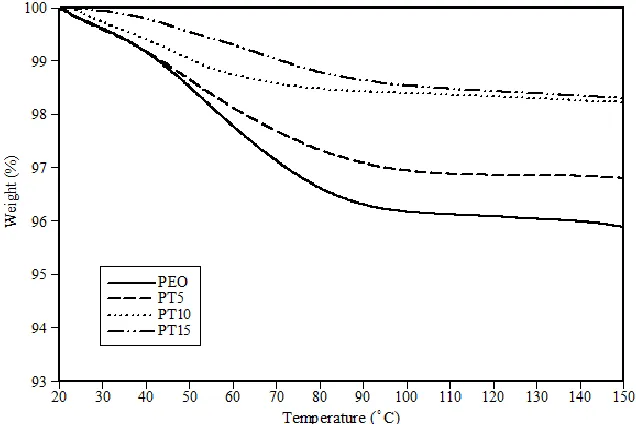
4.2.2 TGA measurements... 56
4.3 Thermal behaviour of SPEs with the optimum contents of PVAc and TiO2 ... 57
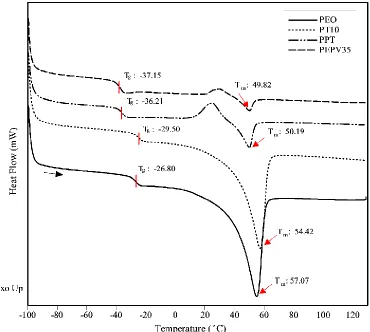
4.3.1 DSC analysis ... 57
4.3.2 TGA analysis ... 58
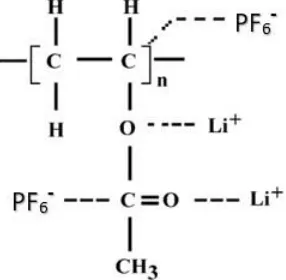
4.3.3 Transport mechanism of ions in the PEO-PVAc-TiO2 system ... 59
4.4 Summary ... 61
vi
Chapter 5 ... 64
5 ELECTROCHEMICAL PROPERTIES OF LI ION BATTERY PROTOTYPES WITH SOLID POLYMER ELECTROLYTES ... 64
5.1 Galvanic cycles of the battery prototypes ... 64
5.2 Solid polymer electrolytes with different contents of PVAc ... 68
5.3 Solid polymer electrolytes with different contents of TiO2 ... 71
5.4 Solid polymer electrolyte with the optimum contents of PVAc and TiO2 ... 73
5.5 Determination of the properties of the electroformed nanostructure from the resistances and discharging potentials ... 77
5.6 The performance of the best battery prototype made using PPT solid polymer electrolyte ... 81
5.7 References ... 87
Chapter 6 ... 89
6 CONCLUSIONS AND FUTURE WORK ... 89
vii
List of Tables
Table 1.1: Electrochemical parameters of several cathode materials. ... 5
Table 2.1: Typical polymer hosts with their structure and glass and melting temperatures, reproduced from ref. [22]. ... 17
Table 3.1: Apparatus used in experiments. ... 33
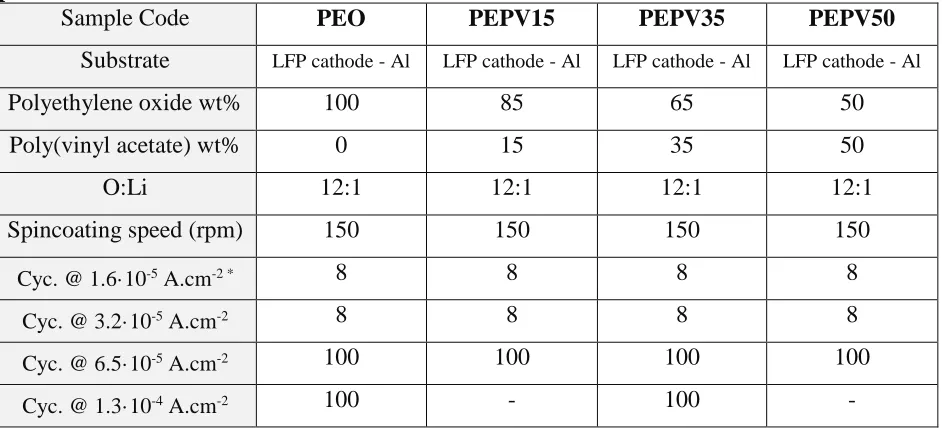
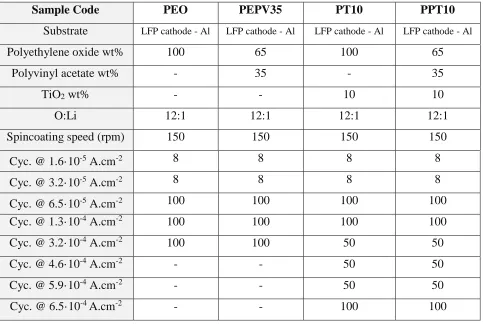
Table 3.2: SPEs with different contents of PVAc and their battery prototypes testing procedure. ... 35
Table 3.3: SPEs with different contents of TiO2 and their battery prototypes testing procedure. ... 36
Table 3.4: SPEs with different contents of PVAc and TiO2 and their battery prototypes testing procedure ... 36
Table 3.5: Confidence intervals for various values of resistance of SPEs at different current densities .... 48
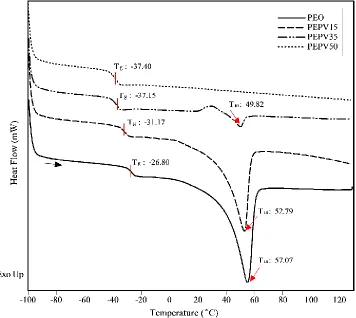
Table 4.1: Properties of solid polymer electrolytes with different contents of PVAc were obtained from DSC heating scans (10°C per minute). ... 51
Table 4.2: Properties of solid polymer electrolytes with different contents of PVAc were obtained from TGA analysis (heating rate 10°C/min). ... 53
Table 4.3: Properties of solid polymer electrolytes with different contents (wt.%) of TiO2 were obtained from DSC heating scans (10°C per minute). ... 54
Table 4.4: Properties of solid polymer electrolytes with different contents of TiO2 obtained from TGA analysis (10°C per minute). ... 56
Table 4.5: Properties of solid polymer electrolytes with and without 10 wt.% TiO2 and/or 35 wt.% PVAc obtained from DSC heating scans (10°C per minute). ... 57
Table 4.6: Properties of solid polymer electrolytes with and without 10 wt.% TiO2 and/or 35 wt.% PVAc obtained from TGA analysis (10°C per minute). ... 59
Table 5.1: The average resistance (Ω.cm2) of solid polymer electrolytes with different contents of PVAc, with LiFePO4 cathode and an Al anode. ... 69
Table 5.2: The average coulombic efficiency (%) of solid polymer electrolytes with different contents of PVAc, with LiFePO4 cathode and an Al anode... 71
Table 5.3: The average resistance (Ω.cm2) of solid polymer electrolytes with different contents of TiO 2, with LiFePO4 cathode and an Al anode. ... 72
Table 5.4: The average coulombic efficiency (%) of solid polymer electrolytes with different contents of TiO2, with LiFePO4 cathode and an Al anode. ... 73
Table 5.5: The average Resistance (Ω.cm2) of solid polymer electrolytes with and without 10 wt.% TiO 2 and/or 35 wt.% PVAc, with LiFePO4 cathode and an Al anode. ... 75
viii
List of Figures
Figure 1.1: Schematic of lithium-ion battery showing possible anode, cathode and electrolyte materials. 2 Figure 1.2: Chemical potential of Li as a function of mole fraction in Li/Al, from ref.[13]. ... 4 Figure 1.3: The crystal structure of olivine LiFePO4 [20]. ... 6
Figure 2.1: Summary of solid polymer electrolyte development during the last four decades adopted from ref. [21]. ... 14 Figure 2.2: Poly(ethylene oxide), PEO, structure viewed; (a) parallel and (b) normal to the axis of the
helix. The black and white circles represent oxygen and carbon atoms, respectively. Hydrogen and lithium atoms are not shown. Adopted from ref. [31]. ... 16 Figure 2.3: Schematics of segmental motion assisted Li+ cation conduction in a polymer electrolyte,
circles represent ether oxygen on PEO backbone [9]. ... 19 Figure 2.4: Phase diagrams of a series PEO-LiX electrolytes: (a) PEO-LiClO4; (b) PEO-LiAsF6; reproduced
from ref. [42]. ... 20 Figure 2.5: (a) SEM micrograph and (b) EDX sulfur map of a P(EO)20LiCF3SO3 SPE, reproduced from ref.
[43]. ... 21 Figure 2.6: Ionic conductivity as a function of salt content at various temperatures for (a) PEO-LiClO4
system; (b) PEO-LiAsF6 system (adapted from ref. [42]). ... 22
Figure 2.7: Schematic illustration of amorphous to crystalline transition in PEO based SPEs (adapted from ref. [51]). ... 22 Figure 2.8: Temperature dependent ionic conductivity for solution cast P(EO)nLiClO4 electrolytes,
reproduced from ref. [42]. ... 23 Figure 2.9: Temperature dependent ionic conductivity of PEO-LiClO4 ceramic-free and nanocomposite
SPEs, adopted from ref. [16]. ... 24 Figure 2.10: Illustration of the surface interaction between Al2O3 nanoparticles with different surface
characteristics and the PEO-LiSO3CF3 complex. Adapted from ref. [64]. ... 26
Figure 3.1: Schematic cross-section showing the structure of a coin cell lithium-ion battery with solid polymer electrolyte ... 38 Figure 3.2: A battery galvanic cycle of a prototype with a solid polymer electrolyte, LiFePO4 cathode and
an Al anode at a current density of 6.5·10-5 A.cm-2. ... 39
Figure 3.3: The typical Randles circuit. ... 40 Figure 3.4: The equivalent circuit for battery prototypes. ... 41 Figure 3.5: SEM image of battery cathode and anode before and after galvanic cycling at 6.5·10-5 A.cm-2,
(a) LiFePO4-before (b) LiFePO4-after at 100X magnification (c) Al-before (d) Al-after at 10000X
magnification. ... 44 Figure 3.6: (a) DSC scan showing the key features of energy transfer processes in a polymer material; (b)
thermogravimetric response illustrating the mass loss as a function of the temperature. Adapted from ref. [3] ... 46 Figure 4.1: Third heating DSC curves for solid polymer electrolytes with different contents of PVAc. The
temperature scan range was between -100°C and 130°C. The heating rate was 10°C/min. ... 52 Figure 4.2: TGA curves for solid polymer electrolytes with different contents of PVAc. The heating rate
was 10°C/min. ... 53 Figure 4.3: Third heating DSC curves for solid polymer electrolytes with different contents of TiO2. The
ix
Figure 4.4: TGA curves for solid polymer electrolytes with different contents of TiO2. The heating rate is
10°C/min. ... 56 Figure 4.5: Third heating DSC curves for solid polymer electrolytes with and without 10 wt.% TiO2 and/or
35 wt.% PVAc. The temperature scan range was between -100°C and 130°C. The heating rate was 10°C/min. ... 58 Figure 4.6: TGA curves for solid polymer electrolytes with and without 10 wt.% TiO2 and/or 35 wt.%
PVAc. The heating rate is 10°C/min. ... 59 Figure 4.7: Polymers structure (a) PVAc, (b) PEO. ... 60 Figure 5.1: Battery galvanic cycles of sample with a PEPV35 solid polymer electrolyte, LiFePO4 cathode
and an Al anode at current density of 1.3·10-4 A.cm-2 for 100 cycles. ... 65
Figure 5.2: Battery galvanic cycles of prototype with a PEPV35 solid polymer electrolyte, LiFePO4 cathode
and an Al anode at current density of 1.3·10-4 A.cm-2 for 100 cycles. (a) 2nd, (b) 50th, (c) 100th
cycle. ... 66 Figure 5.3: Voltage/time profile of the last charge/discharge cycles obtained at current density of 1.3·10
-4 A.cm-2 for 100 cycles for an Al/SPE/LiFePO
4 polymer cell. See the legend for different types
of SPEs. ... 68 Figure 5.4: Resistance of solid polymer electrolytes with different contents of PVAc, with LiFePO4
cathode and an Al anode at current densities of 1.6·10-5, 3.2·10-5, and 6.5·10-5 A.cm-2. ... 69
Figure 5.5: Coulombic efficiency of solid polymer electrolytes with different contents of PVAc, with LiFePO4 cathode and an Al anode at current densities of 1.610-5, 3.2·10-5, and 6.5·10-5 A.cm-2.
... 70 Figure 5.6: Resistance of solid polymer electrolytes with different contents of TiO2, with LiFePO4 cathode
and an Al anode at current densities of 1.6·10-5, 3.2·10-5, and 6.5·10-5 A.cm-2. ... 72
Figure 5.7: Coulombic efficiency of solid polymer electrolytes with different contents of TiO2, with
LiFePO4 cathode and an Al anode at current densities of 1.6·10-5, 3.2·10-5, and 6.5·10-5 A.cm-2.
... 73 Figure 5.8: Resistance of solid polymer electrolytes with and without 10 wt.% TiO2 and/or 35 wt.% PVAc,
with LiFePO4 cathode and an Al anode at current densities of 1.6·10-5 and 3.2·10-5 A.cm-2. ... 74
Figure 5.9: Resistance of solid polymer electrolytes with and without 10 wt.% TiO2 and/or 35 wt.% PVAc,
with LiFePO4 cathode and an Al anode at current densities of 6.5·10-5, 1.3·10-4, 3.2·10-4,
6.4·10-4 A.cm-2. ... 75
Figure 5.10: Coulombic efficiency of solid polymer electrolytes with and without 10 wt.% TiO2 and/or 35
wt.% PVAc, with LiFePO4 cathode and an Al anode at current densities of 1.6·10-5 and 3.2·10-5,
A.cm-2. ... 76
Figure 5.11: Coulombic efficiency of solid polymer electrolytes with and without 10 wt.% TiO2 and/or 35
wt.% PVAc, with LiFePO4 cathode and an Al anode at current densities of 6.5·10-5, 1.3·10-4,
3.2·10-4, 6.4·10-4 A.cm-2. ... 76
Figure 5.12: Discharging potential corrected for IR drop of all SPEs at different current densities and all the cycles. ... 78 Figure 5.13: SEM image of battery anode with SPE after galvanic cycling followed by separation from the
solid polymer electrolyte and cathode at 20000X magnification, (a) PEO (b) PEPV35 (c) PT10 (d) PPT. ... 80 Figure 5.14: Battery galvanic cycles of sample with a PPT solid polymer electrolyte, LiFePO4 cathode and
an Al anode at current density of (a) 1.6·10-5 A.cm-2 for 8 cycles and (b) 3.2·10-5 A.cm-2 for 8
cycles. ... 82 Figure 5.15: Battery galvanic cycles of sample with a PPT solid polymer electrolyte, LiFePO4 cathode and
x
Figure 5.16: Battery galvanic cycles of sample with a PPT solid polymer electrolyte, LiFePO4 cathode and
an Al anode at current density of 1.3·10-4 A.cm-2 for further 100 cycles. ... 83
Figure 5.17: Battery galvanic cycles of sample with a PPT solid polymer electrolyte, LiFePO4 cathode and
an Al anode at current density of 3.2·10-4 A.cm-2 for further 50 cycles. ... 84
Figure 5.18: Battery galvanic cycles of sample with a PPT solid polymer electrolyte, LiFePO4 cathode and
an Al anode at current density of 4.5·10-4 A.cm-2 for further 50 cycles. ... 85
Figure 5.19: Battery galvanic cycles of sample with a PPT solid polymer electrolyte, LiFePO4 cathode and
an Al anode at current density of 5.8·10-4 A.cm-2 for further 50 cycles. ... 86
Figure 5.20: Battery galvanic cycles of sample with a PPT solid polymer electrolyte, LiFePO4 cathode and
xi
List of Schemes
Scheme 4.1: The coordination of cation with the ester oxygen and C-O in PVAc–LiPF6 polymer complex.
xii
Acronyms
ACN Acetonitrile
BSE Back Scattered Electron
CE Counter Electrode
CPE Constant Phase Element
Cyc Cycles
EC Ethylene Carbonate
EDX Energy Dispersive X-ray
EMC Ethylmethyl Carbonate
EXO Exothermic
Endo Endothermic
DEC Diethyl Carbonate
DSC Differential scanning calorimetry
DMC Dimethyl
LFP Lithium Iron Phosphate
MEEP Poly[Bis(Methoxy Ethoxy) Phosphazene]
NMR Nuclear Magnetic Resonance
NMP 1-methyl-2-pyrrolidinone
PAN Poly(Acrylonitrile)
PC Propylene Carbonate
PEO Poly(Ethylene Oxide)
PMMA Poly(Methylmethacrylate)
PPO Poly(Propylene Oxide)
PVAc Poly(Vinyl Acetate)
PVdF Poly(Vinylidene Fluoride)
RE Reference Electrode
RT Room Temperature
SEM Scanning Electron Microscope
S.D. Standard Deviation of Resistance
SE Standard Error of the Mean
SPEs Solid polymer electrolytes
TD Degradation/Decomposition Temperature
TGA Thermogravimetric Analysis
WE Working Electrode
xiii
Symbols
A Surface Area
Cdl Double Layer Capacitance
E Potential
Eo Standard Potential
ΔEohm Voltage Drop
ΔH Enthalpy
ΔHrec Recrystallization Enthalpy
ΔHm Heat of Fusion of Sample
ΔHm,p Heat of Fusion of 100% Crystalline Sample
ΔG Gibbs Free Energy
ΔS Entropy
F Faraday Constant
I Current
µx Chemical Fraction
Mw Molecular Weight
Mean value of Resistance
R Resistance
R Gas Constant
Rct Charge Transfer Resistance
Re Electrolyte Resistance
ρ Density
σ Ionic Conductivity
t Value of t-statics
T Temperature
Tc Crystallization Temperature
Ti Procedural Temperature
Tf Final Temperature
Tg Glass Transition Temperature
Tm Melting Temperature
wt.% Weight Percent
Xc Crystalline Phase Content
Xi Weight Fraction
1
Chapter 1
1 INTRODUCTION
1.1 Background/motivation
1.1.1 General Views on Rechargeable Lithium Batteries
Over the last decade reliance on battery technology has increased exceedingly, since the demand
for portability in performing daily activities kept growing. Nowadays, lithium-ion batteries are
one of the most popular energy storage technologies for sustainable energy sources due to their
light weight, compact size, high energy density, high power density and the ability to be
recharged and re-used many times [1].
There is an intense and rapid development of batteries; not only in terms of the improvement of
their electrical performance, energy and power density, but also safety and production costs.
Despite all the advances in battery science and R&D, new materials, still, need to be developed
to meet the demands for portable electronic, power tools and transportation. The three most
critical factors which affect the overall feasibility of the Li-ion batteries are the performance,
cost and durability of energy storage.
In an electrochemical cell during the charge and discharge process, Li ions transfer across an
electrolyte between the anode and cathode with oxidation and reduction occurring at the two
electrodes as shown in Fig. 1.1. During these redox reactions at the anode and cathode, electrical
energy is generated via conversion of chemical energy. Because the reactions that occur at the
anode are, in general, at lower potentials than at the cathode, the terms negative and positive
2
Figure 1.1: Schematic of lithium-ion battery showing possible anode, cathode and electrolyte materials.
A Li-ion rechargeable battery is, also, known as a “swing” battery since two-way movement of
lithium ions between anode and cathode via the electrolyte during charging and discharging
occurs. Both electrodes allow lithium ions to move in and out of their interiors. During insertion
or intercalation, ions move into the electrode while during the reverse process, extraction or
deintercalation, ions move back out from the electrode [3]. Lithium ions can also be accumulated
at the electrodes as the result of phase formation and conversion reactions.
Before we continue it is important to clarify some terminology from the literature. In lithium ion
batteries the main parameter of interest for electrode material performance is typically "capacity"
(1). This term generally refers to specific capacity, gravimetric capacity or mass capacity
denoting charge per mass (mAh/g). This value is often cited because it can be calculated easily
with reasonable accuracy and is important for weight sensitive applications. The mass in this
term is only the mass of active material of the particular electrode, not including additional mass
for example from binders or collector foils. In many applications it is important for an electrode
material to show good performance at a sufficiently high mass loading. In this case another term
is specified, the "volumetric capacity" or charge per volume (mAh/cm3) which can be calculated
from specific capacity, mass loading and the thickness of the electrode active material. Since
each electrode undergoes both charge then discharge there are capacities associated with both
processes, and they may differ significantly. The ratio of the capacities for the two processes in a
3 1.1.1.1 Negative Electrode Materials: Aluminum
The anode is the electrode where the oxidative chemical reactions takes place that give up
electrons to the external circuit. In batteries, this makes the anode a negative electrode. The
negative electrode material most widely used in today’s Li ion batteries is graphitic carbon, also
a layered material [4]. However, these materials, still, suffer from poor mechanical properties
and relatively low theoretical mass capacity [5].
Many investigations have been conducted to develop new electrode materials in order to provide
high power, large capacity, high rate capability and safety for the next generation of Li-ion
batteries. If such an electrode is associated with a proper structure/material design to reduce the
need for a separator membrane, binders, conductive additives, or current collectors, it is possible
to amplify the overall battery energy density.
Silicon and tin were recently reported as higher theoretical capacity anode materials for Li-ion
systems. While Si and SnO2 anodic materials may offer very high theoretical mass or volumetric
capacities, they suffer from severe irreversible capacity loss during the discharge of the first
cycle [6, 7]. Therefore, one needs to continue looking for other possible replacement for graphite
in Li-ion batteries.
The traditional method for alloying lithium with other metals including aluminum was mixing
the metals in liquid condition at temperatures above their melting point [8]. In 1971, Dey
succeeded in electrochemical alloying of metallic lithium with various metals by using lithium
salts in organic carbonate electrolytes at room temperature through spontaneous reactions with
high coulombic efficiency [9]. Electrochemical alloying is a more feasible method to prepare
lithium alloys with metals like Sn and Al containing the same intermetallic phases and
stoichiometry as thermally produced alloys. On the other hand, lithium and alloys like stainless
steel and metals like copper do not form such alloys, which is the reason why these materials are
widely used as common current collectors in both primary and secondary lithium batteries.
Considering the low cost, wide availability, high conductivity, mechanical stability and low
environmental impact of aluminum, many researchers focused on exploring aluminum anodes as
4
Studies of Al anodes in lithium ion batteries over the past 15 years have revealed that a LiAl
alloy phase is formed during lithiation/delithiation in aprotic polar carbonate solvents at room
temperature [9-12]. To illustrate the electrochemical alloying behavior of LiAl at room
temperature more clearly, Fig. 1.2 shows a plot of the lithium chemical potential (in eV) versus
the mole fraction of lithium in the LiAl system [13]. Overlaid near the top of the graph are the
charge and discharge curves for formation and dissolution of LiAl on an Al foil electrode from
an organic carbonate electrolyte with a lithium salt. The formation of LiAl phase at room
temperature will be important in describing the mechanism of lithiation/delithiation for the
rechargeable Al based lithium-ion batteries with solid polymer electrolyte described in this work.
Figure 1.2: Chemical potential of Li as a function of mole fraction in Li/Al, from ref.[13].
1.1.1.2 Positive Electrode Materials
The cathode of a battery is the positive electrode which gains electrons from the external circuit
and is reduced during the electrochemical reaction.
The positive electrode materials in a rechargeable lithium ion battery need to meet some crucial
requirements to be successfully used [14]: the material should contain a readily
reducible/oxidizable element; for example, a transition metal; the material should react with
lithium ion in a reversible manner, very rapidly both on insertion and removal, and at high
positive potentials. A lithium ion cell should be assembled in the discharge state; therefore, the
cathode must act as a source of lithium which requires the use of air-stable lithiated intercalation
5
reversible reactions, little bonding and structural modification during the charge-discharge
process [15].
So-called intercalation compounds, specifically lithiated transition metal oxides, are usually used
in lithium ion cells. An intercalation compound can interact with cations and electrons from
external sources, forming a new compound in which the structural elements of the initial
compound are maintained. Lithium ions act as guest species that can be inserted in the host
lattice during discharge and extracted from the host with little structural modification [16].
Recently, transition metal phosphates such as olivine (LiFePO4) and other lithium
transition-metal phosphates, including vanadium, were demonstrated as possible candidates for cathode
materials [17]. The most common cathode materials are summarized in Table 1.1 [18].
Table 1.1: Electrochemical parameters of several cathode materials.
These materials are particularly attractive because of their low cost and perceived
thermodynamic and kinetic stability. The crystal structure of olivine LiFePO4 is shown in Fig.
1.3 [19], the olivine host FePO4 allows a reversible insertion of Li to LiFePO4 with a theoretical
6
Figure 1.3: The crystal structure of olivine LiFePO4 [20].
1.1.1.3 Electrolyte
In the charge-discharge process, lithium ions are inserted in to or extracted from the active
materials of the anode and the cathode. Conceptually, the electrolyte should undergo no net
chemical changes during the operation of the battery, and all Faradic processes are expected to
occur within the electrodes. Therefore, in an oversimplified expression, an electrolyte could be
viewed as the inert component in the battery, which must demonstrate stability against both
cathode and anode surfaces. The electrolyte must have good ionic conductivity, but not be
electronically conductive, as it would, otherwise, cause internal short-circuiting [21].
For a commercial Li-ion battery, the cell materials and design need to satisfy mechanical and
chemical stability, high energy and power density, extensive operation temperature, safety and
affordability which are some of the significant challenges in this area [22].
Four types of electrolytes have been used in lithium ion batteries: liquid electrolytes, polymer gel
electrolytes, solid polymer electrolytes and ceramic electrolytes. Most of the Li-ion batteries use
7
which dissolves in a mixture of organic alkyl carbonate solvents that are liquid at room
temperature, like ethylene (EC), dimethyl (DMC), diethyl (DEC) and ethylmethyl (EMC)
carbonate to yield high ionic and electronic conductivity. The presence of these high vapor
pressure, toxic, flammable liquids requires expensive and heavy stainless steel hermetic seals to
prevent leakage. This not only adds to the packaging cost and lowers the energy density, but also
limits the design of thin flexible shapes and sizes. Moreover, many of these organic solvents
have undesirably high reactivity towards electrodes [23].
Polymer gel electrolytes compose another category of electrolytes whose mechanical integrity is
retained by crystalline phases while amorphous phase of semi-crystalline polymer is swollen by
conventional liquid electrolytes (60-95%). The ionic conductivity of polymer gel electrolytes is
less than that of liquid ones by 2-5 times which, still, suffices for an electrolyte in a lithium ion
battery. Some examples of polymer gel electrolytes include poly(ethylene oxide) (PEO) [24],
poly(acrylonitrile) (PAN) [25], poly(methylmethacrylate) (PMMA) [26], and poly(vinylidene
fluoride) (PVdF) [27]. Similar to liquid electrolytes, polymer gel electrolytes, also, suffer from
the presence of considerable amounts of volatile/reactive solvents.
Ceramic or glassy electrolytes are used in applications like microelectronics since they need to
tolerate solder re-flow conditions typical for such applications (250oC in air or nitrogen for 10 minutes). They are produced by techniques common to the microelectronics industry (sputtering,
vacuum evaporation, etc.) to form all solid state thin film batteries. Although the concentration
of Li+ in glasses is low, its conductivity is sufficient for these applications; also, many oxidizing species could be employed as positive electrodes [28-29].
Development of safe electrolytes with high ionic conductivity, a wide electrochemical window,
and high stability at both electrodes is one of the prime needs in the field of Li-ion batteries
today. Solid polymer electrolytes (SPEs) are formed by incorporating lithium salts into polymer
matrices and casting them into thin films. There are several possible advantages with the solid
polymer electrolyte compared to conventional liquid ones [30]. First and foremost, the SPE may
function as a separator in a cell isolating the negative and positive electrodes from each other and
preventing the cathode reaction products from diffusing to the anode side. In addition, it solves
8
easy processability, a good cycle life, and flexible geometry. Compared to liquid electrolytes,
solid polymer electrolytes show lower ionic conductivities and lower lithium-ion transport
numbers (<0.3), yet they are less reactive towards electrodes [31-32].
In the past two decades, poly(ethylene oxide) (PEO) has emerged as a major polymer host matrix
used in SPEs, and significant research efforts have been devoted to the development and
improvement of PEO based SPEs. PEO features a high dielectric constant, strong lithium ion
solvating ability and a glass transition temperature well below zero (around -60°C), which makes
it a strong candidate to become a leading solid polymer electrolyte for Li-ion batteries [33-37].
At the same time, PEO-based polymer electrolytes have problems associated with low ionic
conductivities (<10-4 S/cm) at the near ambient operating temperatures desired for Li-ion battery applications, which is due to PEO’s high degree of crystallinity (60-70%) and the regularity of
the backbone at room temperature. The conduction of PEO-based solid polymer electrolytes is
mainly through the ion hopping along the polymer chain assisted by the ether oxygen and in
most of the cases it takes place in the amorphous region along with the long range segmental
motion of the polymer chains [38, 39].
The general rule of SPE design is to suppress the PEO crystallinity in order to maximize the
mobile phase for ion conduction. Such strategies include blending high molecular weight PEO
with polymers having a high glass transition temperature, such as polystyrene [40], poly(methyl
methacrylates) [41, 42], poly(vinyl acetate) [43], polyacryloamides [44]. Several reports have
indicated improvements in the ionic conductivity due to the enhanced segmental motion of
amorphous regions and interfacial stability of PEO-based polymer electrolytes by the
incorporation of these polymers [45-47].
Certain ceramic nanoparticles such as TiO2, SiO2 and Al2O3 were shown to be able to impede the
PEO recrystallization process, as well as to provide specific conducting pathways along the
PEO-ceramic interface and stabilize the lithium interface more efficiently. Moreover, these
nanoparticles were also found to compensate and even improve the mechanical strength of solid
polymer electrolyte lost due to a decrease in the degree of crystallization [32, 37, 48-51].
Although the short-term tests (several days) at room temperature illustrated the stability of ionic
9
specific role of ceramic fillers is still under debate since contradictory results have been
published in the literature [52-55].
Thus, one approach to prepare room temperature solid-state polymer electrolytes is to investigate
composite (one polymer, one inorganic material) or blended (two polymers) solid electrolytes, in
which the mechanical strength derives from one component, and the conductivity from the other
component.
Overall, the impact of crystallization on ion conduction is not a simple matter due to complicated
phase morphologies of semicrystalline SPEs, which are highly dependent on salt concentration,
anions, and thermal history of material [56-59]. Considering the superior mechanical properties
of semicrystalline polymers, they could be used in high performance SPEs which would compete
with PEO based block-copolymer electrolytes and other nanocomposite SPEs, provided that the
ion conductivity could be controlled and improved.
1.2 Objectives
The objective of the dissertation study is to develop solid PEO-based polymer electrolytes with
improved ionic conductivity at ambient temperature, to fabricate the prototypes of novel Li ion
batteries using these SPEs, and to evaluate the performance of the electrolytes and battery
prototypes using them.
1.3 Contributions
This thesis is divided into 6 chapters. Chapter 1 describes the general background, motivation
and objectives of this research. Chapter 2 gives a detailed literature review on the history, ion
conduction mechanism and state-of-the-art of the development of SPEs. Chapter 3 discusses the
materials and methods, characterization techniques, and experimental setups employed in this
research. Chapter 4 presents the effect of poly(vinyl acetate) (PVAc) and TiO2 on PEO-based
solid polymer electrolyte at room temperature and formulate the best blend-based composite
electrolyte with the optimum amount of PVAc and TiO2. Chapter 5 presents the main properties
of the Li ion battery prototypes made using selected solid polymer electrolytes and discusses the
10
with the best performance. Chapter 6 includes conclusion of the outcomes from this thesis and
recommendations for future work.
1.4 References
1. Armand, M.; Tarascon, J. M., Nature, 2008,451, 7179, 652-7. 2. Horiba, T., Proceedings of the IEEE, 2014,102, 6, 939-950.
3. Wang, Q.; Ping, P.; Zhao, X.; Chu, G.; Sun, J.; Chen, C., Journal of Power Sources, 2012, 208, 210-224.
4. Wakihara, M., Materials Science and Engineering: R: Reports, 2001,33, 4, 109-134.
5. Winter, M.; Besenhard, J. O.; Spahr, M. E.; Novák, P., Advanced Materials, 1998, 10, 10, 725-763.
6. Courtney, I. A.; Dahn, J. R., Journal of The Electrochemical Society, 1997, 144, 6, 2045-2052.
7. Wang, J.; Wang, H.; Zhang, B.; Wang, Y.; Lu, S.; Zhang, X., Electrochimica Acta, 2015, 176, 321-326.
8. Li, Q.; Bjerrum, N. J., Journal of Power Sources, 2002,110, 1, 1-10.
9. Nitta, N.; Yushin, G., Particle & Particle Systems Characterization, 2014,31, 3, 317-336. 10. Lindsay, M. J.; Wang, G. X.; Liu, H. K., Journal of Power Sources, 2003,119–121, 84-87. 11. Lei, X.; Xiang, J.; Ma, X.; Wang, C.; Sun, J., Journal of Power Sources, 2007,166, 2,
509-513.
12. Au, M.; McWhorter, S.; Ajo, H.; Adams, T.; Zhao, Y.; Gibbs, J., Journal of Power Sources,
2010,195, 10, 3333-3337.
13. Owen, J. R.; Maskell, W. C.; Steele, B. C. H.; Nielsen, T. S.; Sørensen, O. T., Solid State Ionics, 1984,13, 4, 329-334.
14. Whittingham, M. S., Chemical Reviews, 2004,104, 10, 4271-4302.
15. Linden, D. R., T. B. , Handbook of Batteries. Third ed.; McGraw-Hill Inc.: New York, 2001. 16. Tarascon, J. M.; Armand, M., Nature, 2001,414, 6861, 359-67.
17. Kudryavtsev, E. N.; Sibiryakov, R. V.; Agafonov, D. V.; Naraev, V. N.; Bobyl’, A. V.,
Russian Journal of Applied Chemistry, 2012,85, 6, 879-882.
18. Dunn, J., James, C, Gaines, LL, Gallagher, K, Dai, Q, Kelly, JC Material and Energy Flows in the Production of Cathode and Anode Materials for Lithium Ion Batteries; ANL/ESD-14/10 Rev.; Argonne National Laboratory: Argonne, IL USA, 2015.
19. Whittingham, M. S.; Song, Y.; Lutta, S.; Zavalij, P. Y.; Chernova, N. A., Journal of Materials Chemistry, 2005,15, 33, 3362-3379.
20. Yuan, L.-X.; Wang, Z.-H.; Zhang, W.-X.; Hu, X.-L.; Chen, J.-T.; Huang, Y.-H.; Goodenough, J. B., Energy & Environmental Science, 2011,4, 2, 269-284.
21. Xu, K., Chemical Reviews, 2004,104, 10, 4303-4418.
22. Andreev, Y. G.; Bruce, P. G., Electrochimica Acta, 2000,45, 1417-1423. 23. Baril, D.; Michot, C.; Armand, M., Solid State Ionics, 1997,94, 1, 35-47.
24. Appetecchi, G. B.; Aihara, Y.; Scrosati, B., Journal of The Electrochemical Society, 2003, 150, 3, A301-A305.
11
26. Stallworth, P. E.; Greenbaum, S. G.; Croce, F.; Slane, S.; Salomon, M., Electrochimica Acta, 1995,40, 13, 2137-2141.
27. Choe, H. S.; Giaccai, J.; Alamgir, M.; Abraham, K. M., Electrochimica Acta, 1995, 40, 13, 2289-2293.
28. Adachi, G.-y.; Imanaka, N.; Aono, H., Advanced Materials, 1996,8, 2, 127-135.
29. Bouchet, R.; Miller, S.; Duclot, M.; Souquet, J. L., Solid State Ionics, 2001,145, 1–4, 69-78. 30. Fergus, J. W., Journal of Power Sources, 2010,195, 15, 4554-4569.
31. Armand, M., Solid State Ionics, 1994,69, 3, 309-319.
32. Croce, F.; Appetecchi, G. B.; Persi, L.; Scrosati, B., Nature, 1998,394, 6692, 456-458. 33. Armand, M., Solid State Ionics, 1983,9, 745-754.
34. Armand, M. B., Annual Review of Materials Science, 1986,16, 1, 245-261. 35. Armand, M., Advanced Materials, 1990,2, 6-7, 278-286.
36. Hickner, M. A., Materials Today, 2010,13, 5, 34-41.
37. Di Noto, V.; Lavina, S.; Giffin, G. A.; Negro, E.; Scrosati, B., Electrochimica Acta, 2011, 57, 4-13.
38. Bailey Jr, F. E.; Koleske, J. V., Chapter 6 - PROPERTIES OF POLY(ETHYLENE OXIDE). In Poly (ethylene Oxide), Academic Press: 1976; pp 105-149.
39. Berthier, C.; Gorecki, W.; Minier, M.; Armand, M. B.; Chabagno, J. M.; Rigaud, P., Solid State Ionics, 1983,11, 1, 91-95.
40. Gray, F. M.; Vincent, C. A.; Kent, M., Solid State Ionics, 1988,28, 936-940.
41. Morita, M.; Ishikawa, M.; Matsuda, Y., Journal of Alloys and Compounds, 1997,250, 1–2, 524-527.
42. Stevens, J. R.; Such, K.; Cho, N.; Wieczorek, W., Solar Energy Materials and Solar Cells,
1995,39, 2, 223-237.
43. Baskaran, R.; Selvasekarapandian, S.; Kuwata, N.; Kawamura, J.; Hattori, T., Journal of Physics and Chemistry of Solids, 2007,68, 3, 407-412.
44. Wieczorek, W.; Such, K.; Florjanczyk, Z.; Przyluski, J., Electrochimica Acta, 1992, 37, 9, 1565-1567.
45. Gorecki, W.; Andreani, R.; Berthier, C.; Armand, M.; Mali, M.; Roos, J.; Brinkmann, D.,
Solid State Ionics, 1986,18, 295-299.
46. Radhakrishnan, C. K.; Sujith, A.; Unnikrishnan, G., Journal of Thermal Analysis and Calorimetry, 2007,90, 1, 191-199.
47. Yang, L.-Y.; Wei, D.-X.; Xu, M.; Yao, Y.-F.; Chen, Q., Angewandte Chemie International Edition, 2014,53, 14, 3631-3635.
48. Bruce, P. G.; Scrosati, B.; Tarascon, J. M., Angewandte Chemie (International ed. in English), 2008,47, 16, 2930-46.
49. Quartarone, E.; Mustarelli, P., Chemical Society Reviews, 2011,40, 5, 2525-2540. 50. Croce, F.; Persi, L.; Ronci, F.; Scrosati, B., Solid State Ionics, 2000,135, 1–4, 47-52.
51. Croce, F.; Curini, R.; Martinelli, A.; Persi, L.; Ronci, F.; Scrosati, B.; Caminiti, R., The Journal of Physical Chemistry B, 1999,103, 48, 10632-10638.
52. Best, A. S.; Adebahr, J.; Jacobsson, P.; MacFarlane, D. R.; Forsyth, M., Macromolecules,
2001,34, 13, 4549-4555.
53. Marcinek, M.; Bac, A.; Lipka, P.; Zalewska, A.; Żukowska, G.; Borkowska, R.; Wieczorek, W., The Journal of Physical Chemistry B, 2000,104, 47, 11088-11093.
54. Lim, Y.-J.; An, Y.-H.; Jo, N.-J., Nanoscale Research Letters, 2012,7, 1, 1-6.
12
56. Marcinek, M.; Syzdek, J.; Marczewski, M.; Piszcz, M.; Niedzicki, L.; Kalita, M.; Plewa-Marczewska, A.; Bitner, A.; Wieczorek, P.; Trzeciak, T.; Kasprzyk, M.; P.Łężak; Zukowska, Z.; Zalewska, A.; Wieczorek, W., Solid State Ionics, 2015,276, 107-126.
57. Fullerton-Shirey, S. K.; Maranas, J. K., Macromolecules, 2009,42, 6, 2142-2156.
58. Marzantowicz, M.; Dygas, J. R.; Krok, F.; Nowiński, J. L.; Tomaszewska, A.; Florjańczyk, Z.; Zygadło-Monikowska, E., Journal of Power Sources, 2006,159, 1, 420-430.
59. Marzantowicz, M.; Dygas, J. R.; Krok, F.; Florjańczyk, Z.; Zygadło-Monikowska, E.,
13
Chapter 2
2 AN OVERVIEW OF SOLID POLYMER ELECTROLYTES
2.1 History of solid polymer electrolytes
The development of solid polymer electrolytes (SPEs) started shortly after Wright et al. reported
the semicrystalline structure in complexes between poly(ethylene oxide) (PEO) and alkali salts in
1973 [1] followed by the studies on their electrical properties [2]; subsequently, the application
of these polymer-alkali salt complexes as solid electrolyte for the high-energy-density batteries
was proposed by Armand due to their combined solid-state electrochemistry, flexible structure
and easy processing [3]. The early mechanism to describe the correlation between morphology
and conductivity of SPEs complexes was similar to inorganic ion conductors based on ion
transportation through the polymer helices in the crystalline phase, yet it was soon replaced with
a new mechanism describing that it is the amorphous phase that accounts for the ion conduction
[4-6].
Studying the linkage between polymer segmental dynamics and ion transport largely determined
the direction of SPE development in early 1980s. Several strategies were developed in order to
inhibit polymer crystallization in SPEs by modification of the polymer structure with different
architectures, such as comb-like type with short PEO chain and cross-linked network polymers
[7-10]. Nevertheless, these approaches weakened the mechanical properties by degrading the
crystallinity of the polymer, which is against the original reasons of using robust polymer
membranes for safer battery applications. During the middle to late 1980s, tremendous efforts
were devoted to find a balance between the fast ion transport and good mechanical properties by
developing polymer blend SPEs, block copolymer SPEs and ceramic reinforced SPEs [11, 12].
Progress had been made in understanding of the SPE structure by Chatani et al. in 1987; they
used X-ray diffraction method for the first time to find more about the crystallographic structure
of a PEO:NaI 3:1 crystalline complex [13].
In the 1990s the development of “classic” PEO-based SPEs continued with efforts on increasing
14
et al. showed the advantage of using a novel “polymer in- salt” electrolyte with superior
performance [14], besides the conventional SPE systems.
Lastly, Scrosati et al. developed a class of nanocomposite SPEs with enhanced mechanical,
thermal and electrochemical stability as well as room temperature conductivity, which appear to
be promising candidates for high performance lithium battery applications [15-17]. Bruce et al.
discovered some P(EO)6LiX crystalline complexes with fast ion transport that have led to
reconsideration of the fundamentals of the ion conduction mechanism in polymer electrolytes
[18-20]. Fig. 2.1 gives a general summary of the development of the SPE systems during the last
four decades.
Figure 2.1: Summary of solid polymer electrolyte development during the last four decades adopted from ref. [21].
2.2 Fundamentals of SPE
2.2.1 Formation of polymer-lithium salt complex
At constant temperature and pressure, the dissolution of salt in any solvent, whether liquid or
15
The factors that influence the change in the enthalpy include the lattice energy of the salt (high
lattice energy for ions with high charges and small radii); the need to create coordination sites in
the polymer (both these factors lead to positive ΔH, making the dissolution less favourable), as
well as the interaction between polymer coordinating group and cation, and the electrostatic
interaction between the dissolved ions, which both lead to negative ΔH, favouring the dissolution
[22, 23].
The change in the entropy results from competition of two components. The entropy increases as
the salt crystalline lattice is broken and ions are dissolved in the polymer. The entropy decreases
as the polymer chains stiffen due to coordination with ions. This reduces the segmental motion of
the polymer. It has been reported that the decrease in entropy due to the pinning of polymer
chains is larger than the increase in entropy due to lattice breaking, and the net change in entropy
is typically negative, disfavouring salt dissolution, especially at high temperatures at which the
salt precipitates out [22, 24].
Therefore, to achieve higher room temperature conductivity, the polymer hosts should have the
glass transition temperature (Tg) as low as possible since if the Tg is low enough, more
amorphous regions should be available at ambient temperature for segmental mobility of the
polymer chain, which could favour lithium cation transport. Similar to Tg, a lower melting point
(Tm) could also produce higher ionic conductivity. Also, the polymer hosts should have the
ability to dissolve lithium salts; hence, the dielectric constant of the polymer host which is
related to the repeated unit of the polymer should be high [1, 6].
In summary, to effectively solvate the salt and form a polymer-lithium complex, the following
basic criteria need to be satisfied for the host polymers: (i) high dielectric constant (ε); (ii) high
electron-donor characteristics; polymers with high concentration of sequential polar groups on
their backbone such as ether (-O-), sulfide (-S-), amine (-N-), phosphine (-P-), carbonyl (C=O)
and cyano (C=N) are good candidates for complex formation [9, 25, 26]; (iii) appropriate
distance between coordinating centers, which is best illustrated by crown ethers [27, 28]; (iv)
flexible backbone and low steric hindrance for bond rotation; (v) the ease of synthesis and
16
Poly(ethylene oxide), PEO, is a crystalline, thermoplastic, water-soluble polymer formed by ring
opening polymerization of ethylene oxide, preferably catalyzed by bases or coordinated anionic
polymerization catalysts [29]. PEO is soluble in water and a number of common organic solvents
such as acetonitrile, anisole, chloroform, ethylene dichloride, and dimethylforamide. There are
seven crystalline units in the crystalline state of PEO polymer chain: CH2CH2O, and two helical
turns per fiber identity period [30]. The chains have dihedral symmetry, two-fold axes, one
passing through the oxygen atoms and the other bisecting the carbon-carbon bond. The
conformational assignment to internal rotation about the O-CH2, CH2-CH2, and CH2-O bonds is
trans, gauche, trans, respectively (Fig. 2.2) [22].
Figure 2.2: Poly(ethylene oxide), PEO, structure viewed; (a) parallel and (b) normal to the axis of the helix. The black and white circles represent oxygen and carbon atoms, respectively. Hydrogen and lithium atoms are not shown. Adopted from ref. [31].
Table 2.1 lists a few selected polymer hosts, their chemical formulations and thermal
characteristics. As poly[bis(methoxy ethoxy) phosphazene] (MEEP) has a low Tg , it has very
high segmental motions and flexibility at ambient temperatures. Nonetheless, due to its poor
dimensional stability, the room temperature ionic conductivity cannot reach the liquid
electrolytes level. Poly(propylene oxide) (PPO) has a less effective solvation ability compared
with PEO due to its lower dielectric constant and the stereo hindrance imposed by the additional
methyl groups [26, 32]. Among the other polymers such as polysiloxanes, and poly(ethylene
imine), all have shown certain capacity of complex formation with alkali metal salts [7, 32, 33],
but they have limited chemical stabilities and are far less competitive compared to PEO based
17
Table 2.1: Typical polymer hosts with their structure and glass and melting temperatures, reproduced from ref. [22].
Among the polymers listed, poly(ethylene oxide) PEO (CH2CH2O)n has gained by far the highest
popularity as a SPE. PEO has just the right spacing between coordinating ether oxygen atoms for
maximum ion solvation [7, 12, 14]. PEO has the solvating properties and polarizability that are
comparable to water due to the oxygen spacing in this polymer (2.88 A), which is close to that in
water (2.85 A) [34]. This makes PEO an ideal solvent for alkali metal, alkaline‐earth metal, and
transition metal cations [6]. According to the hard-soft acid-base theory, the strongest interaction
is between hard-hard and soft-soft matches. PEO can be considered a hard base and thus exhibits
the strongest solvation with hard acids or such cations as Li+, Na+, Mg2+, and Ca2+. However, unlike water, PEO is a weak solvent for anions. The most soluble anions are large, polarizable,
18
(CF3SO2)2N−, PF6−, CF3CO2−, and BF4− [26, 35-37]. The dissociation constant for these anions
follows the order below [33, 38]:
(CF3SO2)2N─> PF6 ─ > ClO4 ─ > BF4─ > CF3SO3─ > CF3CO2─
Water has a high dielectric constant of 78 at 298K; the dipoles associated with the H2O
molecules surround the ions and reduce their association and mutual interaction. However, PEO,
has a much lower dielectric constant between 5 and 8. In PEO, the ions interact strongly and
re-associate to form ion clusters or ion aggregates, especially at high salt concentrations. This
reduces the effect of ion dissociation during lattice breaking, decreases the entropy, and
disfavours the salt dissolution. In PEO/salt complexes, the cations fit within the PEO helix, and
leave empty sites around the cations to be occupied by anions [6].
2.2.2 Ion conduction mechanism in SPEs
The structure of the polymers determines their unique ion conduction mechanism. In polymers,
the long range movement of the polymer chain is restricted due to entanglement. The ion
conduction in polymers then occurs through a unique segmental motion assisted ion hopping
mechanism. Fig. 2.3 illustrates the mechanism of lithium cation transport through polymer
chains. X-ray diffraction data have shown that Li+ cations are located within the PEO helix. Each turn of the helix contains one Li+ cation coordinated by three to five ether oxygens on the PEO backbone. The movement of the Li+ cations involves breaking bonds and forming new bonds with neighbouring coordination sites assisted by the local reorganization of the PEO segments.
Berthier et al. first demonstrated the ion migration (hopping) between coordination sites in high
molecular weight semicrystalline PEO, which takes place only in the amorphous phase of the
polymer above its Tg where the chain mobility is the highest [6, 32]. This phenomenon of ion
conduction only in the amorphous domain limits lithium ion migration. The low lithium ion
mobility, represented as low ionic conductivity at ambient temperatures, is a major obstacle in
19
Figure 2.3: Schematics of segmental motion assisted Li+ cation conduction in a polymer
electrolyte, circles represent ether oxygen on PEO backbone [9].
2.2.3 Phase diagram of PEO based SPE
Since 1980s the phase behaviour and crystalline morphology of PEO-lithium salt SPEs have
been extensively studied [5, 6, 39-44]. Several phases are defined in PEO-lithium salt SPEs:
crystalline PEO phase, stoichiometric crystalline PEO-lithium complex phases, and amorphous
PEO-lithium complex phase. X-ray diffraction, NMR spectroscopy, thermal analysis, and
polarized light microscopy can be used to determine the number and type of phases depending
on the anion identity and salt concentration as well as the thermal history [42]. Three regions of
semicrystalline SPEs were defined based on the type of phases in the electrolyte at room
temperature. Semi-dilute electrolytes (O/Li molar ratio around 8-20) have the most complicated
morphology where multiple phases co-exist, including crystalline PEO, amorphous PEO-lithium
complex phase and crystalline PEO-lithium complex phases. Concentrated SPEs (or polymer in
salt) only consist of crystalline complexes with stoichiometry of 6:1, 4:1, 3:1 or 2:1 depending
on the type of anion.
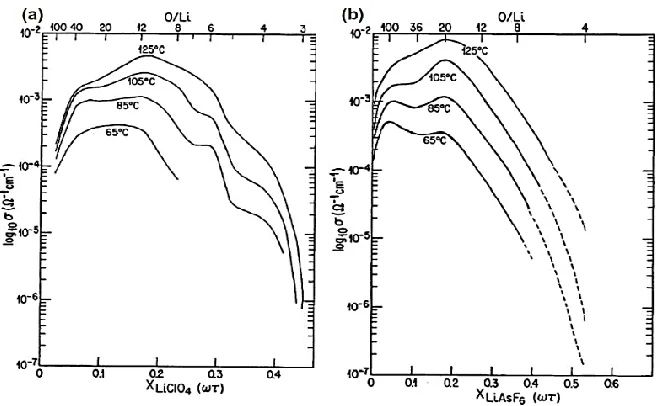
Fig. 2.4 shows the phase diagrams of two commonly studied PEO-lithium salt SPEs [42, 45].
Stoichiometric compound of 6:1 and 3:1 are found in SPEs containing LiClO4 and LiAsF6. An
eutectic with melting temperature of 50-55°C is observed for all types of SPEs at composition
range 10< O/Li molar ratio< 100. P(EO)6LiAsF6 has a melting temperature of 136°C, which is
70°C higher than that of P(EO)6LiClO4. Most P(EO)3LiX complexes have melting temperatures
20
Figure 2.4: Phase diagrams of a series PEO-LiX electrolytes: (a) PEO-LiClO4; (b)
PEO-LiAsF6; reproduced from ref. [42].
PEO crystallizes into a fringed spherulite structure in dilute SPEs due to strong interference with
lithium salts as revealed by polarized light microscopy experiments [46-48]. Lithium salts which
are not able to participate in crystal formation begin to concentrate within amorphous phases in
the intervals between spherulites and the amorphous inter-lamellar regions. Impedance
spectroscopy can be used to probe the inhomogeneity of the SPEs [49]. In semi-dilute
electrolytes, both PEO-lithium complex (salt-rich) phases and PEO (salt-poor) phases crystallize
into spherulitic morphology [39, 43]. SEM along with EDX analysis in Fig. 2.5 clearly reveal the
morphology and salt distribution in a P(EO)20LiCF3SO3 SPE [43]. Those salt-rich crystalline
complexes also exhibit regular and densely packed spherulitic morphology, but with higher
21
Figure 2.5: (a) SEM micrograph and (b) EDX sulfur map of a P(EO)20LiCF3SO3 SPE,
reproduced from ref. [43].
The overall conductivity of the polymer electrolytes is determined by (i) the number of charge
carriers; (ii) degree of charge dissociation and (iii) the interaction between the ions and the
polymer chain, all of which are strongly affected by the ion concentration. Fig. 2.6 shows that
the optimized conductivity of most SPEs at temperatures higher than melting point (Tm) is
achieved when the O/Li molar ratio is about 8-20. Due to the increased number of charge carriers
in the dilute region, the ionic conductivity increases monotonically with ion concentration.
Above the optimal concentration, the ionic conductivity decreases due to significant ion pairing
and physical crosslinking between polymer chain and Li+, as well as the formation of PEO-Li+ crystalline complex that restricts the ion mobility. At temperatures below Tm, the concentration
22
Figure 2.6: Ionic conductivity as a function of salt content at various temperatures for (a) PEO-LiClO4 system; (b) PEO-LiAsF6 system (adapted from ref. [42]).
2.2.4 Ion conduction in semi-crystalline SPEs
Ion conduction considerably decreases when linear PEO crystallization occurs. The
crystallization of linear PEO has been long viewed as unfavourable for ion conduction. Generally
speaking, the detrimental impact of crystallization can be categorized into three aspects as
illustrated in Fig. 2.7: (i) a decrease in the effective fraction of amorphous conducting phase; (ii)
restricted chain mobility (dynamic/tethered chain effect) and (iii) occurrence of more tortuous
pathways for ion transport (tortuosity effect). Until now, despite numerous studies, the exact
correlation between crystallization and ionic conductivity could not be determined as long as
those three intertwined factors restrained the efforts to achieve a quantitative analysis.
23
However, the temperature dependent conductivity plots of semicrystalline PEO SPEs are helpful
in understanding the degree of conductivity reduction as a result of PEO crystallization. Fig. 2.8
is a typical conductivity plot for a series of P(EO)nLiClO4 electrolytes. There is a “knee-like”
shape in conductivity diagrams for all concentration ranges when PEO temperature is close to the
melting point Tm (~60 to 70°C). At temperatures below the melting point, there is a 2-3 order of
magnitude drop in conductivity (down to 10-7 S.cm-1) that emanates from the decrement in the volume fraction of conducting phase, restriction of chain mobility and the increased tortuosity as
mentioned earlier; yet the quantitative contribution of individual factors could not be defined. In
these conditions, ion hopping is the dominant mechanism, whereas the segmental motion is
restricted for all SPEs.
Figure 2.8: Temperature dependent ionic conductivity for solution cast P(EO)nLiClO4
electrolytes, reproduced from ref. [42].
2.2.5 Approaches to improve ionic conductivity in SPEs
2.2.5.1 Composite SPEs
The transport properties, the resistance to crystallization and the stability of the
electrode-electrolyte interfaces of the SPE can be improved by the incorporation of certain inorganic fillers
with Lewis acid characteristics like TiO2, SiO2, or Al2O3 [12, 15, 16, 52-71]. The maximal
conductivities of SPEs after addition of nanoparticles were found to be around 10−4-10-5 S.cm-1 at 20°C [72-76]. During their early investigations, Scrosati and co-workers found that the
24
the mechanical property, interfacial stability and ionic conductivity [63]. However, the
mechanism of this enhancement was not well understood. In the subsequent studies, the ion
conduction mechanism in these nanocomposite SPEs have been systematically investigated [15,
16, 53, 55, 62, 64].
The ion conduction in P(EO)8LiClO4 nanocomposite SPEs was studied by Scrosati’s group [16].
Fig. 2.9 compares the temperature dependent conductivity curves of ceramic-free SPE with those
for nanocomposite SPEs containing 10 wt.% TiO2 (13 nm) and Al2O3 (5.8 nm) nanoparticles,
respectively. The as-cast composite SPE containing Al2O3 nanoparticles exhibits similar curve as
the ceramic-free SPE. However, subsequent cooling curves show completely different behaviour.
The conductivity “knee” around 60°C that is commonly observed for neat PEO SPEs
disappeared for both TiO2 and Al2O3 nanocomposite SPEs. The room temperature conductivities
of the nanocomposite SPEs were over 2 orders of magnitude higher than that of ceramic-free
SPE. The mechanism of this enhancement was explained as the Lewis acid interactions between
the surface of the nanoparticles, the anions and the ether oxygen on the PEO chains. The ceramic
nanoparticles with Lewis acid characteristics are competing with lithium cations to form
complexes with PEO segments and anions, which act as crosslinking centers to inhibit polymer
re-crystallization.
Figure 2.9: Temperature dependent ionic conductivity of PEO-LiClO4 ceramic-free and
25
This evidence likely suggests that the specific Lewis acid-base interactions between the ceramic
surface groups, lithium salt and the polymer segments facilitate the ion dissociation and possibly
create preferential conducting pathways at the boundaries of the ceramic particles to promote Li+ transport.
The type of functional groups on the surface of the ceramic particles plays a critical role in the
ion conduction in nanocomposite SPEs. In a study conducted by Croce et al., Al2O3
nanoparticles with different surface characteristics: acidic, neutral and basic had been
incorporated into a P(EO)20LiSO3CF3 SPE [64]. The acidic/neutral Al2O3 based SPEs showed
higher degree of conductivity enhancement over basic Al2O3 SPE. The author proposed the
mechanism to be the specific Lewis-acid interactions as illustrated in Fig. 2.10. Acidic/neutral
Al2O3 formed hydrogen bonding with the anions as well as the ether oxygen on the PEO chain,
promoting the salt dissociation and weakening the cation-polymer coordination, whereas the
basic Al2O3 could only interact with Li+. However, the study conducted by Jayathilaka et al. on a
P(EO)9LiTFSI SPE system suggested that there was no direct interaction between the filler
particles and the polymer chains. The Al2O3 particles interacted with both cations and anions,
providing additional sites for ion hopping. The degree of conductivity improvement by the
nanoparticles followed the order: acidic > basic > neutral > weakly acidic > filler free [77].
Another study on low Mw PEG LiClO4-Al2O3 system showed that the neutral fillers produced a
higher conductivity as compared with acidic and basic fillers [54]. There is no clear trend
regarding the role of surface groups and it seems the specific interactions also depend on the type
26
Figure 2.10: Illustration of the surface interaction between Al2O3 nanoparticles with
different surface characteristics and the PEO-LiSO3CF3 complex. Adapted from ref. [64].
Depending on the type of anions, the nature of the nanoparticles, the structure and Mw of the
polymer, different ion conduction mechanisms may be proposed. A better understanding of the
fundamentals of ion transport in these multiphase SPE systems still needs to be developed.
2.2.5.2 Blend polymers composite SPEs
Blending of PEO-electrolytes with other polymers has been adopted as an easy and useful
technique for suppressing crystallinity and enhancing the room temperature conductivity. The
best room temperature conductivities were found to be of the order of 10-4-10-5 S.cm-1 [78-80]. The polymer blends often exhibit properties that are superior to the properties of each individual
component polymer [81-85]. The simplicity of preparation and the ease of control of physical
properties by compositional change are the main advantages of the blend systems [86-88].
However, the miscibility of homopolymers on the molecular scale affects the superior properties.
The major advantages of blend polymer electrolytes are improved ionic conductivity, interfacial