8-19-2016 12:00 AM
Standing Up For Student Health: An Application Of The Health
Standing Up For Student Health: An Application Of The Health
Action Process Approach For Reducing Student Sedentary
Action Process Approach For Reducing Student Sedentary
Behavior.
Behavior.
Wuyou -. Sui
The University of Western Ontario
Supervisor
Dr. Harry Prapavessis
The University of Western Ontario
Graduate Program in Kinesiology
A thesis submitted in partial fulfillment of the requirements for the degree in Master of Arts © Wuyou -. Sui 2016
Follow this and additional works at: https://ir.lib.uwo.ca/etd
Part of the Behavior and Behavior Mechanisms Commons, and the Community Health and Preventive Medicine Commons
Recommended Citation Recommended Citation
Sui, Wuyou -., "Standing Up For Student Health: An Application Of The Health Action Process Approach For Reducing Student Sedentary Behavior." (2016). Electronic Thesis and Dissertation Repository. 4067.
https://ir.lib.uwo.ca/etd/4067
This Dissertation/Thesis is brought to you for free and open access by Scholarship@Western. It has been accepted for inclusion in Electronic Thesis and Dissertation Repository by an authorized administrator of
ii
Abstract and Keywords
Sedentary behavior (SB) has been associated with chronic diseases, such as hypertension and obesity; the risk appears greater the longer one engages in SB. University students are a high-risk population for excessive SB due to academic responsibilities. Increasing frequency/length of breaks from sitting is an effective way to attenuate effects of SB. The Health Action Process Approach (HAPA) is a proven health behavior change model for behaviors like nutrition, but has yet to show effectiveness for increasing non-sedentary behaviors. Forty-five university students (12 Males, Mean age 23.3) were randomized into HAPA-intervention (sedentary behavior) or HAPA-control (nutrition) groups. Occupational Student and Non-Occupational Screen Time Break Frequency and Duration were assessed at eight time points (Baseline, Week 1-6 Treatment, Follow-up). Moderate to large non-significant effects (ηρ2 = 0.10 – 0.23) were found favoring the intervention group for all measures. Findings suggest a HAPA-based intervention has potential to break up SB in university students.
iii
Acknowledgements
iv
Contents
Abstract and Keywords ... ii
Acknowledgements ... iii
List of Tables ... vii
List of Figures ... viii
List of Appendices ... ix
1. Introduction ... 1
1.1 Defining Sedentary behavior ... 1
1.2 How Much Sitting Do We Do? ... 2
1.3 Sedentary behavior as a disease ... 2
1.4 Breaking up sedentary behavior ... 4
1.5 Occupational Interventions... 6
1.6 The Health Action Process Approach (HAPA) ... 9
1.7 HAPA model as a predictor of Health Behavior ... 11
1.8 HAPA model as an intervention for increasing Physical Activity ... 11
1.9 HAPA model as an intervention for reducing sedentary behavior ... 12
Purpose ... 14
Hypothesis... 14
2. The Current Study ... 15
2.1 Methods ... 15
Participants ... 15
The modified SIT-Q 7d questionnaire ... 16
Breaks from Sitting as a Student (Primary Outcome Measures) ... 17
Breaks from Sitting while Engaged in Screen Time (Secondary Outcome Measures) ... 17
Other Measures ... 18
Time Spent Sitting ... 18
Treatment ... 20
v
Control ... 21
Health Action Process Approach (HAPA) following Canada’s Food Guide ... 21
SoSci Survey ... 21
Procedure ... 22
Statistical Analysis ... 23
Sample size calculation ... 23
Primary and secondary outcome analyses ... 24
2.2 Results ... 24
Missing Data ... 24
Data Exclusion ... 25
Fidelity check ... 25
User Statistics ... 26
Primary Outcomes – Occupational (Student) Break Frequency and Duration ... 28
Secondary Outcomes – Screen Time Break Frequency and Duration ... 32
2.3 Discussion ... 34
Occupational (Student) break frequency & duration ... 34
Non-occupational Screen time break frequency & duration ... 38
Baseline sitting profiles ... 40
2.4 Strengths, Limitation, and Future Directions ... 41
2.5 Conclusion ... 44
References ... 45
Appendix A ... 55
Recruitment Poster ... 56
Ethics Approval ... 57
Letter of Information/Consent ... 58
Appendix B ... 64
Demographics ... 65
Dietary Recall Survey ... 66
vi
Behavioral Counseling Form ... 88
Modified SIT-Q 7d Legend... 89
Legend (continued) ... 90
Appendix C ... 91
Modified SIT-Q 7d Poster ... 92
vii
List of Tables
Table 1. Means, Standard Deviations, and 95% Confidence Intervals for Frequency of Breaks from
Occupational (Student) Sitting at Each Time Point………...…28
Table 2. Means, Standard Deviations, and 95% Confidence Intervals for Duration of Breaks from
Occupational (Student) Sitting at Each Time Point………30
Table 3. Means, Standard Deviations, and 95% Confidence Intervals for Frequency of Breaks from Screen Time Sitting at Each Time Point………..32
viii
List of Figures
Figure 1 The Health Action Process Approach Model (HAPA; Schwarzer, 2008)……….10
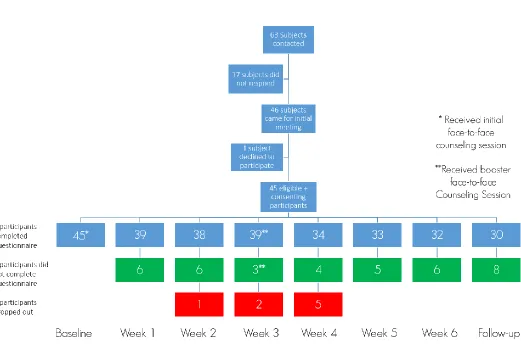
Figure 2 Flow of participants through the study……….16
Figure 3. Average weekly baseline sitting profile for intervention group participants...26
Figure 4. Average weekly baseline sitting profile for control group participants……….………27
Figure 5. Occupational Break Frequency scores throughout the study……….………….29
ix
List of Appendices
Appendix A: Recruitment Poster, Ethics Approval, and Letter of Information...……….55
Appendix B: Demographic questionnaire, Dietary Recall survey, modified SIT-Q 7d, Behavioral
Counseling form, and modified SIT-Q 7d Legend...……….64
1. Introduction
1.1
Defining Sedentary behavior
1.2
How Much Sitting Do We Do?
Guidelines for Physical Activity for most populations are, for the most part, well established. Health Canada recommends that adults (18-64) be active at least 2.5 hours a week to achieve health benefits, as well as focus on moderate to vigorous aerobic activity throughout each week (CSEP, 2012). However, guidelines for sedentary behavior are less developed, despite sedentary behaviors occupying a much larger portion of the average person’s waking day. The CSEP Canadian Physical Activity and Sedentary Behavior Guidelines do not include a section for sedentary behaviors for Adults 18-64 years, and only include one measurable recommendation for Youth 12-17 years: limiting recreational screen time to no more than 2 hours per day (CSEP, 2012). A 2014 study estimated that Canadians are sitting close to 10.8 hours a day (Carson et al.) and a 2010 study estimated Americans are sitting up to 10.2 hours a day (Owen, Sparling, Healy, Dunstan, & Matthews); time spent engaged in sedentary behaviors easily add up to over half the average adult’s waking day (Saunders, 2011).
1.3
Sedentary behavior as a disease
While excessive sedentary behaviors pose a health risk simply due to displacement of time available for higher MET activities, there are many distinct health risks associated with engaging in prolonged sedentary behaviors.
39% in healthy adults (2011). A review of 18 studies by Wilmot and colleagues (2012) found that there was a 112% increase in relative risk for diabetes, 147% increase in the risk for cardiovascular disease, and 90% increase in cardiovascular mortality associated with higher levels of sedentary behavior. Collectively, they also attributed a 49% increase in all-cause mortality from prolonged sedentary behavior.
Bed rest studies also offer insight into the deleterious effects of chronic sedentary behavior. Hamburg et al. observed a decreased insulin sensitivity, as well as increased blood pressure, dyslipidemia and impaired microvascular function in healthy volunteers after 5 days of bed rest (2007). A systematic review by Saunders et al. found evidence suggesting that uninterrupted bouts of sedentary behavior of 2 hours to 7 days results in “rapid and deleterious changes in triglyceride levels, insulin sensitivity, and glucose tolerance” (2011).
Excessive sedentary behavior has also been linked to greater cancer risk. A review by Schmid and Leitzmann (2014) found that, when comparing the highest to lowest levels of sedentary behavior, there was an increase in relative risk for colon cancer (RR=1.24, 95% confidence interval [CI] = 1.19 to 1.98) and endometrial cancer (RR=1.32, 95% CI = 1.08 to 1.61) for total sitting time, and a positive association between lung cancer and overall sitting time (RR = 1.21; 95% CI = 1.03 to 1.43).
A possible mechanism for the harmful effects of prolonged sitting comes from animal studies with mice. The work by Bey and Hamilton (2003) offer strong evidence supporting the notion that suppression of postural skeletal muscle lipoprotein lipase (LPL) activity associated with standing are what elicit these metabolic changes (e.g., insulin sensitivity, Triglyceride uptake, plasma HDL-C) during prolonged sedentary periods. Hamilton and colleagues also report that low levels of ambulatory activity can attenuate these dramatic losses in LPL activity (2004).
The risk associated with sedentary behaviors also appears to be dose dependent; the longer one
blood pressure.” (Healy et al., 2008). Interestingly, the study also found these effects persisted after adjusting for levels of moderate-to-vigorous physical activity (MVPA) during leisure time and waist circumference, suggesting that the health consequences associated with sedentary behavior are
independent from levels of regular MVPA. The deleterious effects of sedentary behavior independent of MVPA are also supported by a number of studies (Léon-Latre et al., 2014; Dunstan et al., 2012; Thorp et al., 2011; Schmid & Leitzmann, 2014; Healy et al., 2008; Henson et al., 2008; Judice et al., 2015; Biswas et al., 2015) and reviews (Proper et al., 2011). In short, those individuals who meet the MVPA
guidelines, but still engage primarily in sedentary behaviors, may be deemed ‘active’ – however, they are still at risk from their sedentary lifestyle; an “active couch potato” so to speak (Owen et al., 2010).
1.4
Breaking up sedentary behavior
Further evidence for the dose-dependent effects of sedentary behavior can be seen in the beneficial nature of breaking up sitting or taking breaks from sedentary behavior. As previously mentioned, there exist no measurable guidelines for reducing sedentary behavior for adults, or how often to break up existing sedentary behaviors. However, there are a number of studies that illustrate the benefit of breaking up prolonged sedentary behavior.
than those who stood still for 15 minutes every 30 minutes over an 8 hour period (Hawari et al., 2016). A study in older Portuguese adults found that the “odds for abdominal obesity decreased 7 % for each additional hourly break in sedentary time in women (OR=0.93, 95 % CI: 0.87-1.00), but not in men, independent of total sedentary time and moderate-to-vigorous physical activity” (Judice et al., 2014). Consistent with these studies, Swartz and colleagues (2011) found that breaking up a 30 minute bout of sedentary behavior, with either a 1, 2, or 5 minute walking period at a self-selected pace, elicited a significant positive change in energy expenditure of 3.0, 7.4, and 16.5 kcal for each trial, respectively. The authors expand on their findings, inferring that a 5 minute interruption to 30 minutes of prolonged sitting over an 8 hour period could expend an additional 132 kilocalories per day.
Beyond these relatively acute bouts of interrupting sedentary behavior, there have been longitudinal studies to suggest that breaking up sitting more frequently has pronounced health benefits. A study done by Henson and Colleagues (2013) found that amongst a group of individuals with risk factors for diabetes mellitus (n=878), breaks in sedentary time were significantly inversely associated with 2h glucose (β=−0.111± 0.055, p=0.046), waist circumference (β=−0.215±0.051, p<0.001), and BMI
(β=−0.151±0.049, p=0.003). Healy and Associates (2008) reported similar findings: a higher frequency of breaks from sitting was beneficially associated with adiposity measures, triglycerides, and 2h plasma glucose. In a study of 528 newly diagnosed type 2 diabetics, Cooper and colleagues (2012) found breaks in sedentary time were associated with lower waist circumference (B−0.15 cm [−0.24,− 0.05]; p= 0.003), and with more breaks associated with higher HDL-C.
There is ample evidence to support that simply reducing/displacing sedentary time with Light Intensity Physical Activity (LIPA) or MVPA is beneficial for health. A study by Baldwin et al. (2014) found allocating 30 minutes/day of sedentary time to either sleep, LIPA or MVPA was beneficially associated with a number of cardio-metabolic markers (e.g., insulin, HOMA-β, triglycerides). However, from an
intervention perspective, it is arguably more effective to break up existing sedentary behavior in short bouts more frequently than it is to displace relatively large amounts of sedentary time to other
1.5
Occupational Interventions
As previously mentioned, sitting is the most common sedentary behavior amongst adults, and can be the dominant daily behavior for people who have sedentary occupations. Owen and colleagues (2011) proposed an ecological model for mapping sedentary behavior determinants. In this ecological model, sedentary behavior is divided into domains (i.e., Leisure Time, Transport, Occupation, Household), with each domain encompassing unique determinants for sedentary behavior. Owen et al. also point to the importance of specificity in designing behavioral interventions to target sedentary behavior; they state: “it is expected that effective interventions will be tailored to the specific behavior, specific setting, and specific population subgroups” (2011). Thus, it can be reasonably expected that a behavioral
intervention focused on occupational or household determinants would have the greatest
impact/reduction for occupational or household sedentary time, respectively. It also stands to reason that those individuals or populations who spend considerable amounts of their waking time sitting are ideal candidates for behavioral interventions. To this end, many intervention studies have been conducted in an occupational setting – typically amongst office workers. The dose-dependent risk of sedentary behavior associates the most deleterious health effects with the longest bouts of unbroken sedentary behavior; office workers spend an estimated two-thirds of work hours sitting, with most of this time spent in unbroken bouts of at least 20 to 30 minutes (Evans et al., 2012; Ryan et al., 2011; Thorp et al., 2012), making them a high-risk population for sedentary behavior.
opposed to jointly with physical activity, produce less consistent results and report smaller reductions in sedentary behavior, than those interventions focused on sedentary behavior. These results allude to the advantage of specificity for future interventions; an intervention focused solely on sedentary behavior will likely have a greater impact on modifying said behavior, and thus a greater potential for producing clinically meaningful results.
Similarly, another review paper (19 field-based trials and 19 laboratory investigations) by Neuhaus et al. (2014) found a -77 min/8 hour change (95% CI = −120, −35 min) in occupational sedentary time with the use of sit-to-stand or activity permissive desks (e.g., treadmill desk, cycle ergometers). While the majority of health related outcomes showed no significant change, the authors note improvement for waist circumference and psychological well-being in 5/6 and 12/15 studies, respectively. These findings are supported in another review by MacEwen et al. (2015) which found a significant increase in HDL-C with the implementation of a traditional standing desk (Alkhajah et al., 2012), as well as treadmill desks (Koepp et al., 2013). Treadmill desks also showed improved total cholesterol and LDL levels over 9 months in a sample of overweight/obese office workers (Koepp et al., 2013), indicating that sedentary behavior interventions may also be effective for higher risk populations.
Another instance of sit-to-stand desk implementation was the Take-a-Stand Project (Pronk et al., 2011). Pronk and colleagues found that over 7 weeks, those in the intervention group (sit-stand device installed at their desk) reduced their occupational sitting time by 66 minutes per day over 7 weeks (p=0.03), as well as reducing upper back and neck pain by 54% (p=0.008). Interestingly, the observed effects all reverted to baseline levels within 2 weeks once the sit-stand desks were removed (p=0.027). Healy and colleagues (2013) sought to expand upon the aforementioned study by installing the same sit-stand devices, but supplementing three key messages for the intervention group: “Stand up, Sit less & Move more”. They showed a reduction of −125 min/8-h workday (95% CI: [−161, −89], p<0.001) in
As is evidenced by the findings of Healy et al. (2013), the benefit of a multi-component approach is also highlighted in a review paper by Gardner et al. (2016). The author’s critique the prevalence of
interventions focused on the modification of the built environment (e.g., sit-stand stations, treadmill desks, etc.), and discuss the dearth of studies investigating constructs like motivation or information provision, as well as identifying intervention components that may contribute to effectiveness (Michie & Abraham, 2004).
Aside from the barriers of resources and/or opportunity for sedentary behavior interventions in the workplace, psychological variables may also impact occupational sedentary behavior. A qualitative study by Cole, Tully, and Cupples (2015) found that a major barrier to reducing occupational sedentary
behavior was the perception of sitting; participants considered that standing may cause discomfort and ultimately, that the time they spent sitting reflected the volume of their work. Interviews also revealed that employee’s felt breaking up their sitting would adversely affect their work output; this was
mirrored in the perceptions of the employer who felt that accomplished workers were those who sat at their computer. However, when introduced to a mobile phone app that allowed tracking of their sedentary behavior, researchers noted a mean decrease in occupational sitting time of close to – 80 min/day. These findings are encouraging, and serve to inform future interventions in addressing perceptions of sedentary behavior.
The potential of occupational interventions may extend beyond just the targeted workplace domain. Smith and colleagues (2015) found that of a sample of office employees (n=164), workers were sitting for over 10 hours a day on both weekdays and weekends; these results suggest that there is no compensatory physical activity or reduction in sedentary time during the weekend to offset the
1.6
The Health Action Process Approach (HAPA)
Interventions grounded in well-established health behavior theories targeted at the individual level may aid in the development of robust experimental studies. Change or action theories provide frameworks that guide the development of interventions, translate concepts to messages and strategies, and form a basis for evaluation (Green, 2000). One of the challenges in conducting behavioral research is the apparent disconnect between a participant’s intention to perform a given behavior, and whether that intention elicits action, since strong intentions do not necessarily transform into behavior (Armitage, 2005); this divide between intention and action has been labeled by some researchers as “the intention-behavior gap” (Barg et al., 2012).
Although behavior change theories (Ajzen’s Theory of Planned Behavior, 1988; Roger’s Protection Motivation Theory, 1975) have been used to understand and predict sedentary behavior (e.g., Prapavessis et al., 2015; Wong et al., 2016) these theories lack post-intentional constructs that may explain this intention-behavior gap, they may not be ideal frameworks to develop a behavioral intervention around. The Health Action Process Approach, or HAPA, is a model of health behavior change that seeks to bridge the intention-behavior gap; the model does this by including post-intentional mediators of behavior (Schwarzer & Luszczynska, 2008).
Figure 1: The Health Action Process Approach Model (HAPA; Schwarzer, 2008)
coping planning tends to be reactive; individuals develop specific plans or alternate behaviors in
anticipation of potential barriers (Sniehotta, Scholz et al., 2005). Coping planning and action planning act synergistically; after individuals develop when, where, and how they will perform an action or behavior, they imagine possible barriers and develop relevant coping strategies (Schwarzer, 2008).
1.7
HAPA model as a predictor of Health Behavior
The HAPA model has shown success in predicting a number of health behaviors, such as Breast Self-examination (Luszczynska & Schwarzer, 2003), seatbelt use in adolescents (Schwarzer, Schüz, Ziegelmann, Lippke, Luszczynska, & Scholz, 2007), dental flossing (Schüz, Sniehotta, Mallach,
Wiedemann, & Schwarzer, 2009) and dietary behaviors (Schwarzer & Renner, 2000; Schwarzer et al., 2007; Renner, Kwon, Yang, Paik, Kim, Roh, Song, & Schwarzer, 2008). The HAPA model has also been used to predict physical activity. In a study with recently discharged cardiac rehabilitation patients, Sniehotta, Scholz, and Schwarzer found that 14% of physical activity variance was jointly explained by previous planning and recovery self-efficacy, 4 months after rehabilitation. A study by Lippke and colleagues (2005) amongst orthopaedic outpatients (n=423) found discontinuity patterns between patients had intention but had not acted, actors, and those who did not have intention to exercise. The results of this study support the utility of the three stage HAPA model, and inform future behavioral predictions/interventions to consider and tailor to stage-specific differences. Barg and colleagues investigated whether the HAPA could predict physical activity in a sample of inactive middle-aged women (2012). They found that perceived action self-efficacy best predicted intention while
maintenance self-efficacy was the best predictor of planning and behavior; interestingly, planning did not predict behavior, though the authors mention that no measure of coping planning was taken. Overall, the authors found that the HAPA model accounted for 15% of the variance in physical activity.
1.8
HAPA model as an intervention for increasing Physical Activity
effective for those patients who had intention to exercise, but do not meet activity guidelines. They found that those patients who had intention to exercise, but were inactive, benefited more from the planning intervention than those inactive patients who had no intention to exercise, or those patients who were previously active. They also note that those patients who had formed intentions and action plans were more successful in adhering to the recommended level of exercise. A recent study showed similar findings in cardiac rehab outpatients (n=96) in Iran (Aliabad et al., 2014). Researchers found that, when those patients with intention to continue exercise after rehab developed an action plan and coping strategies, in addition to a HAPA booklet and HAPA based training, they significantly increased both their physical activity and maximal oxygen uptake, compared to the control group.
Further evidence of the efficacy of action plans for physical activity comes from a UK study (Milne et al., 2002) involving undergraduate students (n=248) which saw an intervention group creating
“implementation strategies” (which are analogous to action planning) for when, where, and how they would increase their physical activity over the next week. The researchers found that the students who received the implementation intervention were more likely to perform exercise than either the controls who received no intervention, or the controls who were just as motivated to act, but did not create an action plan.
1.9
HAPA model as an intervention for reducing sedentary behavior
stronger-than-usual plans to limit sedentary behavior. These results are promising, as they support the validity and utility of the HAPA model in a sedentary behavior context.
With respect to interventions, a feasibility study by Kozey-Keadle et al. (2012) explored the use of a behavioral intervention on reducing objectively-measured sedentary time in a free-living, non-exercising office worker sample (n=20) over 7 days. The intervention used by the authors was primarily
information based but, while not grounded in any particular behavioral theory, did include questions pertinent to HAPA-specific constructs, such as: risk perceptions, outcome expectancies, as well as rudimentary action and coping planning. The researchers found participants significantly reduced their sitting time by 5% (p<0.01); equivalent to a 48 minute reduction in sitting time over a 16 hour waking day. In regards to number of breaks, the authors note that participants actually significantly reduced the number of breaks taken from sitting, however, they attribute these findings to the reduced sitting time yielding fewer opportunities for sit-to-stand transitions. Overall, the significance of these results support the efficacy of a behavioral intervention for reducing sedentary behavior.
Purpose
The primary purpose of this study was to determine if a HAPA based action and coping planning intervention, would increase occupational (student) break frequency and occupation (student) break duration.
A secondary purpose of this study was to determine if a HAPA based action and coping planning intervention tailored to occupation (student) break frequency and duration would affect screen time break frequency and screen time break duration, via carryover.
Hypothesis
H1: It is hypothesized that the HAPA based intervention group will report increased occupational (student) break frequency to 1 break/ 30 minutes of sitting, and increased occupational (student) break duration to 2-3 minutes/ break.
2.
The Current Study
Ethical approval was granted from Western University’s Health Sciences Research Ethics Board
(#107528; Appendix A). All participants were given the Letter of Information and gave written consent before filling out the first questionnaire.
2.1 Methods
Participants
Figure 2: Flow of participants through the study.
The modified SIT-Q 7d questionnaire
need for a domain-specific, self-report sedentary behavior questionnaire. This need is in line with previous research recommendations, which advise that: “…[self-report measures] should extend beyond measures of overall sitting to include the various domains” (Healy et al., 2011).
Breaks from Sitting as a Student (Primary Outcome Measures)
Below are the questions participants answered from the modified version of the SIT-Q 7d questionnaire.
Frequency of breaks taken from sitting as a Student – The frequency of breaks taken from
sitting as a student was measured through the following question, in the occupation section of the questionnaire: “In the last 7 days, on average, how often did you interrupt your sitting time during Occupation [Student]?” Options for the question included: Less than every 30 min, Every 30-45 min, Every 45 min-1 hour, Every 1-1.5 hours, Every 1.5-2 hours, Every 2-3 hours, Every 3-4 hours, Every 4-5 hours, Over every 5 hours, No interruption. These results correspond with a score of 1-10, respectively.
Duration of breaks taken from sitting as a Student – The duration of breaks taken from sitting
as a student was measured through the following question, in the occupation section of the questionnaire: “In the last 7 days, on average, how long were your breaks from sitting during
Occupation [Student]?” Options for the question included: Less than 30 sec, 30 sec-1 min, 1-2 min, 2-3 min, 3-4 min, 4-5 min, 5-10 min, 10-15 min, 15-30 min, Over 30 min. These results correspond with a score of 1-10, respectively.
Breaks from Sitting while Engaged in Screen Time (Secondary Outcome Measures
)
Below are the questions participants answered from the modified version of the SIT-Q 7d questionnaire.
Frequency of breaks taken from sitting while engaged in Screen Time – The frequency of
min, Every 30-45 min, Every 45 min-1 hour, Every 1-1.5 hours, Every 1.5-2 hours, Every 2-3 hours, Every 3-4 hours, Every 4-5 hours, Over every 5 hours, No interruption.
Duration of breaks taken from sitting while engaged in Screen Time – The duration of breaks
taken from sitting during screen time was measured through the following question, in the Screen Time section of the questionnaire: “In the last 7 days, on average, how long were your breaks from sitting while engaged in Screen Time?” Options for the question included: Less than 30 sec, 30 sec-1 min, 1-2 min, 2-3 min, 3-4 min, 4-5 min, 5-10 min, 10-15 min, 15-30 min, More than 30 min.
Other Measures
Demographics – The following demographic information was obtained: name, age, phone
number, gender. Ethnicity, level of education, program of study, and year of study were also asked in a follow-up survey, but was optional to answer.
Dietary Recall – Participants first filled out a dietary recall questionnaire (Appendix B), which
asked for the number of servings of each food group (i.e., grains, fruits & vegetables, dairy, meat & alternatives, and fats & oils) that the participant consumed over the 7 days, divided into breakfast, lunch and dinner. Servings were compared with those recommended by Canada’s Food Guide.
Time Spent Sitting
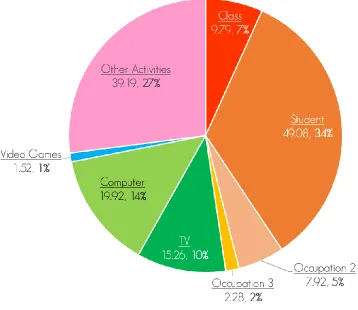
The modified version of the SIT-Q questionnaire was also used to obtain a baseline sitting profile of participants who enrolled in the present study (Figure 3 & 4). Below are the questions participants answered.
Time spent sitting in Occupation 1 (Student) – The time spent sitting in Occupation 1 (student)
was measured through the following question: “How much time per day did you spend sitting doing occupation 1?”. This score was used to inform an overall average baseline sitting profile (Figure 3 & 4).
Time spent sitting in Occupation 2 – The time spent sitting in Occupation 2 (i.e., work or
sitting doing occupation 2?”. This score was used to inform an overall average baseline sitting profile (Figure 3 & 4).
Time spent sitting in Occupation 3 – The time spent sitting in Occupation 3 (i.e., work or
volunteering) was measured through the following question: “How much time per day did you spend sitting doing occupation 3?”. This score was used to inform an overall average baseline sitting profile (Figure 3 & 4).
Weekday/Weekend time spent sitting while watching TV – The Weekday/Weekend time spent
sitting while watching TV was measured through the following question(s): “How long did you spend sitting while watching TV/DVD/Netflix on a [weekday or weekend day]?”. These scores were used to inform an overall average baseline sitting profile (Figure 3 & 4).
Weekday/Weekend time spent sitting using the computer – The Weekday/Weekend time
spent sitting while using the computer was measured through the following question(s): “How long did you spend sitting while using computer (apart from occ.) on a [weekday or weekend day]?”. These scores were used to inform an overall average baseline sitting profile (Figure 3 & 4).
Weekday/Weekend time spent sitting while playing video games - The Weekday/Weekend
time spent sitting while playing video games was measured through the following question(s): “How long did you spend sitting while playing video games on a [weekday or weekend day]?”. These scores were used to inform an overall average baseline sitting profile (Figure 3 & 4).
Time spent sitting while engaged in Other Activities – The time spent sitting while engaged in
Treatment
Health Action Process Approach (HAPA) to Break Up Sitting as a Student
Participants randomized into the Health Action Process Approach (HAPA) intervention arm of the study were given a behavioral counseling table as reference for developing strategies as part of their Action Plan (Appendix B). The table included headings drawn from the FITT principle (Appendix B): Frequency, Intensity, Time and Type. Frequency is how often a strategy should be used; Intensity is either the duration of breaks from sitting or the servings of food group, depending on the intervention; Time is when the strategy should be enacted; and Type is either the activity done during the break from sitting, or the food group, depending on the arm of the study. Additionally, in line with the HAPA model there was a section titled ‘Coping Strategy’. The researcher first discussed what the goals of the behavior were; specifically, the goal was to break up sitting as a student every 30-45 minutes with a 2-3 minute break. The researcher then asked the participant “What are some strategies that might work for you in achieving this goal?”; additionally, participants were told that strategies should be specific and realistic. If participants could not think of a strategy, the researcher would guide them into creating one;
suggesting a strategy and then asking the participant if they felt it was realistic for them to utilize. Once a strategy was identified, the researcher guided the participant through the behavioral counseling form, writing down what the participant. As an example, a participant in the intervention arm of the study may develop a strategy of setting an alarm for every 30 minutes, and stand for 2-3 minutes when the alarm goes off. The Frequency of this strategy would be every 30 minutes, the Intensity would be the duration of the break from sitting (i.e., 2-3 minutes), the Time would be during studying/being student, and Type would be either standing or walking; these strategies focused on the objective of increasing break frequency to every 30-45 minutes and achieving a break duration of 2-3 minutes, in the
were then told to keep the sheet somewhere visible and trafficked, so they would be reminded of their plan. The second booster session followed a similar format to the first counseling session, except for the initial questions. Questions posed by the researcher during this second session were: “what worked from the strategies we previously discussed?”, “what didn’t work? Why?”, and “do you foresee any unique challenges to [behavioral objective] in the next three weeks?”. The number of strategies during this second session were personalized based upon the participant’s progress towards the behavioral objective, and whether they foresaw any additional challenges in the next three weeks. Coping strategies were again developed in conjunction with each new strategy. Participants were again given this behavioral counseling form with the revised action plan and coping strategies for the next three weeks and told to display it somewhere prominent so they would be reminded of the strategies.
All counseling sessions were kept as consistent as possible, with respect to the tone, demeanor and setting of the session.
Control
Health Action Process Approach (HAPA) following Canada’s Food Guide
For those randomized into the control arm of the study, strategies focused on the objective of having participants achieve weekly food group servings in line with the age-respective recommendations of Canada’s Food Guide. Counselling session specifics (i.e., action and coping planning) for the control group were identical to the treatment group as mentioned above, except for the goals for the control group, which were to meet the weekly recommended servings for the four food groups, as outlined by Canada’s Food Guide (Health Canada, 2007).
SoSci Survey
Survey website, ensuring protection of participant information. Questionnaires are also date-specific; regardless if a participant misses or does not complete a weekly questionnaire, an entirely new questionnaire will be sent for their next respective time point in the study. SoSci survey is able to track if/when a participant has started their questionnaire, and if/when they have completed a particular questionnaire.
Procedure
Approval for the study was obtained through the Research Ethics Board of Western University (see Appendix A). Recruitment posters were distributed by the Western University Poster Patrol around the Western University campus and participants were recruited via on campus posters, emails to
participants in previous studies conducted by the EHPL, and through referrals from other participants. Interested persons contacted the researcher to arrange the initial meeting at the EHPL. Letter of Information/Consent (LOI/LOC) was emailed to potential participants; additionally, the LOI/LOC was reviewed again by participants at the initial meeting, and informed consent was obtained. After obtaining consent participants filled out a paper copy dietary recall questionnaire. The researcher left the room after explaining the survey to the participant, and returned upon completion of the survey. Participants were then emailed their first modified SIT-Q questionnaire, through SoSci, and directed to complete it online. Similar instructions were given to each participant, such as: “the questionnaire is a 7 day average, so unless the question states otherwise, average your weekly sitting time”, “some
questions are very similar, such as time spent sitting while travelling to/from work, as part of work, and
apart from work, so read the question carefully”, and “if you have any questions or need clarification on
Upon completing the questionnaire, the researcher returned to the room and implemented the appropriate behavioral counseling intervention, detailed in the treatment and control sections above. After the initial meeting, participants were told they would receive the modified SIT-Q 7d questionnaire in their email weekly, for the next two weeks, and to complete the questionnaire the day they receive it. Participants were also asked to return to the EHPL approximately 3 weeks after the initial meeting. During this meeting, participants filled out the dietary recall survey and modified SIT-Q 7d questionnaire under the same conditions as the initial meeting. After the questionnaires were completed, the
researcher conducted the second behavioral counseling intervention session, similar to the first
counseling session. Participants were again given the behavioral counseling form with the revised action plan and coping strategies for the next three weeks and told to display it somewhere prominent so they would be reminded of the strategies.
After the second meeting, participants were told they would receive the modified SIT-Q 7d in their email weekly for the next three weeks, and to complete the questionnaire the day they receive it. Participants were also told that two weeks after the last questionnaire, there would be a follow-up modified SIT-Q 7d questionnaire. Participants then received a follow-up questionnaire two weeks after their week 6 questionnaire. Figure 2 is a flow diagram illustrating the design, procedure and measures used in the present study. All questionnaires can be found in Appendix B.
Statistical Analysis
Sample size calculation
Initial power calculations were based upon a previous sedentary behavior intervention study by Cotten and Prapavessis (2016), which employed a similar repeated measures design as the present study (2x4 and 2x8, respectively). The researchers reported a non-significant group by time interaction for break frequency, with a reported effect size of ηρ2 = .05, and a sample size of 56. Cotten and Prapavessis employed a text message based intervention for increasing break frequency and duration; by contrast, the present study utilized a specific, face-to-face HAPA based intervention, with an additional
with their intervention than the present study: 5 outcome measures vs. 2 outcome measures, respectively.
Due to the increased researcher contact and face time, and the more focused nature of our
intervention, a larger effect was anticipated. Hence, G*Power software calculated a sample size of 56 participants for a medium effect size (ηρ2 = .08) with an alpha of .05 and power of .80.
Primary and secondary outcome analyses
IBM SPSS Statistics 24 software was used to analyze the collected data. A series of 2 (intervention vs. controls) x 8 (time – baseline, 1 week, 2 weeks, 3 weeks, 4 weeks, 5 weeks, 6 weeks, and follow-up) repeated measures ANOVA were used to identify possible time by group interaction effects. P-value was set at 0.05 (Tabachnick & Fidell, 1996) and partial eta squared values (ηρ2)are reported along with corresponding P values.
2.2 Results
Missing Data
Of the 360 total possible questionnaires that could have been completed, 70 questionnaires (19.40%) were either unanswered, missing, or incomplete. Of the 208 possible questionnaires for the intervention group, 37 (17.80%) were either unanswered, missing, or incomplete. 4 participants dropped out of the intervention group during the study. Of the 152 possible questionnaires for the control group, 34 (23.40%) were either unanswered, missing, or incomplete. 3 participants dropped out of the control group during the study. Applying Fisher’s exact test, a Chi-square analysis of these data indicate a non-significant difference between groups for missing data (p=0.23, two-sided).
study vs those that dropped out (all p values > 0.05). Taken together, all missing data were considered random. Hence, an intent-to-treat last observation carried forward was used to handle missing data.
Data Exclusion
A Winsorization technique was applied to any outliers in the data; data points over the 95th percentile were replaced with the value of the 95th percentile. A total of 25 data points out of 1424 outcome data points were imputed this way (13 in the intervention group and 12 in the control). This method has been show as a valid way to treat outliers by several authors (Dixon & Tukey, 1968; Tukey & McLaughlin, 1963; Guttman & Smith, 1969; Hawkins, 1980; Duan, 1998).
Fidelity check
All sedentary behavior questionnaires sent to participants could be tracked for: if/when it was sent, if/when the participant had started, and if/when the participant completed the questionnaire. All dietary recall questionnaires were completed in the EHPL lab after researcher explanation and administration of Canada’s Food Guide pamphlet. During the face-to-face counseling session,
User Statistics
Primary Outcomes – Occupational (Student) Break Frequency and Duration
Table 1: Means, Standard Deviations, and 95% Confidence Intervals for Frequency of Breaks from
Occupational (Student) Sitting at Each Time Point.
Intervention Group (n=26) Control Group (n=18)
Time Mean SD 95% CI Mean SD 95% CI
Baseline 3.50 1.42 [2.79, 4.21] 4.22 2.21 [3.37, 5.07]
1 Week 3.27 1.54 [2.56, 3.98] 3.17 2.09 [2.32, 4.02]
2 Weeks 3.19 1.23 [2.68, 3.70] 2.78 1.35 [2.17, 3.39]
3 Weeks 3.08 1.50 [2.56, 3.60] 3.44 .98 [2.82, 4.07]
4 Weeks 2.58 0.99 [2.17, 2.99] 3.35 1.11 [2.86, 3.84]
5 Weeks 2.92 1.96 [2.23, 3.62] 3.53 1.42 [2.69, 4.37]
6 Weeks 2.88 1.818 [2.107, 3.662] 4.06 2.163 [3.129, 4.999]
Follow-up 2.77 1.438 [2.202, 3.336] 3.28 1.776 [2.596, 3.959]
Scores correspond as follows: 1.00 - Less than every 30 min.; 2.00 - every 30-45 min.; 3.00 - every 45-60 min.; 4.00 - every 1-1.5 hours; 5.00 - every 1.5-2 hours; 6.00 - every 2-3 hours; 7.00 - every 3-4 hours; 8.00 - every 4-5 hours; 9.00 - over every 5 hours;
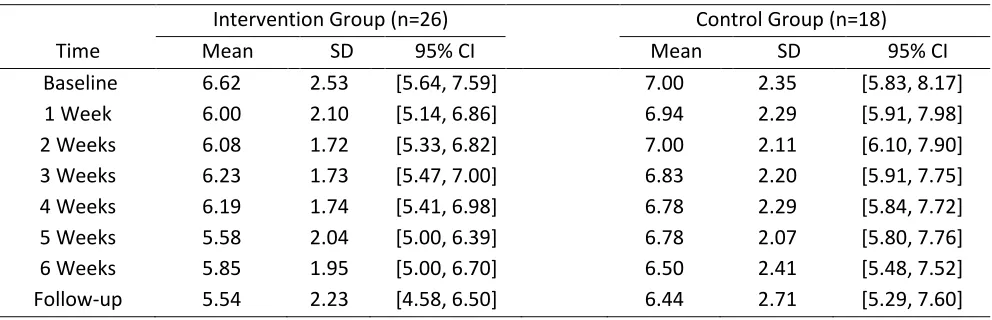
Table 2: Means, Standard Deviations, and 95% Confidence Intervals for Duration of Breaks from
Occupational (Student) Sitting at Each Time Point.
Intervention Group (n=26) Control Group (n=18)
Time Mean SD 95% CI Mean SD 95% CI
Baseline 6.62 2.53 [5.64, 7.59] 7.00 2.35 [5.83, 8.17]
1 Week 6.00 2.10 [5.14, 6.86] 6.94 2.29 [5.91, 7.98]
2 Weeks 6.08 1.72 [5.33, 6.82] 7.00 2.11 [6.10, 7.90]
3 Weeks 6.23 1.73 [5.47, 7.00] 6.83 2.20 [5.91, 7.75]
4 Weeks 6.19 1.74 [5.41, 6.98] 6.78 2.29 [5.84, 7.72]
5 Weeks 5.58 2.04 [5.00, 6.39] 6.78 2.07 [5.80, 7.76]
6 Weeks 5.85 1.95 [5.00, 6.70] 6.50 2.41 [5.48, 7.52]
Follow-up 5.54 2.23 [4.58, 6.50] 6.44 2.71 [5.29, 7.60]
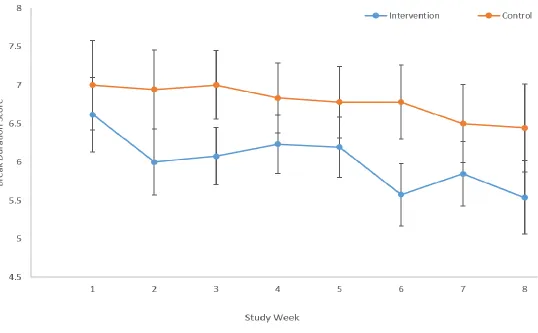
Figure 6: Occupational Break Duration scores throughout the study.
There was a moderate non-significant group by time interaction effect for occupational (student) break duration: F(7,36) = 0.59, P = 0.76, Wilks’ Λ = 0.90, ηρ2 = .10. During the intervention period, Occupational (Student) Break Duration scores for the intervention group decreased by 13.16% and increased by 7.69% for the control group; these changes roughly translate into a decreased duration of breaks from 10-15 minutes to 5-10 minutes for the intervention group, with no change in the control group.
Secondary Outcomes – Screen Time Break Frequency and Duration
Table 3: Means, Standard Deviations, and 95% Confidence Intervals for Frequency of Breaks from
Screen Time Sitting at Each Time Point.
Intervention Group (n=26) Control Group (n=19)
Time Mean SD 95% CI Mean SD 95% CI
Baseline 3.38 2.33 [2.51, 4.26] 3.42 2.04 [2.40, 4.45]
1 Week 3.96 3.19 [2.77, 5.15] 3.79 2.72 [2.40, 5.18]
2 Weeks 3.54 1.92 [2.89, 4.19] 3.21 1.13 [2.45, 3.97]
3 Weeks 3.58 2.14 [2.74, 4.42] 3.84 2.09 [2.86, 4.82]
4 Weeks 2.54 1.24 [1.84, 3.24] 3.37 2.31 [2.55, 4.19]
5 Weeks 2.50 1.18 [1.79, 3.21] 3.58 2.39 [2.75, 4.41]
6 Weeks 2.85 1.43 [2.12, 3.58] 3.74 2.31 [2.88, 4.59]
Follow-up 3.46 2.27 [2.40, 4.53] 4.26 3.19 [3.02, 5.51]
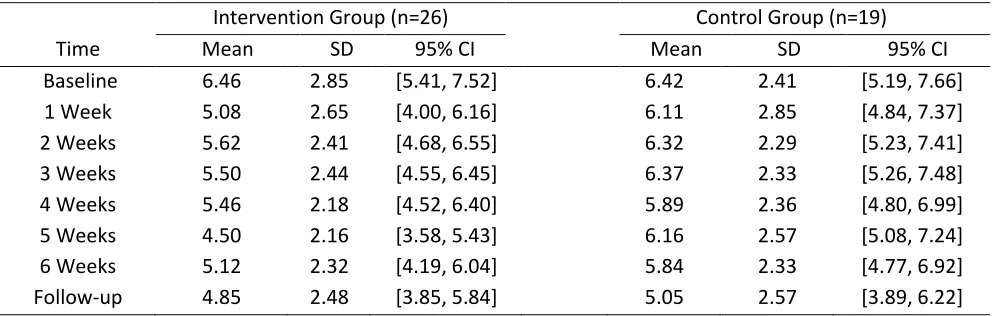
Table 4: Means, Standard Deviations, and 95% Confidence Intervals for Duration of Breaks from
Screen Time Sitting at Each Time Point.
Intervention Group (n=26) Control Group (n=19)
Time Mean SD 95% CI Mean SD 95% CI
Baseline 6.46 2.85 [5.41, 7.52] 6.42 2.41 [5.19, 7.66]
1 Week 5.08 2.65 [4.00, 6.16] 6.11 2.85 [4.84, 7.37]
2 Weeks 5.62 2.41 [4.68, 6.55] 6.32 2.29 [5.23, 7.41]
3 Weeks 5.50 2.44 [4.55, 6.45] 6.37 2.33 [5.26, 7.48]
4 Weeks 5.46 2.18 [4.52, 6.40] 5.89 2.36 [4.80, 6.99]
5 Weeks 4.50 2.16 [3.58, 5.43] 6.16 2.57 [5.08, 7.24]
6 Weeks 5.12 2.32 [4.19, 6.04] 5.84 2.33 [4.77, 6.92]
Follow-up 4.85 2.48 [3.85, 5.84] 5.05 2.57 [3.89, 6.22]
Scores correspond as follows: 1.00 - less than 30 sec.; 2.00 – 30 sec-1 min.; 3.00 – 1-2 min.; 4.00 – 2-3 min; 5.00 – 3-4 min; 6.00 – 4-5 min; 7.00 – 5-10 min; 8.00 – 10-15 min; 9.00 – 15-30 min; 10.00 – more than 30 min.
Descriptive data for the secondary outcomes are presented in Tables 3 and 4. There was a large non- significant group by time interaction effect for Screen Time Break Frequency: F(7,37) = 1.39, P = 0.24, Wilks’ Λ = 0.79, ηρ2 = .21. During the intervention period Screen Time Break Frequency scores for the intervention group increased by 18.6% and increased by 9.36% for the control group; these changes roughly translate into an increased frequency of breaks from every 1-1.5 hours to every 45 min-1 hour for the intervention group, and no change for the control group.
2.3 Discussion
The primary aim of the current study was to investigate whether a HAPA based intervention would increase occupational (student) break frequency to 1 break/ 30 minutes and increase occupational (student) break duration to 2-3 minutes. A secondary aim was to examine for potential carryover effects of the intervention that would be seen through increase non-occupational screen time break frequency and screen time break duration. Using a two arm randomized control trial, the intervention group received a face-to-face HAPA based intervention that focused on creating a personalized action plan (when, where, how) and coping strategies (overcoming barriers) for increasing break frequency and duration from sitting as a student. The control group received a face-to-face HAPA based intervention and focused on meeting Canada Food Guide recommendations. Both groups completed breaks from sitting questionnaires at baseline, at weeks one through six, and a two week follow-up. Overall, moderate to large non-significant effects that favoured the intervention group were consistently found for both occupation (student) and screen time breaks. Detailed analysis and critique of these general observations merit further discussion.
Occupational (Student) break frequency & duration
average break frequency score for the intervention group at the end of the intervention period (2.88; every 45-60 minutes) was higher than the intended score (2.00 – every 30-45 minutes), those in the intervention group still increased their break frequency in accordance with break frequency research (Dunstan et al., 2012).
The findings must be considered within the context of how sedentary behavior fluctuates in a university student population. All full-time students attending Western University experience some form of final assessment in each of their courses, as well as additional midterms or evaluations depending on the course. These periods of assessments are typically accompanied with more time spent studying outside of the classroom for most students. Due to the staggered nature of recruitment for both groups, we cannot determine when these periods occurred; however, the consistent increase in break frequency over time seen in the intervention group, as compared to the control group, suggests that even during periods of greater occupational (student) sitting, the intervention can attenuate a decrease in occupational (student) break frequency.
group were unable to continue to translate their intentions to increase their occupational (student) break frequency into action. The disparity between groups becomes most evident from week 3 onwards, after both groups received their second/booster session for their behavior. The rebound in the control group from week 3 forwards may represent the most distal moment – when pre-existing intentions can no longer facilitate action (possibly due to barriers), and the intended behavior reverts back to baseline levels.
These findings also highlight the importance of the booster session for the intervention group. From week 3 to week 6, the intervention group continues its trend of increasing occupational (student) break frequency, while the control group begins the aforementioned rebound back to baseline levels. Considering that the sole difference between groups was the nature of the face-to-face sessions (sedentary behavior or nutrition), we hypothesize that the booster session (i.e., action and coping planning) was the key facilitator in maintaining behavior change for this outcome. This explanation is in line with a study by Conroy et al. (2013), which measured the daily variations in intention for reducing sedentary behavior in a group of college students. They conclude “…intentions formed at the outset of a behavior change program may not remain as consistent as one might expect over the days and weeks that follow initial intervention delivery”, and that “future interventions that involve setting a goal for limiting sedentary behavior may benefit from the inclusion of daily booster interventions [to maintain intention]”. While the present study only included one booster session (i.e., second counseling session) at Week 3, the potentially attenuating effect of the session, for the intervention group, is evidenced by the disparity between groups at Week 3 onwards.
average weekly hours of class attended between baseline and follow-up; 9.62 and 4.25, respectively. Despite the decrease in break frequency scores for the control group from week 6 to follow-up, the lower and continued decrease in break frequency scores for the intervention group indicate some positive lingering effect from the intervention for this outcome.
With respect to break duration, from baseline to week six, the occupational (student) break duration score decreased from 6.62 to 5.85 for the intervention group, and decreased from 7.00 to 6.50 for the control group. This roughly translates into a decreased break duration from approximately 5-10 minutes to 4-5 minutes for the intervention group and no change for the control group (5-10 minutes). Although the group by time interaction effect was not statistically significant, the effect size is moderate-to-large (ηρ2 = .10) (Richardson, 2011; Cohen, 1969), suggesting that the intervention had a positive effect on this outcome measure. Similar to the occupational (student) break frequency outcome findings, this effect size suggests the present study was underpowered for duration as well.
Also similar to break frequency outcome findings, these break duration findings are potentially clinically meaningful. Recommendations for break duration vary, due to its dependence on break frequency; a shorter duration break of 2 minutes can still elicit beneficial effects if paired with frequent breaks every 30 minutes of sitting (Bailey et al., 2015; Hawari et al., 2016). Our findings of 4-5 minutes/hour of sitting are in agreement with Swartz and colleagues (2011), who recommend: “…making small changes, such as taking a five minute walking break every hour [from sitting] could yield beneficial weight control or weight loss results”. This decrease in occupational (student) break duration could be attributed to the intervention group creating an action plan and coping strategies focused on achieving an occupational (student) break duration of 2-3 minutes, or a score of 4.00. By comparison, the control group’s score remained fairly stable, decreasing only slightly over the intervention period.
presumably had intentions to change their sedentary behavior (self-selection bias), they modified their behavior by taking breaks more frequently – however, the length of their breaks remained unchanged on account of unfamiliarity with sedentary behavior break recommendations.
From week six to follow-up in week 8, the occupational (student) break duration score decreased from 5.85 to 5.54 for the intervention group, and decreased from 6.50 to 6.44 for the control group. This roughly translates into no change in break duration for the intervention group (4-5 minutes), and a decreased duration from 5-10 minutes to 4-5 minutes for the control group. The results show both groups maintaining relatively similar occupational (student) break duration, as compared to the end of the intervention period. For the intervention group, this combination of a maintained follow-up occupational (student) break frequency and duration score suggests that the intervention has some enduring effect for at least two weeks.
Overall, the results from our primary outcomes are in line with the literature. Participants in the intervention group achieved an occupational (student) break frequency score of 2.88 (every 45-60 minutes) and an occupational (student) break duration score of 5.85 (4-5 minutes). Through a text-message based intervention, Cotten and Prapavessis (2016) were able to increase overall break frequency in a sample of university student from taking breaks every 81.95 minutes of sitting to every 58.90 minutes of sitting. The researchers were also able to increase break duration from 6.71 minutes to 7.49 minutes. Similar to the present study, one of the main goals of the Cotten and Prapavessis study was to increase break frequency and duration to a 5 minute break every 30 minutes of sitting. The operationalization of our primary outcomes makes it difficult to draw direct comparisons to studies that use accelerometer data; however, based upon the literature, our findings are in line with current recommendations for break frequency (every 30-60 minutes) and duration (2-5 minutes) from sitting (Swartz et al., 2011; Owen et al., 2011).
Non-occupational Screen time break frequency & duration
change for the intervention group (every 45-60 minutes), and a decreased break frequency from every 45-60 minutes to every 1-1.5 hours. Although the group by time interaction was not statistically significant, the accompanying effect size was large (ηρ2 = .24) (Richardson, 2011; Cohen, 1969), suggesting the intervention did positively affect this outcome measure.
The relative stability in the screen time break frequency for the intervention group suggests that the intervention did have some carryover or protective effect, as the intervention group appears to have attenuated for the decrease in break frequency that the control group experienced, from week 3 to week 6. The aforementioned ‘honeymoon’ effect may offer some explanation for these findings. From baseline to week 3, the screen time break frequency scores for both groups are within recommended levels. From a HAPA perspective this may be reflective of participants’ initial intentions to reduce their sedentary behavior; these intentions, and consequent action, would not be unique to just the occupational domain, as was previously observed. However, these intentions likely could not evolve into action indefinitely; the decrease in screen time break frequency for the control group from week 3 onwards represents this diminished strength of intention, and subsequent reduction in behavior.
From week six to follow-up in week 8, the screen time break frequency score increased from 2.85 to 3.46 for the intervention group, and increased from 3.74 to 4.26 for the control group. This roughly translates into no change in screen time break frequency for the intervention group (45-60 minutes), or the control group (1-1.5 hours). The results show both groups maintaining relatively similar screen time break frequency; this suggests that potential beneficial carryover effect from the intervention can persist for at least two weeks post-study.
From week six to follow-up in week 8, the screen time break duration score decreased from 5.12 to 4.85 for the intervention group, and decreased from 5.84 to 5.05 for the control group. These values convert into relatively no change in screen time break duration for the intervention group (3-4 minutes), and an approximate decrease from 4-5 minutes to 3-4 minutes for the control group (3-4 minutes). The results show both groups maintaining relatively similar screen time break frequency; this suggests that potential beneficial carryover effect from the intervention can persist for at least two weeks post-study.
Since break duration and frequency must be taken into account together to illustrate sedentary behavior, the decrease in screen time break duration in the intervention group is mitigated by the respective increased screen time break frequency; taken together, these values (every 45-60 minutes & 3-4 minutes, respectively) are in line with recommendations for break frequency and duration (Swartz et al., 2011; Owen et al., 2011), indicating the intervention had an overall positive carryover effect for screen time breaks over the intervention period and 2 week follow-up.
Baseline sitting profiles
At baseline, participants in the intervention group averaged 9.79 hours of class and 49.08 hours of sitting as a student, per week; similarly, participants in the control group averaged 7.89 hours of class and 42.28 hours of sitting as a student, per week. These values represent school-related sedentary behavior occupying approximately 35.0% and 29.9% of the week for the average intervention and control participant, respectively. For our sample, this translates to, on average, one-third of time spent in a week due to time spent sedentary as a student. These percentages would increase even further if sleep time were taken into account.
deleterious health outcomes of excessive sedentary behavior. These findings also underscore targeting this population for intervention studies.
Though research is absent in regards to the effect of concurrent standing or LIPA on the comprehension of complex information, we hypothesize comprehension may be compromised with prescribing bouts of standing or LIPA long enough to significantly reduce overall sitting as a student. Taken together with the dose-dependent nature of sedentary behavior (Healy et al., 2008), we rationalized that changing break frequency and duration within this sitting time would be better adopted by participants (task self-efficacy), than the alternative behavior of taking much longer, extended breaks from sitting, and result in more meaningful change.
2.4 Strengths, Limitation, and Future Directions
The current study had several strengths, one of which was the use of a randomized control trial that allowed for any observed effects in the intervention group to be compared to a control group. Another strength was the use of an equal contact design in which both groups received a baseline counseling session and a 3 week booster session; this draws out the specific vs non-specific effects of treatment. The inclusion of a 2 week follow-up period to determine any residual effects of the intervention was also a strength. Incorporating the HAPA model – an evidence based theory of behavior change – into our intervention was another strength. The present study largely focused on action and coping planning as a means to shift intentions into actions, however future studies should seek to identify the effectiveness and contribution of the different constructs to the intervention (Michie & Abraham, 2004). Our findings allude to the importance of a booster session, as does previous research (Conroy et al., 2013). Integrating the text message-based work of Cotten and Prapavessis (2016) to the present study, future studies may investigate the efficacy of a HAPA-based behavioral intervention with the inclusion of personalized, regular ‘booster sessions’ delivered via text message.
recommendations for break frequency and respective duration. Given that the optimal
frequency/duration of breaks from sitting occur in relatively small amounts of time (e.g., every 30 minutes and 2-3 minutes, respectively(Dunstan et al., 2012; Swartz et al., 2011; Bailey & Locke, 2012)), it becomes important that any behavior change that results from an intervention be frequent and long enough to illicit health benefits.
A further strength of this study was the use of the modified SIT-Q 7d as a measure of sedentary behavior. The questionnaire is domain-specific, which is in line with a review on the subject of measurement in sedentary behavior research by Healy and colleagues (2011). Specifically, they recommend “For self-reported measures, monitoring should ex-tend beyond measures of overall sitting to include the various domains”. Additionally, the questionnaire is one of the only self-report measures of sedentary behavior to include domain-specific break frequency and duration questions. Both the base questionnaire and the modified version have associated reliability and validity studies (Wijndaele et al., 2014; Sui & Prapavessis, 2016), supporting the utility of the questionnaire.
There are nevertheless limitations with the present study that must be acknowledged. First, as previously stated in the discussion, the study was underpowered. Power analysis revealed six more participants were needed for significance for occupational (student) break frequency. These results should aid in informing future studies of appropriate estimates of sample size and expected effect sizes. Second, a self-report questionnaire was used as the sole measure of sedentary behavior. Being able to cross-reference the frequency/duration of breaks with objective data within certain domains would give researchers more accurate data (Healy et al., 2011), to which they can develop more specific and effective strategies for increasing non-sedentary behaviors. In addition, while the researcher encouraged questionnaires to be answered weekly, many participants forgot to answer the questionnaire, or answered within a few days of the targeted completion date, leaving open the possibility of overlap or poor recall of the intended time period. Due to the electronic nature of the weekly questionnaires, some were only partially completed, while some were initially blocked by the participant’s spam filter.
questionnaire. For instance, some wording/interpretation issues likely occurred in the last section of the questionnaire, specifically the questions that read: “How often did you break up your sitting while doing other activities?” and “How long were your breaks from sitting while doing other activities”, where “other activities” could have been misinterpreted as activities other than the ones previously mentioned (i.e., reading, chores, etc.). This confusion is evident in the missing data or highly improbable answers to these questions. A proposed revision to the question could read: “How often did you break up your sitting while engaged in the previously mentioned activities?” and “How long were your breaks from sitting while engaged in the previously mentioned activities?. One participant also neglected to include her studies as an occupation, likely due to misinterpretation of how ‘occupation’ was defined (i.e., work, study or volunteering).
Another limitation of the study was the timing of the intervention delivery. University students have both midterm and final exams or projects in their courses; these evaluations typically take place over the course of a few weeks, given that professors typically do not coordinate their evaluations with other professors. Since not every participant started the study at the same time, it is difficult to determine instances where the sedentary behavior intervention may have had an attenuating effect on, an otherwise very sedentary period of study for most students. Had the timing of exams been accounted for, a larger or protective effect of the intervention could have been observed. In addition, the length of the intervention meant that recruitment for the study could only occur for a limited period of time; if the study ran past final exams, participants would no longer be “full-time students”, and thus be ineligible. For future studies, knowing a student’s exam schedule beforehand may be beneficial for tailoring interventions and/or for more detailed data analysis.
replicate this study with other at-risk populations, such as office workers, where a HAPA based intervention could be applied (Gardner et al., 2016).
2.5 Conclusion
References
Ajzen, I. (1988). Attitudes, personality, and behavior. Chicago: Dorsey Press.
Aliabad, H. O., Vafaeinasab, M., Morowatisharifabad, M. A., Afshani, S. A., Firoozabadi, M. G., Seyed, &, & Forouzannia, K. (2014). Maintenance of Physical Activity and Exercise Capacity After
Rehabilitation in Coronary Heart Disease: A Randomized Controlled Trial. Global Journal of Health
Science, 6(6). http://doi.org/10.5539/gjhs.v6n6p198
Alkhajah, T. A., Reeves, M. M., Eakin, E. G., Winkler, E. A. H., Owen, N., & Healy, G. N. (2012). Sit-stand workstations: A pilot intervention to reduce office sitting time. American Journal of Preventive
Medicine. http://doi.org/10.1016/j.amepre.2012.05.027
Altenburg, T. M., Kist-van Holthe, J., & Chinapaw, M. J. M. (2016). Effectiveness of intervention
strategies exclusively targeting reductions in children’s sedentary time: a systematic review of the literature. International Journal of Behavioral Nutrition and Physical Activity.
http://doi.org/10.1186/s12966-016-0387-5
Armitage, C. J. (1995). Can the Theory of Planned Behavior Predict the Maintenance of Physical Activity?
Health Psychology, 24(3), 235–245. http://doi.org/10.1037/0278-6133.24.3.235
Bailey, D. P., & Locke, C. D. (2015). Breaking up prolonged sitting with light-intensity walking improves postprandial glycemia, but breaking up sitting with standing does not. Journal of Science and
Medicine in Sport. http://doi.org/10.1016/j.jsams.2014.03.008
Barg, C. J., Latimer, A. E., Pomery, E. A., Rivers, S. E., Rench, T. A., Prapavessis, H., & Salovey, P. (2012). Examining predictors of physical activity among inactive middle- aged women: An application of the health action process approach. Psychol Health, 27(7), 829–845.
http://doi.org/10.1080/08870446.2011.609595
Bey, L., & Hamilton, M. T. (2003). Suppression of skeletal muscle lipoprotein lipase activityduring physical inactivity: a molecular reason to maintaindaily low-intensity activity. The Journal of