Electronic Thesis and Dissertation Repository
7-6-2017 12:00 AM
Predictors of Re-Accessing Mental Health Services for Children
Predictors of Re-Accessing Mental Health Services for Children
and Adolescents
and Adolescents
Catalina Sarmiento
The University of Western Ontario Supervisor
Dr. Graham Reid
The University of Western Ontario Graduate Program in Psychology
A thesis submitted in partial fulfillment of the requirements for the degree in Master of Science © Catalina Sarmiento 2017
Follow this and additional works at: https://ir.lib.uwo.ca/etd Part of the Clinical Psychology Commons
Recommended Citation Recommended Citation
Sarmiento, Catalina, "Predictors of Re-Accessing Mental Health Services for Children and Adolescents" (2017). Electronic Thesis and Dissertation Repository. 4660.
https://ir.lib.uwo.ca/etd/4660
This Dissertation/Thesis is brought to you for free and open access by Scholarship@Western. It has been accepted for inclusion in Electronic Thesis and Dissertation Repository by an authorized administrator of
i
The natural history of mental health disorders suggests that a substantial number of children
experience persistent or recurrent problems and may need more than 1 episode of care. However,
there is a paucity of research on recurrent service use. The present study examined the rates and
predictors of re-accessing community-based care. Secondary data analyses were conducted on
administrative and chart review data from 5 mental health agencies in southwest, eastern, and
central Ontario. Approximately a third (30%) of children who had an episode of care re-accessed
services again within 4 years; the median time to re-access was 13 months. Social content, social
support system, illness career, and treatment system variables predicted re-accessing and time to
re-access services; although there was some inconsistency in predictors across samples. A better
understanding of the factors that influence recurrent service use may help mental health agencies
better prepare for and facilitate this process for families.
ii
First and foremost, I would like to thank my supervisor, Dr. Graham Reid. I sincerely
appreciate his mentorship, patience, and support over the past two years. His expertise and
scientific rigor have been invaluable.
Thank you to everyone who worked in the principal study, which was supported by a
grant to Reid, G.J. (Co-PI), Stewart, S.L.(Co-PI) and colleagues from the Canadian Institutes of
Health Research (#220153). This project would not have been possible without the remarkable
and comprehensive data. I want to express my gratitude to Stephanie Mowat for her assistance
with the database and always lending a sympathetic ear.
I would also like to thank my examination committee members, Dr. Nick Kuiper, Dr.
Paul Tremblay, and Dr. Evelyn Vingilis for volunteering their time and feedback. A special
thanks to Dr. Tremblay for his role in my thesis advisory committee. His expertise and guidance
were of great help in conducting this study.
Lastly, an immense thank you to my friends and family for their unwavering support and
encouragement. A special thanks to my parents, without whom I would not be where I am today.
This research was supported by a Western Graduate Research Scholarship, an Ontario
Graduate Scholarship, and a Children’s Health Research Institute Graduate Research Fellowship,
iii
Abstract... i
Acknowledgements... ii
Table of Contents... iii
List of Tables ... v
List of Figures... vii
List of Appendices... viii
List of Abbreviations ...ix
Chapter 1: Introduction... 1
1.1Patterns of Care and Re-Accessing Services ... 1
1.2 Models of Mental Health Service Use... 3
1.2.1 Behavioral Model of Health Services Use………...………3
1.2.2 Network-Episode Model ……….3
1.2.3 Revised Network-Episode Model……….……...4
1.3 Accessing Services Literature………....7
1.4 Accessing Services a Second Time Literature………....9
1.4.1 Outpatient Services……….…….9
1.4.2 Inpatient Services....………..11
1.5 Current Study ………...13
1.6 Objectives & Hypotheses……….14
Chapter 2: Methods………16
2.1 Principal Study……….16
2.1.1 Categorization of Visits.………....16
2.1.3 Brief Child and Family Phone Interview (BCFPI)………19
2.1.4 Chart reviews ………....19
2.2 Current Study ………...20
2.2.1 Study Sample.….………...20
2.2.2 Measures ………...…23
2.3 Outcome Variables.………..27
2.4 Predictor Variables and Coding.………...27
iv
2.5.3 Survival Analyses….……….…36
Chapter 3: Results ………..38
3.1 Descriptive Statistics……….………..….38
3.2 Rates and Patterns of Re-Accessing CAMH Services…….……….45
3.3 Predictors of Re-Accessing Services……….………...47
3.4 Predictors of Time to Re-Access Services……..………..58
3.5 Summary of Multinomial Logistic Regression and Cox Regression Analyses………73
3.6 Supplementary Analyses………..77
Chapter 4: Discussion……….86
4.1 Rates and Patterns of Re-Accessing CAHM services………..86
4.2 Predictors of Re-Accessing Services………....87
4.2.1 Consistent Predictors Across Samples… ……….87
4.2.2 Predictors Specific to a Sample……….88
4.2.3 Inconsistent and Non-Significant Predictors……….90
4.3 Study Strengths……….91
4.4 Study Limitations……….92
4.5 Future directions………...…94
4.6 Conclusions and Implications………..….95
References………..…...….97
Appendices………...………107
v
vi
vii
viii
Appendix A: CANS Subscale Development………107
Appendix B: Predictors of Re-Accessing Services and Time to Re-Access Services Organized by Revised Network-Episode Categories……….……….129
Appendix C: Levels of Care Classification………..131
Appendix D: Stratified Cox Regressions………..137
Appendix E: Fit Statistics for Multinomial Regressions...………139
Appendix F: Survival Curves in the BCFPI and Chart Review Samples……….142
ix
BCFPI Brief Child and Family Phone Interview
CAMH Child and Adolescent Mental Health
CAFAS Child and Adolescent Functional Assessment Scale
CANS Child and Adolescent Needs and Strengths
CFA Confirmatory Factor Analysis
EFA Exploratory Factor Analyses
FSA Forward Sortation Area
HR Hazards Ratio
ICC Intraclass Correlation Coefficient
MANOVA Multivariate Analysis of Variance
MCYS Ministry of Children and Youth Services
OR Odds Ratio
PAF Principal Axis Factoring
SD Standard Deviation
Chapter 1: Introduction
It is estimated that 20% of children have mental health problems and experience
significant distress and impairment (Merikangas et al., 2011). Mental health problems remit for some children; that is children become asymptomatic or experience minimal symptoms
(Schraeder & Reid, 2017). However, a substantial number of children experience persistent (i.e., continued) or recurrent (i.e., new episode) problems. For example, over 40% of children with attention-deficit/hyperactivity disorder continue to meet criteria as adolescents (Bussing, Mason, Bell, Porter, & Garvan, 2010), and 50% to 70% of children with depression experience a
recurrence (Schraeder & Reid, 2016).
When a child has an episode of illness, it can result in an episode of care. A series of episodes of care creates a pattern of care. The pattern of care is a function of the structure of the mental health system (i.e., providing services for a limited period of time) and families’ help-seeking behaviors (i.e., during periods of need; Sytema, Giel, & ten Horn, 1989). Several studies have examined patterns of care, including the percentage of individuals who have more than one episode of care (i.e., re-access services). These findings will be briefly reviewed.
1.1. Patterns of Care and Re-Accessing Services
Reid and colleagues (2015) examined service use across 3 agencies in Ontario that provide child and adolescent mental health (CAMH) services. The authors analyzed
Farmer and colleagues (1999) examined service use across different sectors, including education, specialty mental health, medical, juvenile justice, and child welfare. The authors analyzed data from the first year of the Great Smoky Mountains Study (N = 1007), a longitudinal epidemiological study conducted in rural regions of southeastern United States. Participants were 9, 11, or 13 years old at baseline. The authors found that 21.1% of children received services from any sector, and only 8% received services from the specialty mental health sector. Of the children who received any type of service that year, 68.1% reported prior service use during their lifetime. Thus, it appears that a substantial number of families seek services on more than one occasion. No further information was provided on recurrent service use.
Yampolskaya and colleagues (2013) studied service use at a residential mental health center for children in Florida. The authors examined administrative data of children (mean age = 13.83 years, SD = 2.32) admitted between 2004 and 2008 (N = 1432). The authors found that 19% of children were re-admitted during the 4-year study period, and 10% were re-admitted within one year of discharge (Yampolskaya et al., 2013). Other studies have found higher one-year readmission rates to psychiatric inpatient services: 26% by Lakin, Brambila, and Sigda (2008), 34% by Blader (2004), and 38% by Fontanella (2008).
may help CAMH agencies better prepare for and facilitate this process for families. The following sections review relevant models of mental health service use, and the literature on predictors of accessing services and re-accessing services.
1.2 Models of Mental Health Service Use
Several theoretical models have been developed to conceptualize how children and families access and utilize mental health services. These models tend to be broad so as to be applicable to various areas of health research, including mental health. The Behavioral Model of Health Services Use, Network-Episode Model, and Revised Network-Episode Model are
reviewed.
1.2.1 Behavioral Model of Health Services Use
The Behavioral Model of Health Service Use has been revised and expanded over the past 30 years (Andersen, 1986, 2014; Costello, Pescosolido, Angold, & Burns, 1998). The original model posited that the use of health services is influenced by three factors: (1)
predisposing: pre-existing factors that influence the likelihood of needing services (e.g., age, sex, social structure); (2) enabling: situational factors that facilitate or impede help-seeking (e.g., socio-economic factors), and (3) need: factors related to clinical status and subjective evaluation of health or mental health that influence need for services (e.g., illness severity). These factors are theorized to both independently influence the use of health services and interact with one another (Andersen, 1986, 2014).
1.2.2 Network-Episode Model
and in the treatment system. The latter includes the organization’s policies, culture and climate, and the professional-client relationship. These aspects create an environment of care, impact the work of providers, and influence clients’ reactions in treatment.
The Network-Episode Model is composed of 4 broad factors and 57 specific variables (nested within the broad factors): (1) social content includes social and geographic location (e.g., gender, income), personal health background (e.g., prior history of illness, coping style), illness characteristics (e.g., severity, duration), and organizational constraints (e.g., financing of care); (2) social support system comprises network structure (e.g., size, reciprocity), community network content (e.g., beliefs towards health), and community network functions (e.g., advice, emotional support, material support); (3) illness career involves key entrances (e.g., sick role), key exits (e.g., termination of care), and key timing and sequencing (e.g., delay and spacing of consultations); and (4) treatment system encompasses treatment network structure (e.g., size, duration), treatment network content (e.g., modality), and treatment network functions (e.g., information, material support). These four factors are posited to interact and influence the course of a child’s mental health treatment.
1.2.3 Revised Network-Episode Model
The Revised Network-Episode Model addresses these limitations (Costello et al., 1998). The four factors and 57 variables from the Network-Episode Model were retained, and 19 variables were added: (1) social content considers child, parent, and family characteristics (e.g., child psychopathology, family psychiatric history); (2) social support system includes family network, parent-child relationship, and the school system (e.g., school system beliefs); and (3) illness career incorporates family and teacher burden, parent-school communication, and parental compliance (see Figure 1.1). The Revised Network-Episode Model was used to guide the
Figure 1.1. The Revised Network-Episode Model. Adapted from “A Family Network Based Model of Access to Child Mental Health Services”. E. Costello, B. Pescosolido, A. Angold and B. Burns, 1998, Research in Community and Mental Health, 9, 172. Copyright 1998 by JAI Press Inc.
A. SOCIAL CONTENT Child
I. Social and geographic location
1. Gender 2. Age
II. Personal health background
3. Prior history of illness 4. Coping style
III. Illness characteristics
5. Severity 6. Visibility 7. Duration 8. Acute/chronic 9. Comorbidity
10. Functional impairment
Family
IV. Social and geographic location
11. Race/ethnicity 12. Parental education 13. Parental work status 14. Parental marital status 15. Parental income 16. Parental occupation 17. Rural-urban residence
V. Family health background
18. Family psychiatric history 19. Parental coping style 20. Medical insurance
VI. Organizational constraints
21. Organization of care 22. Accessibility of care 23. Financing of care
B. SOCIAL SUPPORT SYSTEM
I. Family Network II. Community/School Systems Network
Structure, content, & functions
38. Professionals and paraprofessionals 39. Powers In loco parentis
40. School system beliefs and attitudes 41. Peer group beliefs and attitudes 42. Beliefs attitudes about parents’ role 43. Information, advice, treatment, referral Structure 24. Size 25. Structure 26. Stability 27. Reciprocity 28. Strength of tie 29. Multiplexity
Content
30. Beliefs and attitudes towards health, professionals, mental health care 31. Social network 32. Parent-child relationship Functions 33. Informational 34. Advice 35. Regulation 36. Expressive or emotional support 37. Material or practical support
C. ILLNESS CAREER Recognition
44. Family burden 45. Teacher burden 46. Parent-school communication 47. Sick role
Entrance roles
48. Patient role 49. Chronic role 50. Disabled role 51. Dying career
Key exits
52. From sick role 53. Termination of care 54. Recovery
55. Death
56. To another agency 57. Aged out of access
Key timing and sequencing
58. Combination of health advisors 59. Ordering of consultations 60. Delay and spacing of consults 61. Degree and length of compliance
62. Parental compliance
D. THE TREATMENT SYSTEM Network structure
63. Size 64. Density 65. Duration 66. Reciprocity 67. Strength of time
Network content
68. Treatment effectiveness 69. Diagnostic capacity, technology 70. Modalities
71. Staff attitudes and ”culture” toward health clients, community, treatment organizations
Network function
72. Information 73. Advice 74. Regulation
1.3 Accessing Services Literature
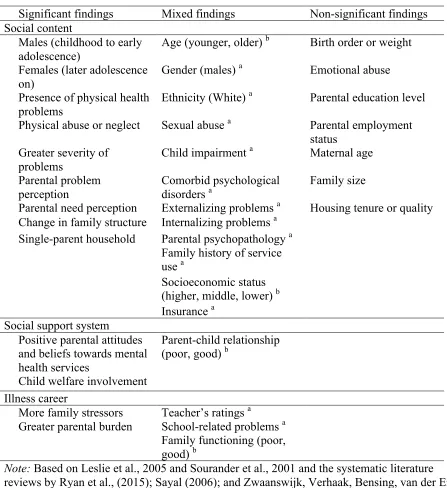
Extensive research has been conducted on accessing services. A number of variables
have been identified as predictors of accessing services, compared to children in need of services
who do not receive them, and are summarized in Table 1.1. There are some conflicting findings
regarding the statistical significance and/or direction of some of the predictors. Such predictors
have been placed in the mixed findings category and the nature of the conflicting finding is identified. For example, some studies have found that a poor parent-child relationship predicts
service use, some have found that a good parent-child relationship predicts service use, and
others have found no association (Ryan, Jorm, Toumbourou, & Lubman, 2015; review article).
The variables that predict access of services may also play a role in the recurrent use of
services. Therefore, these findings guided the selection of predictors that were examined in the
Table 1.1
Predictors of Accessing Children and Adolescent Mental Health Services Organized by Revised Network-Episode Categories
Significant findings Mixed findings Non-significant findings Social content
Males (childhood to early adolescence)
Age (younger, older) b Birth order or weight
Females (later adolescence
on) Gender (males)
a Emotional abuse
Presence of physical health problems
Ethnicity (White) a Parental education level
Physical abuse or neglect Sexual abuse a Parental employment status
Greater severity of problems
Child impairment a Maternal age
Parental problem perception
Comorbid psychological disorders a
Family size
Parental need perception Externalizing problems a Housing tenure or quality Change in family structure Internalizing problems a
Single-parent household Parental psychopathology a
Family history of service
use a
Socioeconomic status
(higher, middle, lower) b
Insurance a
Social support system Positive parental attitudes
and beliefs towards mental health services
Parent-child relationship (poor, good) b
Child welfare involvement Illness career
More family stressors Teacher’s ratings a Greater parental burden School-related problems a
Family functioning (poor,
good) b
Note: Based on Leslie et al., 2005 and Sourander et al., 2001 and the systematic literature reviews by Ryan et al., (2015); Sayal (2006); and Zwaanswijk, Verhaak, Bensing, van der Ende, and Verhulst (2003).
Mixed findings is a category used to indicate predictors for which there is conflicting findings regarding statistical significance and/or direction.
a Indicates a predictor for which there is conflicting statistical significance.
1.4 Accessing Services a Second Time Literature
The natural history of mental health problems (i.e., recurrence and persistence) suggests
that some families will have more than one episode of care. The literature on re-accessing
outpatient services is reviewed separately from inpatient services.
1.4.1 Outpatient Services
Limited knowledge exists about which families seek further outpatient treatment and the
factors that influence this decision. For this reason, the literature on adult and university student
populations were also reviewed. As few studies were identified, results for each study are
presented separately.
Kerkorian, McKay, and Bannon (2006) examined how families’ previous experiences
with CAMH services influenced their perceptions of barriers to service use in the future.
The authors conducted secondary analyses on data from a larger study that examined the factors
that influence engagement in mental health services. The sample for the principal study were
families who had been referred for services (N = 253), and the sample for the secondary study
were families who reported previous service use (n = 118, 47%). Only the data from the intake
telephone interview were utilized in the secondary study. The authors found that parents’
feelings of being disrespected by the provider predicted feelings of doubt about the utility of
treatment. Similarly, studies among high school students (Rickwood, Deane, Wilson, &
Ciarrochi, 2005) and adult populations (Deane, Skogstad, & Williams, 1999) have found that
previous negative help-seeking experiences (e.g., problems were not taken seriously) negatively
influenced future help-seeking intentions.
Dantas and colleagues (2011) examined clinical charts of undergraduate and graduate
found that 13.5% of students re-accessed services. Predictors of recurrent use of services
included: younger age at first visit (i.e., less than 20 years), studying arts or humanities, living in
residence, extended family members (e.g., grandparents) living with the family, having
half-siblings, having a younger mother (i.e., less than 55 years of age), and complaints of poor
memory and low self-esteem.
Siddall, Haffey, and Feinman (1988) examined repeated mental health service use in a
Health Maintenance Organization setting in the United States that provided therapy for
individuals, couples, family and children. During the 4-month study period, 27% of the requests
for treatment were returning clients. Interestingly, 16% of returning clients indicated that they
had not found previous therapy helpful. The disposition at discharge (i.e., conditions under
which service was terminated) were as follows: 67% mutual (client and therapist) decision to
terminate treatment, 1% referred elsewhere, 23% patient terminated treatment prematurely
(based on clinician ratings), 6% long-term treatment recommended (but client discontinued
treatment), and 26% discussed the possibility of returning (values sum > 100% as more than one
option was indicated in some cases). However, the authors did not compare individuals who
returned for services versus those who did not. This is a limitation that will be addressed in the
current study.
In summary, from the few studies that have been conducted, a number of variables appear
to predict recurrent service use (1) social content: age of mother (e.g. younger), poor memory,
and lower self-esteem; (2) social support system: extended family members (e.g., grandparents)
living with the family, and having a half-sibling; (3) treatment system: previous experience with
1.4.2 Inpatient Services
There is a significant literature on re-admission to psychiatric hospitals and residential
treatment centers. A number of variables have been identified as predictors of re-admission and
time to re-admission; Table 1.2 provides a summary of these studies. Similar to the accessing
care literature, there are some conflicting findings regarding the statistical significance and/or
direction of some of the predictors. Such predictors have been placed in the mixed findings
category and the nature of the conflicting finding is identified. For example, some studies have
found that a shorter length of stay predicts re-admission (Lakin et al., 2008; Yampolskaya et al.,
2013), some have found that a longer length of stay predicts re-admission (Fontanella, 2008;
Table 1.2
Predictors of Re-Admission to Inpatient Services Organized by Revised Network-Episode Categories
Significant Mixed findings Non-significant
Social content
Risk factors (e.g., abuse, violence, abandonment)
Ethnicity (White) a Socio-economic status
History of criminal charges Gender (females) a History of violent behavior towards others
Neuropsychiatric disturbance Age (older, younger) b Child impairment at intake Comorbid intellectual disability History of suicidal
behavior a
Comorbid psychological disorders
Externalizing problems a Parental hospitalization
Internalizing problems a Parental education level
Child impairment at
discharge a Social support system
Presence of biological mother Type of caregiver (i.e.,
biological, adoptive) Dysfunctional relationship with
their family members Parental monitoring and control
Living in a group home or assisted care
Family cohesion
Permissive parenting style Corporal punishment Illness career
Delay in receiving case management services
Parental involvement (lower) a
Medication noncompliance Family burden
Treatment system
Length of stay (shorter, longer) b
Payer source of care (e.g., public)
Prior hospitalizations a Receiving further services after discharge (e.g., outpatient, day treatment) b
Note: Mixed findings is a category used to indicate predictors for which there is conflicting findings regarding statistical significance and/or direction. Based on findings from Arnold et al., 2003; Blader, 2004; Fite, Stoppelbein, & Greening, 2009; Fontanella, 2008; Foster, 1999; James et al., 2010; Lakin et al., 2008; Stewart, Kam, & Baiden, 2013; Yampolskaya et al., 2013.
a Indicates a predictor for which there is conflicting statistical significance.
1.5 Current Study
There is a dearth of research on predictors of accessing services a second time. The
research that has been conducted on the topic has focused on inpatient services. The
generalizability of these findings to community-based CAMH services may be limited as
children who receive services from inpatient units would be expected to have more severe
psychopathology. Thus, re-admission may be more likely and the predictors of re-accessing
inpatient services may differ from community-based services. The present study addresses this
gap in the literature by examining predictors of re-accessing services using administrative data
over a 4-year period from community-based CAMH services.
Variables that have been identified as predictors in the access and re-access to care
literature were examined in the current study. Given the lack of research in the area, a number of
additional variables were included as well. The rationale for including these variables is
explained below.
First, child and caregiver strengths were included because of their relationship with the
development of psychopathology, which may also play a role in the recurrence of problems and
need for further services. Specifically, studies have shown that various child and caregiver
strengths (e.g., social competence, optimism, adequate housing, supportive parenting) act as
protective factors for the development of mental health problems (Hunsley & Lee, 2014). Within
the context of the Revised Network-Episode Model, these would fit under illness characteristics.
Second, disposition at discharge was included because of its relationship with need for services.
Research has found that children who terminate treatment prematurely (i.e., drop-out) are more
likely to experience persistent or worsening of symptoms and impairment, compared to those
Mazurick, & Siegel, 1994). There is evidence to support that greater child needs (e.g.,
psychopathology, impairment) are associated with access to services and re-admission to
inpatient units (Farmer et al., 1999; Fontanella, 2008; Sayal, 2006). Within the context of the
Revised Network-Episode Model, it would fit under termination of care. Third, the number and
spacing of visits were included because they are proxies to predictors that have been examined in
the re-admission literature. Namely, studies have found that length of stay predicts re-admission
to inpatient units (e.g., Lakin et al., 2008). In the current study, families with the same duration
of involvement differ in the number of pre-episode of care visits, number of first episode of care
visits, and spacing of visits. Therefore, all three variables were included as proxies. Within the
context of the Revised Network-Episode Model, these would fit under delay and spacing of
consults, and duration of treatment. Lastly, level of care was included because it is directly
related to treatment. Public policy and mental health literature have called for the provision of
services that address children’s needs in the least restrictive and least intensive settings (Bower
& Gilbody, 2012; Burns, Thompson, & Goldman, 1993; Ministry of Children and Youth
Services [MCYS], 2006). These services may not have been sufficient for some children, thereby
resulting in a return for further treatment. Within the context of the Revised Network-Episode
Model, it would fit under modalities of treatment.
1.6 Objectives & Hypotheses
Objective 1. Determine rates and patterns of re-accessing CAMH services.
Objective 2. Identify predictors of re-accessing CAMH services.
Objective 3. Identify predictors of the time to re-access CAMH services.
Hypotheses. Higher odds and higher risk of re-accessing services will be predicted by the
(a) Social content: younger males, older females, history of abuse (physical or sexual) or neglect,
single-parent household, lower socio-economic status (SES) profile of neighborhood, higher
levels of psychopathology (i.e., internalizing problems, externalizing problems, greater
impairment), lower child strengths, lower child relationship strengths, lower caregiver strengths,
and higher care intensity and organization needs.
(b) Social support system: child welfare involvement.
(c) Illness career: greater family burden, greater spacing of visits (i.e., inconsistent care), and
premature termination of services (i.e., drop-out).
(d) Treatment system: lower number of visits during the first episode of care, not having
Chapter 2: Methods
Secondary data analyses were conducted on data from a previous study that examined
patterns of service utilization within CAMH agencies (Reid et al., 2010). The principal study is
described first, followed by the current study.
2.1 Principal Study
Electronic administrative data were retrieved from 5 CAMH centers. The agencies were
located in rural and urban areas in southwest, eastern, and central Ontario. The centers were
accredited by Children’s Mental Health Ontario, or a similar accreditation body, and provided
services for children between 0 and 18 years of age. Data were extracted for visits between 2004
and 2010. The inclusion criteria were: (1) a first visit between 2004 and 2006, (2) children
between 5 and 13 years of age at the time of their first visit, and (3) children with at least one
in-person visit. The exclusion criteria were: (1) a developmental disorder diagnosis (e.g., autism
spectrum), or (2) participation in a program for children with developmental disabilities.
2.1.1 Categorization of Visits
Each agency provided electronic visit data that included visit date, type of contact (e.g.,
telephone, in-person), type of service (e.g., group treatment), and duration of contact. The first
in-person visit for each child was identified and data for 4 years after this date were extracted. To
categorize visits into episodes of care, the data were re-organized so that the first in-person visit
became day 1. An episode of care was defined as a minimum of 3 visits with a period of 180
days (6 months) without visits between episodes. Children could have visits that did not meet
this criterion prior to the first episode of care; these are referred to as pre-episode of care visits.
Children could also have visits that did not meet this criterion after the first episode of care; these
care) or post-episode of care visits (i.e., visits after the first episode of care, and there was no
further involvement with the agency). See Figure 2.1 for a visual representation of how visit data
were categorized.
The definition for an episode of care utilized in the current study was proposed by Reid
and colleagues (2015). The authors considered different minimum number of visits (i.e., 2, 3, 5,
7, and 9) and free-periods (i.e., 90, 120, 150, and 180 days). These operational definitions were
compared against clinician-defined start and end of an episodes of care, clinician-defined number
of episodes, and time at which standardized intake measures were completed. A definition of 3
Figure 2.1. Hypothetical visit data over the course of 700 days categorized into episodes of care.
Client 1 is an example of a client that had just two visits. Client 2 had a single episode of care consisting of 16 visits. Client 3 had a single episode of care consisting of 4 visits and 2 post-episode of care visits, the first occurring 200 days after the end of the first post-episode of care. Client 4 had 2 pre-episode of care visits, followed by a break of 200 days, a first episode of care
consisting of 3 visits, a break of 220 days, and a second episode of care consisting of 3 visits.
2.1.3 Brief Child and Family Phone Interview (BCFPI)
The BCFPI is administered to caregivers as an intake measure in all publicly funded
CAMH agencies in Ontario.BCFPI data were extracted from agencies’ records as part of the
larger study. Overall, 59% of the children who met the aforementioned inclusion criteria had a
BCFPI completed.
2.1.4 Chart reviews
A key objective of the principal study was to examine patterns of service use. Multilevel
latent class cluster analysis of the children’s visit data (N = 5632) was used to identify mutually
exclusive clusters or patterns of service use. The analysis revealed five distinct patterns: minimal
(53% of children), brief-episodic (8%), acute (20%), intensive (13%), and
ongoing/intensive-episodic (6%).
To understand these patterns of service use, a stratified random sample by age (5-9 years
and 10-13 years) and sex was selected for chart reviews (n= 25 for each pattern; n = 125 per
agency; n = 625). If a chart could not be reviewed (e.g., could not be located) or the information
in the chart was insufficient to complete ratings of child functioning (see below for a description
of the Child and Adolescent Needs and Strengths), another child’s chart was used.
Chart reviews were conducted by trained research assistants at specific time points: start
of involvement (i.e., first in-person visit), start and end of each episode of care, and end of
involvement within the study time window (i.e., last in-person visit). The start of involvement
was the same as the start of an episode of care if the next 2 visits were within 180 days (6
months) of each other (i.e., no pre-episode of care; see client 2 in Figure 2.1). The end of
involvement was the same as the end of an episode of care if the previous 2 visits were within
Information gathered and ratings completed included: (1) demographic information (e.g.,
date of birth, sex) , (2) Child and Adolescent Needs and Strengths scale (CANS; Lyons, 1999),
and (3) disposition at discharge (e.g., referred, drop out, completed treatment). Every fifth chart
(27%) was reviewed by two or three raters to assess inter-rater reliability: intraclass correlation
coefficient (ICC) = 0.84 for CANS items, 95.6% agreement for non-CANS items and 92.1%
agreement overall.
2.2 Current Study
2.2.1 Study Sample
The inclusion criteria for the present study were: (1) children who had at least one
episode of care; (2) children who had at least 180 days (6 months) between the end of the first
episode of care and the end of the study window; this criterion ensured that it was possible for
children to re-access within the study window; (3) children for whom a forward sortation area
(FSA) was available; FSA was used to determine neighborhood SES. The exclusion criteria
were: (1) children who had inter-episode of care visits (i.e., 1-2 visits between the first and
second episode of care). Inter-episode of care visits was one of the ways in which children
re-access services, but could not be explored due to sample size concerns; (2) children who had
group/foster home as the parental marital status. These children represent a population with
unique needs, but could not be examined due to the small sample size (1%).
The methodology of the principal study (i.e., chart reviews) and missing data (i.e.,
BCFPI) mean that not all variables are available for all children. The three samples that emerge
and their purpose are briefly described. See Figure 2.2 for a visual representation of participant
All electronic administrative data sample. Data from the eligible sample with
electronic administrative data (N = 3399) were used to examine rates of re-accessing services,
patterns of re-accessing services, and examine demographic (e.g., child age, child sex) and
certain treatment (e.g., number of visits, spacing of visits) predictors.
All electronic administrative data with BCFPI sample. Data for all individuals who
had a BCFPI up to 8 months prior to or 1 month after the start of the first episode of care (n =
1751) were used to examine demographic (e.g., child age, child sex), psychopathology (e.g.,
internalizing problems), impairment (e.g., child impairment, family burden), and certain
treatment (e.g., number of visits, spacing of visits) predictors.
Chart review data sample. Chart review data (n = 426) were used to examine
demographic (e.g., child age, child sex), psychopathology (e.g., internalizing problems),
impairment (e.g., child impairment), strengths (e.g., caregiver needs and strengths, child
strengths), and treatment (e.g., number of visits, spacing of visits, disposition at discharge)
Figure 2.2. Flow chart showing participant selection and the samples that were used in the current study. The three samples are identified by boxes with dotted lines. Note that 61% of children in the chart review sample had BCFPI data available. FSA = forward sortation area.
Clients with a 1stvisit in 2004 – 2006
N = 12 643
Excluded from principal study
Developmental disabilities
• n = 841 (7%) Age at 1stVisit: • < 5 = 3099 (24%)
• > 13 = 2711 (21%) Episode in previous 18 months
• n = 360 (3%)
Excluded from current study
Did not have a first episode of care
• n = 1832 (33%) Inter-episode visits
• n = 47 (0.8%)
< 180 days between end of episode of care and end of study window
• n = 112 (2%) FSA missing
• n = 165 (3%) Group/foster home
• n = 77 (1%)
Complete electronic administrative data N = 5632
BCFPI sample n = 1751
Chart review sample n = 426 All electronic administrative data sample
2.2.2 Measures
Demographics. Demographic variables obtained from the electronic administrative data included: date of birth, sex, FSA (i.e., first three characters of the postal code that designate a geographical unit), and living arrangement (e.g., single-parent, two-parent, group/foster home).
Socio-economic status profile of neighborhood. The median income for each geographic area (FSA) in Ontario were extracted from the 2006 Canadian Census. These were sorted in order by income level and then split into 5 groups (i.e., quintiles). Quintile 1 indicates lowest income level (mean = $42, 646) and quintile 5 indicates highest income level (mean = $93, 627). The quintiles were then linked to the study sample using the FSA codes from the electronic administrative data. Categorizing the population by income quintiles is an approach that has been used in other studies and by health organizations across Canada (Canadian Institude for Health Information, 2015; Cohen et al., 2016).
Brief Child and Family Phone Interview (BCFPI). The BCFPI is a 30-minute
questionnaire comprised of 81 forced-choice items that is administered to caregivers when they first contact an agency for help. Items are coded on a 3-point scale, where higher scores indicate more problems: 0 = never true; 1 = sometimes true; 2 = often true. The BCFPI has 9 mental health subscales (e.g., managing anxiety, regulating attention) and 5 composite scales (e.g., internalizing problems, externalizing problems, global child functioning, global family situation). Internal consistency (Cronbach’s alpha) ranges from 0.73 to 0.88. Test-retest reliability ranges from 0.66 to 0.78 and factor analyses support the construct validity (Cunningham, Pettingill, & Boyle, 2006).
regulation of attention and activity, cooperation, and conduct subscales), global child functioning (i.e., social participation, quality of relationships, school participation and achievement
subscales), and global family situation (i.e., family comfort, family activities subscales). T-scores were calculated using age- and sex-based population norms. For descriptive purposes, a T-score above 70 (98th percentile) was used as the clinical cut-off point.
Child and Adolescent Needs and Strengths (CANS).The CANS (Lyons, 1999) is a comprehensive tool comprising 50 items used by mental health agencies to assist in decision-making and evaluate service outcomes. The CANS was developed using a
clinimetric-communication perspective (Lyons, 1999), rather than a traditional psychometric approach (e.g., factor structure; Cronbach & Meehl, 1955). Items were selected for their relevance in service treatment planning and rated using a system that translated into level of action. The CANS has demonstrated good inter-rater reliability among researchers (intra-class correlation = 0.85) and between researchers and case workers (intra-class correlation = 0.81; Anderson, Lyons, Giles, Price, & Estle, 2003). In terms of construct validity, total CANS scores are correlated (r = 0.63) with other functional assessments like the Child and Adolescent Functional Assessment Scale (CAFAS; Dilley, Weiner, Lyons, & Martinovich, 2007).
In the current study, the CANS was completed by study personnel based on data in the clinical charts; it was not completed by participating CAMH agency staff. This approach has been found to be reliable (Anderson et al., 2003), and used in other studies (Carson, Stewart, Lin, & Alegria, 2011).
organization (4 items; e.g., service permanence), (5) caregiver needs and strengths (9 items; e.g., supervision, residential stability). These items are coded on a 4-point scale, where higher scores indicate a higher need: 0 = no evidence and/or no need for action; 1 = mild degree and/or need for watchful waiting to see if action is needed; 2 = moderate degree and/or need for action; 3 = severe or profound degree and/or need for immediate or intensive action. It also has one strength domain: (1) child strengths (10 items; e.g., interpersonal, education); these items are coded on a 4-point scale, where lower scores indicate greater strength: 0 = significant strengths; 1 =
moderate strengths; 2 = mild strengths; 3 = no known strength in this area.
The CANS was completed by study personnel at the start of involvement, start of an episode of care, end of an episode of care, and end of involvement. For the start of
involvement/episode of care, raters used intake summaries, BCFPI (if available) and case notes for the first 3 months following the first in-person visit, or up to 10 case notes (whichever came first). For the end of involvement/episode of care raters used, the CAFAS (if available) and case notes from the 3 months prior to the last in-person visit, or the last 10 case notes (whichever came first). If there was an overlap between the first 3 months following the first in-person visit and the 3 months prior to the last in-person visit, only an intake CANS was completed; this occurred for 36% of the cases in the current study sample. It was assumed that CANS scores at intake and discharge would have remained relatively stable for those with an overlap.
Internalizing and externalizing subscales were developed using CANS variables to have psychopathology variables that were similar for the BCFPI and the chart review samples. This is possible as the CANS allows for flexible methods of scoring. The psychometric properties of the other CANS domains (i.e., child functioning, caregiver needs and strengths, care intensity and organization, and child strengths) were also examined. Seven subscales were developed: (1) internalizing problems, (2) externalizing problems, (3) child impairment, (4) care intensity and organization, (5) caregiver needs and strengths, (6) child strengths, and (7), child relationship strengths. Appendix A provides detailed information of the subscale development and
psychometric properties in the current study sample.
In the present sample, Cronbach’s alpha ranged from 0.36 (child relationship strengths) to 0.84 (externalizing problems). The divergent and convergent validity was also examined using the BCFPI. The internalizing problems, externalizing problems, and child impairment CANS subscales were all significantly correlated with their BCFPI counterparts (internalizing problems r = 0.57, externalizing problems r = 0.58, and child impairment r = 0.51). Moreover, the
correlation with the counterparts was stronger than with the other BCFPI scales. The caregiver needs and strengths, child strengths, and child relationship strengths CANS subscales do not have a counterpart in the BCFPI. However, these subscales were correlated with some of the problem presentation and functioning BCFPI scales as would be expected. For example, child relationship strengths was significantly correlated with global child functioning (r = 0.38, p <.01).
approach used by the CANS aims to measure various areas of needs and strengths to create a comprehensive picture of the child and his/her family and environment to inform CAMH service planning. For example, the internalizing problems subscale includes items like depression and adjustment to trauma. While these items are conceptually related, it is unlikely that many children have both depressive symptoms and traumatic experiences.
2.3 Outcome Variables
The primary outcome variable was whether individuals re-accessed services. This was operationally defined as obtaining services a second time after a free period of, at least, 180 days (6 months) without a visit. There are two ways in which children could obtain further services: post-episode of care visit (i.e., 2 visits after the first episode of care; see client 3 in Figure 2.1) or second episode of care (i.e., 3 or more visits after the first episode of care; see client 4 in Figure 2.1). This was coded as follows: 0 = did not re-access services; 1 = re-accessed and had a post-episode of care visits; 2 = re-accessed and had a second post-episode of care.
The secondary outcome was time to re-access mental health services. This was
operationally defined as time in months between the last visit in the first episode of care and the first visit in the post-episode of care or a second episode of care. Post-episode of care and second episode of care were examined independently.
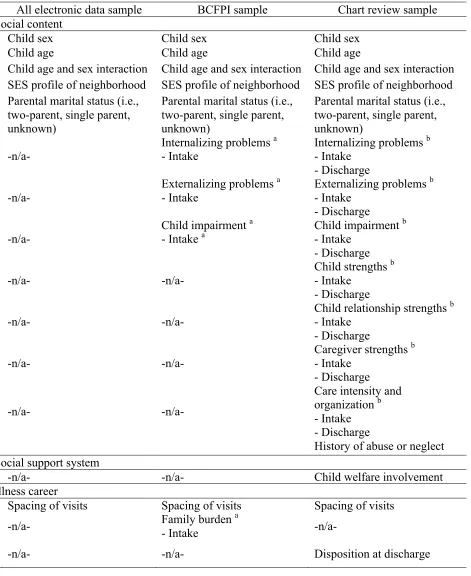
2.4 Predictor Variables and Coding
Table 2.1
Predictors of Re-Accessing Services and Time to Re-Access Services Organized by Revised Network-Episode Categoriesin the Current Study
All electronic data sample BCFPI sample Chart review sample Social content
Child sex Child sex Child sex
Child age Child age Child age
Child age and sex interaction Child age and sex interaction Child age and sex interaction SES profile of neighborhood SES profile of neighborhood SES profile of neighborhood Parental marital status (i.e.,
two-parent, single parent, unknown)
Parental marital status (i.e., two-parent, single parent, unknown)
Parental marital status (i.e., two-parent, single parent, unknown)
-n/a-
Internalizing problems a - Intake
Internalizing problems b - Intake
- Discharge -n/a-
Externalizing problems a - Intake
Externalizing problems b - Intake
- Discharge
-n/a- Child impairment
a
- Intake a Child impairment
b - Intake
- Discharge
-n/a- -n/a-
Child strengths b - Intake
- Discharge
-n/a- -n/a- Child relationship strengths
b - Intake
- Discharge
-n/a- -n/a-
Caregiver strengths b - Intake
- Discharge
-n/a- -n/a-
Care intensity and organization b - Intake - Discharge
History of abuse or neglect
Social support system
-n/a- -n/a- Child welfare involvement
Illness career
Spacing of visits Spacing of visits Spacing of visits
-n/a- Family burden - Intake a -n/a-
Treatment system
One or more pre-episode of care visits
One or more pre-episode of care visits
One or more pre-episode of care visits
Number of visits in first
episode of care Number of visits in first episode of care Number of visits in first episode of care
Level of care Level of care Levels of care
Note: SES = socio-economic status; -n/a- = variable not available in the sample. a Variables from the BCFPI.
Age. The age (years) at the beginning of the first episode of care was calculated for each child. Age was a continuous predictor.
Sex. The principal study coded sex into 2 categories: 0 = female; 1 = male. Sex was a categorical predictor with male sex as the reference group.
SES profile of neighborhood. Children were assigned an income quintile based on the FSA code from the electronic data (see page 23). SES profile of neighborhood was a categorical predictor with quintile 1 as the reference group.
Parental marital status. The principal study coded parental marital status into 4 broad categories (i.e., single-parent household, two-parent household, unknown, and group/foster home). Children in group/foster homes were excluded as they represented a very small group in the current study (~1%) and were believed to have unique needs. Given the substantial number of children with unknown parental marital status (22%), the variable was coded as follows: 0 = unknown; 1 = single-parent household; 2 = two-parent household. Parental marital status was a categorical predictor with two-parent household as the reference group.
BCFPI. The internalizing problems, externalizing problems, child global functioning (i.e., child impairment), and global family situation (i.e., family burden) composite scores were utilized. T-scores for these composite scales were categorized into four groups to facilitate interpretation of results: less than 60 (i.e., within average range), 60-69 (i.e., borderline), 70-79 (i.e., clinically significant, low range), and over 80 (i.e., clinically significant, high range). BCFPI composite scores were categorical predictors with T-scores less than 60 as the reference group.
highest composite score was 3; the average composite score for all subscales (except for child relationship strengths at intake) fell below 1. It is somewhat difficult to interpret descriptive statistics, odds ratios, and hazards ratios as decimals. Consequently, the composite scores were multiplied by 10 and rounded to the nearest integer. CANS composite scores were continuous predictors.
History of abuse or neglect. The principal study coded the number of abuse and neglect factors (i.e., sexual abuse, physical abuse, neglect, witness to violence, witness to domestic violence, and victim of violence) at intake (i.e., first visit at the start of the first episode of care) and discharge (i.e., last visit at the end of the first episode of care or last visit at the agency within the study frame). There were few changes in history of abuse or neglect from intake to discharge; therefore, only data from intake were used. Since few children had a history of abuse or neglect, the variable was dichotomized: 0 = history of abuse or neglect (i.e., ≥ 1 of the 6 abuse or neglect factors); 1 = no history of abuse or neglect (i.e. 0 of the 6 abuse or neglect factors). History of abuse or neglect was a categorical predictor with no history of abuse or neglect as the reference group.
Spacing of visits. The following steps were taken to derive the spacing of visits during the first episode of care. First, the time in days between each visit was computed for each child. Second, the standard deviation (SD) of the time between visits was calculated for each child. Third, the SD of the time between visits was rounded to the nearest integer to facilitate interpretation. Spacing of visits was index of the SD of the time between visits; higher values indicate greater variability. Spacing of visits was a continuous predictor.
Disposition at discharge. The principal study coded disposition at discharge (i.e., last visit at the end of the first episode of care or last visit at the agency within the study frame) into 10 broad categories (e.g., dropped-out, completed treatment). Since the hypothesis for the current study focused on children who dropped-out and the other categories had small cell sizes, the variable was dichotomized: 0= dropped-out (e.g., “dropped-out”, “treatment received, refused additional treatment”, “refused treatment”); 1 = all others (e.g., “completed treatment”, “assessment only”). Disposition at discharge was a categorical predictor with “all other
dispositions” as the reference group.
One or more pre-episode of care visits. Pre-episode of care visits ranged from 1 to 3 in the current sample. Given the low range, the variable was dichotomized: 0 = one more pre-episode of care visits; 1= no pre-pre-episode of care visits. One or more pre-pre-episode of care visits was a categorical predictor with no pre-episode of care visits as the reference group.
Number of visits in the first episode of care. The number of visits in the first episode of care was extracted for each child. Number of visits was a continuous predictor.
2006). Second, the MCYS categories were grouped into 4 levels of care: 1 = low (e.g., drop-in resource center, outreach services); 2 = medium (e.g., individual counselling, family
counselling); 3 = high (e.g., crisis intervention, day treatment); 4 = very high (e.g., wraparound, treatment foster care). The levels were derived for the current study based on the restrictiveness of the treatment, the expected duration of treatment, and the expected number of professionals involved. Higher levels represent more restrictive settings with longer expected duration of treatment and more professionals involved. Third, the percentage of visits in each level was calculated for each child. The level with the highest percentage of visits represented the level of care received. If two or more levels had equal percentages, the highest level was chosen. See Appendix C for more information. Levels of care was a categorical predictor with low level of care as the reference group.
2.5 Data Analyses
Table 2.2
Summary of Data Analyses Organized by Study Objective
Study objective Analyses Sample
Determine rates and patterns of re-accessing CAMH services
- Point prevalence and confidence interval - Range, mean, median
- All electronic data
Identify predictors of
re-accessing services - Multinomial logistic regression - All electronic data - BCFPI - Chart review Identify predictors of the
time to re-access mental health services
- Continuous survival analysis (Cox regression)
- All electronic data - BCFPI
- Chart review
2.5.1 Weighting
A key objective of the principal study was to examine patterns of service use. To this end, an equal number of charts for each pattern of service use (using stratified random sampling) was selected for chart reviews. The percentage of children in each pattern varied. For example, 53% of children were in the minimal care pattern, while 8% were in the brief-episodic care pattern. All analyses in the chart review sample were weighted (Hahs-Vaughn, 2005) to account for the sampling strategy and to be able to draw conclusions for the population of children receiving CAMH services. Normalized weights were used in the multinomial logistic regression, as it preserves the sample size (Hahs-Vaughn, 2005). Rounded normalized weights were used in the survival analyses as this method requires integer case weights.
2.5.2 Multinomial Logistic Regression
multivariate models due to the small sample size. ORs can be interpreted as the change in odds of re-accessing services for every one-unit increase (e.g., one year increase in age) or compared to another category (e.g., females compared to males). Values higher than 1 indicate higher odds, values lower than 1 indicate lower odds, and a value of 1 indicates equal odds (Stoltzfus, 2011; Warner, 2013).
Predictor variables were entered using forced entry in blocks based on the Revised Network-Episode Model categories outlined in Table 2.1. The overall model was interpreted first, follow by the individual predictors. Multinomial logistic regression was used as the primary outcome has 3 levels and it requires less restrictive assumptions compared to other approaches like discriminant analyses (e.g., homogeneity of variance/covariance; Warner, 2013).
Assumptions. Multinomial logistic regression has a number of assumptions that were checked prior to running the analyses (Ottenbacher, Ottenbacher, Tooth, & Ostir, 2004; Stoltzfus, 2011). First, there should be sufficient events per independent variable (i.e., 5 or higher). Cross-tabulations were examined to ensure appropriate number of events. Second, there should be a linear relationship between continuous predictors and their logit-transformed
2.5.3 Survival Analyses
Continuous survival analyses, specifically Cox regression, was used to examine
predictors of the time to re-access mental health services. Unadjusted and adjusted hazards ratios (HRs) were calculated to determine the effect that each variable had on the outcome
independently, and adjusting for other predictors. In the chart review sample, only the variables that had significant unadjusted HRs were included in the multivariate models due to the small sample size. HRs can be interpreted as the change in risk of re-accessing services for every one-unit increase (e.g., one year increase in age) or compared to another category (e.g., females compared to males). Values higher than 1 indicate higher risk and shorter time to re-access, values lower than 1 indicate lower risk and longer time to re-access, and a value of 1 indicates equal risk and time to re-access (Allison, 2010; Kleinbaum & Klein, 2011).
Predictor variables were entered in blocks based on the Revised Network-Episode Model categories outlined in Table 2.1. The overall model was interpreted first, follow by the individual predictors. Cox regression was used as it is the most common survival analysis procedure, and it takes censoring into account (i.e., some participants do not experience the event of interest; Flynn, 2012).
of care in predicting time to a second episode of care (all electronic data sample); and child strengths at intake in predicting post-episode of care visits (chart review sample). It has been argued that HRs of variables that do not meet this assumption can still be interpreted and can be considered as the average effect over time (Allison, 2010). Furthermore, there were minimal changes in the HRs for the other predictor variables when the violating variables were stratified in the analyses (see Appendix D).
Chapter 3: Results
3.1. Descriptive Statistics
A summary of the descriptive statistics for the demographic, service use, and psychopathology variables are provided in Tables 3.1 to 3.4. Statistics for each sample are presented separately. Repeated measures multivariate analysis of variance (MANOVA) was conducted to examine differences in the CANS subscales at intake and discharge. Results showed statistically significant effect of time [Wilks' Lambda F(7, 387) = 32.75, p < .001]. See Table 3.4 for means and univariate F values.
T-tests and chi-square tests were conducted to compare children for whom BCFPI data were available versus not available (see Table 3.5). There were differences in a number of variables: age, SES profile of neighborhood, parental marital status, one or more pre-episode of care visits, number of visits in the first episode of care, and level of care during the first episode of care.
Table 3.1
Descriptive Statistics for Demographic Predictor Variables in Each Sample
All electronic data sample (n = 3399)
BCFPI sample (n = 1751)
Chart review sample (n = 426) n (%) or M (SD) n (%) or M (SD) n (%) or M (SD)
Age (years) 9.93 (2.58) 10.08 (2.26) 10.02 (2.47)
Child sex (male) 2123 (62.5%) 1121 (64.0%) 262 (61.5%) SES profile of
neighborhood
Quintile 1 749 (22.0%) 428 (24.5%) 98 (23.0%)
Quintile 2 659 (19.4%) 365 (20.8%) 98 (23.0%)
Quintile 3 812 (23.1%) 411 (23.5%) 108 (25.4%)
Quintile 4 784 (23.9%) 361 (20.6%) 96 (22.5%)
Quintile 5 395 (11.6%) 186 (10.6%) 26 (6.1%)
Parental marital status
Single-parent 1346 (39.6%) 662 (37.8%) 136 (31.9%)
Two-parent 1298 (38.2%) 630 (36.0%) 155 (36.2%)
Unknown 755 (22.2%) 459 (26.2%) 136 (31.9%)
History of abuse or
neglect -n/a- -n/a- 221 (52.0%)
Child welfare involvement
-n/a- -n/a- 170 (40.0%)
Table 3.2
Descriptive Statistics for Mental Health Service Use Predictor Variables in Each Sample
Note: Other disposition at discharge indicates all other dispositions at discharge (e.g., completed treatment, treatment ongoing); -n/a- = variable not available in the sample.
All electronic data sample (n = 3399)
BCFPI sample (n = 1751)
Chart review sample (n = 426) n (%) or M (SD) n (%) or M (SD) n (%) or M (SD) One or more
pre-episode of care visits
271 (8.0%) 103 (5.9%) 27 (6.3%)
Spacing of visits during first episode of care (SD units)
19.07 (15.58) 20.15 (15.57) 19.12 (15.15)
Number of visits in first
episode of care 16.06 (18.93) 16.73 (19.13) 16.97 (20.84) Level of care during
first episode of care
Low 1414 (41.6%) 755 (43.1%) 156 (36.7%)
Medium 1079 (31.7%) 541 (30.9%) 149 (35.0%)
High 317 (9.3%) 135 (7.7%) 61 (14.3%)
Very high 589 (17.3%) 320 (18.3%) 60 (14.0%) Disposition at discharge
Dropped out -n/a- -n/a- 77 (18.1%)
Table 3.3
Descriptive Statistics for Psychopathology Predictor Variables in BCFPI Sample
Note: Clinically significant refers to T-scores above 70 (98th percentile compared to population norms).
Composite BCFPI scale T-scores Clinically significant
problems
M (SD) n (%)
Internalizing problems 63.98 (14.29) 582 (33.2%)
Externalizing problems 69.63 (13.03) 936 (53.5%)
Child impairment 67.66 (14.35) 792 (45.2%)
Table 3.4
Descriptive Statistics for Psychopathology Predictor Variables in Chart Review Sample at Intake and Discharge from the First Episode of Care
CANS subscales Intake Discharge
M (SD) M (SD) F p
Internalizing problems
6.86 (4.88) 4.23 (3.97) 136.25 < .001 Externalizing
problems 9.29 (5.20) 6.43 (5.34) 158.33 < .001
Child impairment 6.15 (4.05) 4.31 (4.01) 120.25 < .001 Caregiver needs and
strengths
5.87 (3.24) 5.58 (3.30) 3.11 .079
Care intensity and organization
6.97 (2.97) 6.30 (4.08) 74.32 .001
Child strengths 8.68 (4.61) 6.09 (4.52) 115.95 < .001
Child relationship strengths
Table 3.5
Analyses Comparing Children for Whom BCFPI Data Were Available Versus Not Available
All electronic data With no BCFPI data
available (n = 1648)
With BCFPI data available (n = 1751) n (%) or M (SD) n (%) or M (SD)
Age (years) 9.78 (2.88) 10.08 (2.23)**
Child sex (male) 1002 (60.8%) 1121 (64.0%)
SES profile of neighborhood
Quintile 1 321 (19.5%) 428 (24.5%)* Quintile 2 294 (17.8%) 365 (20.8%)* Quintile 3 401 (24.3%) 411 (23.5%) Quintile 4 423 (25.7%) 361 (20.6%)* Quintile 5 209 (12.7%) 186 (10.6%) Parental marital status
Single-parent 684 (41.5%) 662 (47.8%)* Two-parent 668 (40.5%) 630 (36.0%)* Unknown 296 (18.0%) 459 (26.2%)* One or more pre-episode
of care visits 168 (10.2%) 103 (5.9%)
*
Spacing of visits during first episode of care (SD units)
17.92 (15.51) 20.15 (15.57)
Number of visits in first episode of care
15.34 (18.70) 16.73 (19.13)* Level of care during first
episode of care
Low 659 (40.0%) 755 (43.1%)
Medium 538 (32.6%) 541 (30.9%)
High 182 (11.1%) 135 (7.7%)* Very high 269 (16.3%) 320 (18.3%)
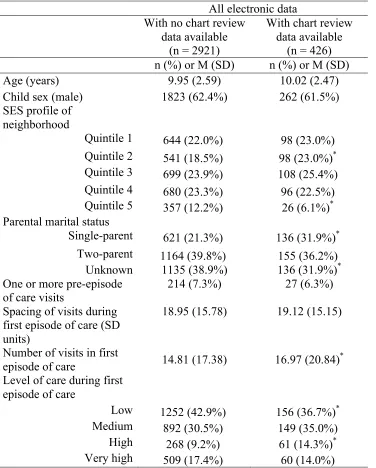
Table 3.6
Analyses Comparing Children for Whom Chart Review Data Were Available Versus Not Available
All electronic data With no chart review
data available (n = 2921)
With chart review data available
(n = 426) n (%) or M (SD) n (%) or M (SD)
Age (years) 9.95 (2.59) 10.02 (2.47)
Child sex (male) 1823 (62.4%) 262 (61.5%)
SES profile of neighborhood
Quintile 1 644 (22.0%) 98 (23.0%) Quintile 2 541 (18.5%) 98 (23.0%)* Quintile 3 699 (23.9%) 108 (25.4%) Quintile 4 680 (23.3%) 96 (22.5%) Quintile 5 357 (12.2%) 26 (6.1%)* Parental marital status
Single-parent 621 (21.3%) 136 (31.9%)* Two-parent 1164 (39.8%) 155 (36.2%)
Unknown 1135 (38.9%) 136 (31.9%)* One or more pre-episode
of care visits 214 (7.3%) 27 (6.3%)
Spacing of visits during first episode of care (SD units)
18.95 (15.78) 19.12 (15.15)
Number of visits in first
episode of care 14.81 (17.38) 16.97 (20.84)* Level of care during first
episode of care
Low 1252 (42.9%) 156 (36.7%)*
Medium 892 (30.5%) 149 (35.0%)
High 268 (9.2%) 61 (14.3%)* Very high 509 (17.4%) 60 (14.0%)
Note: SES = socio-economic status. z tests for column proportions for each row in a chi-square contingency table were computed if the chi square statistic was significant (Sharpe, 2015). * p< . 05
3.2. Rates and Patterns of Re-Accessing CAMH Services
The first objective was to determine the rates and patterns of re-accessing CAMH services (i.e., at least one visit 6-months or longer after the first episode). Of the 3399 children who had a first episode of care, 30.0% (95% CI = 28.4% - 31.6%) re-accessed services. Time to re-access ranged from 6 (minimum time as per definition of an episode of care) to 48 months (M = 17.09, median = 13.00 months, SD = 10.40).
There were two ways in which children could re-access services: post-episode of care visits (i.e., 2 visits after the first episode of care) or a second episode of care (i.e., 3 or more visits after the first episode of care). The rate for post-episode of care visits was 10.4% (95% CI = 9.4% - 11.5%). Time to post-episode of care visits ranged from 6 to 48 months (M = 18.94, median = 16.00, SD = 11.30). The rate for a second episode of care was 19.6% (95% CI = 18.3% - 21.0%). Time to second episode of care (i.e., 3 or more visits) ranged from 6 months to 44 months (M = 16.11, median = 12.00, SD = 9.77).
Figure 3.1. Distribution of time to post-episode of care visits and second episode of care in months.
0 2 4 6 8 10 12 14 16 18
6 8 10 12 14 16 18 20 22 24 26 28 30 32 34 36 38 40 42 44 46 48
Pe
rc
en
ta
ge
Time to Re-Access (months)
Second episode of care