the nodes in these networks is congruent with the un- derlying IP-level topology. Similarly, in the case of replicated weh content, client nodes could use topological information in selecting one of multiple availahle servers. For such applications, one need not find the optimal sn-
lutinn in order to achieve significant practical henefits. Thus, these appli- cations, and presumahly others like them, do not require urct topological information and can instead use sufficiently informative hints ahnut the rel- ative positions of Internet hosts.
In this paper, we present a binning scheme wherehy nodes partition themselves into hins such that nodes that fall within a given hin are rel- atively close to one another in terms of network latency. Our binning strategy is simple (requiring minimal support from any measurement in- frastructure), scalable (requiring no form of glnhal knowledge, each node only needs knowledge of a small numher of well-known landmark nodes) and completely distrihuted (requiring no communication or cooperation hetween the nodes heing hinned).
We apply this binning strategy to the two applications mentioned ahnve:
overlay network construction and server selection. We test our binning strategy and its application using simulation and Internet measurement traces. Our results indicate that the performance of these applications can
he significantly improved hy even the rather coarse-gained knowledge of
topology offered hy our binning scheme.
1. INTRODUCTION
Several ongoing projects make use of application-level or
overlay networks 111, 121, 131, 141, 1.51, 161, 171, 181, 191. In
these applications, each participating end-host node is logically connected’ to a small subset of the other participant nodes (we call this subset the node’s neighbors) to form an overlay net- work. A path on the overlay network then consists of a series of application-level, not IP-level, hops between the source and destination nodes. However, in current applications, little effort is made to ensure that this application-level connectivity is con- gruent with the underlying IP-level network topology. This in turn can lead to inefficient routing where, for example, a node in Berkeley has its neighbor nodes in Europe and hence its path to a node in Stanford may traverse distant nodes in Europe. Ide- ally, one would like to improve routing performance by avoiding such unnecessary high latency hops. Thus, a fundamental chal- lenge in using large-scale overlay networks is to incorporate IP- level topological information in the construction of the overlay to improve routing performance.
The utility of topological information is however, not re- stricted to overlay network construction. Content distribution over the Internet is another example where such information could improve performance. In recent years, the Web has moved from an architecture where data objects are located at a single origin server to one where objects are often replicated at multi-
SRatnasamy, M.Handley,R.Karp and S.Shenker are with the ICSI Center for Internet Research, Berkeley, CA, USA. SRatnasamy and R.Karp are also with the Computer Science Division, University of California. Berkeley, CA, USA.
‘For example, by a TCP connection.
ple, geographically dispersed servers. Client requests for con- tent are redirected to a close-by replica server rather than the origin server. The process of selecting a “good” server, i.e. one that is close to the client in terms of latency, might be signif- icantly improved if both the client and servers could indicate their position on the Internet. Likewise, peer-to-peer file shar- ing applications such as Napster and Gnutella typically have the same file available at multiple peers. Topological information could be used to select a close-by peer for quicker down-loads. The problem we explore in this paper is whether it is possi- ble to gather topological information in a manner that is both practical and scalable and if so, how could this information be effectively incorporated into the design of distributed systems such as overlay networks and content distribution systems?
At this point, it is worth briefly discussing the desirable prop- erties of a solution to the above problem. Administrator config- ured overlay networks, such as those used in CDNs [ 101, [ 111, [ 121, can be made to fit the underlying IP topology. However, such overlays are not generally applicable; the hand-crafted and centralized nature of the overlay construction process makes it untenable for large overlays (millions of nodes) and for overlays, such as peer-to-peer file sharing [ 11, 121, [ 131, where there is no single central administrator. One might also imagine central- ized solutions [ 141 wherein a single site gathers network topol- ogy and routing information to infer the relative proximity of hosts. Such solutions however result in a single point of fail- ure and potential bottleneck. Also, for completely decentralized applications such as peer-to-peer file sharing there is no clear in- centive, economic or otherwise, for a third party to offer such a service. We also wanted to avoid more elaborate solutions where the overlay network structure is improved slowly over time [ 15 1. This is because in many of the targeted applications [ 11, [ 2 1, [ 13 1 for overlay networks participant nodes join and leave the appli- cation on short time-scales. A solution that operates over long time-scales would be continually reacting to fluctuating node membership without stabilizing. Thus, we concluded that a de- sirable solution should be simple, fast, distributed, and should scale to millions of nodes.
leged access and which publish such information on the Web as a service to the community. Neither of the above is a reasonable option in general. We thus chose to use network latency be- cause latency is often a direct indicator of the performance seen by end-host nodes and can be easily measured in a light-weight, end-to-end, non-intrusive manner.
Finally, one might question the required accuracy of the topo- logical information. In both our targeted applications (over- lay construction and server selection), incorporating topology awareness is really a performance optimization and is not ye- quived for correct operation. More importantly, our results show that both server selection and overlay construction show signif- icant performance improvements with only approximate topo- logical information. For these reasons, we view scalability and practicality as more important goals than accuracy. Hence, un- like many research projects [ 161, [ 171, [ 181, the focus of our work is not on highly accurate topology modeling, nor on build- ing a general-purpose measurement service. While these are im- portant problems in their own right, our focus is instead on the use of simple topological hints to solve certain application-level problems.
In this paper, we propose a distributed binning scheme whereby nodes partition themselves into bins such that nodes that fall within a given bin are relatively close to one another in terms of network latency. Our scheme requires a set of well- known landmark machines spread across the Internet. An ap- plication node measures its distance, i.e. round-trip time, to this set of well known landmarks and independently selects a partic- ular bin based on these measurements. Our binning scheme is simple, requiring very little support from the infrastructure. The only infrastructure required is a small number (our results using Internet trace data indicates that 8-12 machines should suffice for the current scale of the Internet) of relatively stable landmark machines. Very little work is required of these landmark ma- chines - they need only echo “ping” messages - and landmarks could in fact be unsuspecting participants in the binning! 2 Landmarks do not actively initiate measurements nor gather or disseminate measurement information. Binning is scalable be- cause nodes independently discover their bins without commu- nicating or coordinating with other application nodes.
Given the above binning strategy, we turn to the problem of how one might effectively incorporate such a scheme in dis- tributed applications. We apply this binning strategy to two ap- plications: overlay network construction and server selection. Results obtained through simulation and from Internet measure- ment traces indicate that even the rather coarse-grained topo- logical information provided by our binning strategy can sig- nificantly improve the performance of systems such as overlay networks and CDNs.
The remainder of this paper is organized as follows: Section 11 describes and evaluates our binning scheme. In Sections 111 and IV we describe and evaluate the application of our binning strat- egy to overlay network construction and server selection respec- tively. Finally, we discuss related work in Section V and con- clude in Section VI.
2For example, one might imagine using the DNS root name servers as the set of landmarks and using the DNS response times as latency measurements.
II. DISTRIBUTED BINNING
The goal of our distributed binning scheme is to have a set of nodes independently partition themselves into disjoint “bins” such that nodes within a single bin are relatively closer to one another than to nodes not in their bin.
Our scheme assumes the existence of a well known set of machines that act as landmarks on the Internet. Application nodes might discover the IP addresses of these machines us- ing the DNS (for example, landmark machines could be named
lml.hin.net, lm2.hin.net, . rather than hard-coding landmark IP addresses into the application).
We achieve a form of “distributed binning” of nodes based on their relative distances, i.e. latencies from this set of landmarks. A node measures its round-trip-time to each of these landmarks and orders the landmarks in order of increasing RTT. ’ Thus, based on its delay measurements to the different landmarks, ev- ery node has an associated ordering of landmarks. This ordering represents the “bin” the node belongs to. The rationale behind this scheme is that topologically close nodes are likely to have the same ordering and hence will belong to the same bin.
We can however do better than just using the ordering to de- fine a bin. A node’s RTT measurements to each landmark offers two kinds of information: the first is the relative distance of the different landmarks from the given node and the second is the
absolute value of these distances. The ordering described above only makes uses of the relative distances of the landmarks from a node. The absolute values of the RTT measurements are indi- cated as follows: we divide the range of possible latency values into a number of levels. For example, we might divide the range of possible latency values into 3 levels; level 0 for latencies in the range [O,lOO]ms, level 1 for latencies between [ 100,2OO]ms and level 2 for latencies greater than 2OOms. We then augment the landmark ordering of a node with a level vector; one level number corresponding to each landmark in the ordering. To il- lustrate, consider node A in Figure 1. Its distance to landmarks 11, 12 and 1s are 232ms, 51ms and 117ms respectively. Hence its ordering of landmarks is /a/a1i. Using the 3 levels defined above, node A’s level vector corresponding to its ordering of landmarks is “0 1 2”. Thus, node A’s bin is “12lsli : 012”.
Note that with the above binning scheme (and unlike schemes in [ 161, [ 17]), a node only needs to discover the distance be- tween itself and the landmarks and can measure these distances itself. Nodes need not know the inter-landmarks distances or the distance of other nodes from the landmarks. Also, binning is ro- bust to the failure of one or more landmark nodes. In the case of landmark failures, new nodes are binned using the surviving landmarks while previously binned nodes need only drop the failed landmark(s) from their bin identifier. Of course, perfor- mance degrades with fewer landmarks (the effect of the number of landmarks on binning is quantified later).
perform measurements to) a small set of landmarks. The only remaining issue is the load such measurement place on the land- marks; a quick back-of-the-envelope calculation indicates that this load is quite manageable for systems with a million nodes or more. For example, assume we have a million nodes and need 10 pings to obtain a good sample of the RTT to a land- mark. If nodes refresh their bin information once per hour4 that would impose a load of approximately 2700 pings per second on each landmark.? To further improve scalability, one might have multiple close-by nodes act as a single logical landmark. For example, the Computer Science department at U.C.Berkeley might install 10 machines that all act as a single landmark, say
lml.hin.net. Since these machines are geographically and topo- logically co-located, application nodes can use any one of them as Landmark#l (and DNS round-robin might be used to load balance amongst the 10 machines).
The second question we address is; does binning do a reason- able job of placing nearby nodes into the same bin? To do so, we calculate the following:
. average inter-bin latency: the average latency from a given node to all nodes not in its bin
. average intra-bin latency: the average latency from a given node to all nodes in its bin
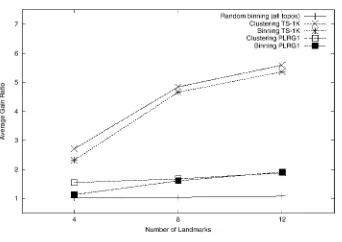
For every bin containing two or more nodes, we compute the ratio of the inter-bin latency to the intra-bin latency for nodes within that bin. We call this the node’s gain ratio. The metric we use to evaluate binning is the average over all nodes (that belong to bins of size greater than one node) of the gain ratio. Intuitively, what the gain ratio represents is that on the average if a node were to communicate with a random node from its own bin instead of a random node not in its bin, then the communica- tion latency would be reduced by a factor equal to its gain ratio. A higher gain ratio indicates a bigger reduction in latency and is hence desirable. Of course, binning (and hence its performance) by itself is not particularly interesting; the utility really comes from its application to actual Internet systems. Our evaluation of
4A refruh rate ofonce/hour won’t enable node\ to react mmxdlately to event\ \uch a\ hnk fadure\; however, we deem thl\ acceptable \mcc stale bmnmg m formatIon wdl only result m somewhat mcrea\ed delayy\.
5Such load\ are ea\dy handled by modern mldrange PC\. We experlmented with an XOOMHr Athlon ba\ed machme and found that It could ea\dy recave 2,700 pmg\ per second with no lo\\. Moreover, a\ a reference pomt, a DNS trace from October 1999 \how\ that the root name \erverJroot wrver~.net wa\ han dhng (with \ome headroom) a IO mmute average of 1,600 request\ per second. Smce ICMP ~5 praumably lower co\t than \ervmg DNS, the load on landmark\ would not be a \Igmficant problem.
binning is thus primarily a sanity check to confirm that binning does achieve its goal of clustering nearby nodes.
We tested our binning algorithm on both simulated topologies and Internet measurement data. The test topologies we use are as follows:
1. TS-1OK and TS-1 K: Transit-Stub topologies [ 191 with 10,000 and 1,000 nodes respectively. TS topologies model net- works using a 2-level hierarchy of routing domains with transit domains that interconnect lower level stub domains. To these TS topologies, we assign link latencies of 20ms for intra-transit domain links, 5ms for stub-transit links and 2ms for intra-stub domain links (we also experimented with a delay distribution of 100, 10 and lms instead of 20, 5 and 2ms respectively with no real change in our results).
2. PLRGl and PLRG2: Recent studies 1201, 1211 have indi- cated that the Internet’s degree distribution follows a power-law. Motivated by these observations, degree-based generators have been proposed [ 22 1 which appear to better model the measured Internet topology. We make use of the same power-law random graph generator as used by [ 211, [ 221. PLRGl and PLRG2 are Power-Law Random Graphs with 1,166 and 1,779 nodes respec- tively. To each link in the topology, we assign a random delay between 5 and 100ms. ’
3. NLANR: The Active Measurement Project (AMP) at the Na- tional Laboratory for Applied Network Research (NLANR) uses a distributed network of over 100 active monitors to system- atically perform scheduled measurements between each other. Amongst other things, monitors measure the round trip times (RTT) between the different pairs of monitors. We use an NLANR data set with the round-trip-times between 103 such monitors. Our data set is from measurements taken in April 2001. The NLANR sites are primarily located at universities in North America. The details of the NLANR measurement methodology and sites is described in [ 23 1.
Recent work has focused on placement strategies for instru- mentation boxes [ 241, [ 181. In our work, we make minimal as- sumptions about the placement of our Landmark machines. For each of the above topologies, we place the required number of landmarks at random with the only condition that the landmarks be separated from each other by a certain number of hops. In our simulations, we use a separation distance of four hops. More so-
phisticated placement schemes, as described in [ 241 would only serve to improve our results.
The key parameters affecting performance are . type and scale of topology
. number of nodes being binned . number of levels
. number of landmarks
For all results presented in this section, all nodes in the data set (other than landmark nodes) are binned.
In Figure 2, we fix the number of landmarks at 12 and plot the effect of increasing numbers of levels on the average gain ratio. For only the NLANR data plot, the number of landmarks was fixed at 4.7 With a single level, all latencies belong to the same level and hence only the landmark ordering defines the bin. For higher levels, we use a demarcation latency value Ddem to divide the range of latency values into the desired number of levels. We experimented with different demarcation values and found that for most reasonably selected values, our results remain largely unchanged. In all the simulations presented here, we use the average latency of the underlying topology, denoted by Dip, to demarcate the different levels. At two levels, we divide latencies into two levels as being less than D,, (level 0) or greater than Dip. We divide latencies into three levels as being less than (0.75 x Drp), or between (0.75 x Dip) and (1.25 x Drp) or greater than (1.25 x Dip).
In Figure 2, an average gain ratio of 4.06 for TS-1OK with 3 levels indicates that for a given node, a node within its own bin is on an average, four times closer than one not in its bin. While increasing the number of levels improves the gain ratio, we see that the improvement appears to rapidly saturate, indicating that in practice, just 2-3 levels should suffice.
Figure 3 plots the average gain ratio for an increasing number of landmarks. The number of levels was fixed at one. For the reason mentioned above, the data points for the NLANR plot actually correspond to 2,3,4 and 5 landmarks (not 4,8,12 and 16; we plotted it on the same graph due to space limitations). As expected, increasing the number of landmarks results in more fine-grained binning, thereby improving the gain ratio.
By comparing the results for TS- 1 OK and TS- 1 K, we see that the gain ratio is clearly affected by the size of the underlying topology. Our simulations showed that for a given topology, the gain ratio varies little with the number of nodes being binned, i.e. for a given topology, the density of nodes being binned does not affect the gain ratio.
We also measured the effect of the number of landmarks on the number of bins for the different topologies and found that with the exception of TS-lOK, the number of bins saturates around 8 landmarks explaining why we see little improvement in the gain ratio beyond that point.
The above results tell us what kind of gain ratios our binning scheme provides and how it is affected by the number of levels and landmarks. But, we would like to know how well our bin- ning scheme works relative to other binning techniques. I.e. are the above gain ratios good? We use the following algorithms to
7Because the NLANR data has only 103 nodes, we avoid using a larger num- ber of landmarks because this would cause the nodes to be spread across a large number of bins, resulting in very few nodes per bin.
provide us with reasonable upper and lower bounds on the gain ratios one might expect from any binning technique:
. Random binning: Using the same number of bins as generated by our landmark-based binning scheme, each node selects a bin at random. Random binning thus makes no attempt to achieve locality and acts as a lower bound for the gain ratio.
. Nearest-neighbor clustering: Our binning problem is very similar to the clustering problem which has been extensively studied in the theory community. In clustering the input com- prises a set of data points, each having a set of attributes and a similarity measure among them. The goal is to find clusters such that data points in one cluster are more similar to one an- other, and data points in separate clusters are less similar to one another. While optimal clustering is known to be NP-hard, a widely used clustering algorithm known to achieve good results for a variety of applications is Nearest Neighbor Clustering. In Nearest Neighbor clustering, each node is initially assigned to a cluster by itself. At each iteration, the two closest clusters are merged into a single cluster. The algorithm terminates when the required number of clusters are obtained. When applied to our problem, we repeatedly merge the two clusters with the min- imum inter-cluster latency, where the inter-cluster latency be- tween two clusters is the average latency between nodes from one cluster to nodes in the other. Nearest neighbor clustering re- quires global knowledge of the latencies between all the nodes and is clearly not practical for actual deployment on the Internet, but serves as a useful potential lower bound to any distributed binning scheme.
Figure 4 plots the average gain ratio for the different topologies using landmark-based binning, random binning and nearest-neighbor clustering. Not surprisingly, random binning yields a gain ratio of approximately 1.0 for all the test topolo- gies. In all cases, the performance of landmark-based binning comes close to that of nearest-neighbor clustering and greatly outperforms random binning.
In conclusion, the binning scheme we’ve proposed does a rea- sonable job of placing nearby nodes into the same bin. We now address the more fundamental and important question of whether the binning scheme can be of use to applications.
III. TOPOLOGICALLY-AWARECONSTRUCTIONOF OVERLAYNETWORKS
In this section, we apply our binning scheme to the construc- tion of overlay networks. We focus on two types of overlay networks.
The first are stvuctuved overlays wherein nodes are intercon- nected (at the application-level) in some well-defined manner. A number of designs for such structured overlays have been proposed recently 141, 131, 1251, 1261. In our work, we fo- cus on one such system, called a Content-Addressable Network (CAN). Our scheme for topologically sensitive CAN construc- tion should however be applicable to similar systems such as Chord 131, PASTRY 1261 and Tapestry 12.51.
The second type of overlay networks we consider are CM-
struction.
The metric we use to evaluate our overlay construction algo- rithms is the ratio of the average inter-node latency on the over- lay network to the average inter-node latency on the underlying IP-level network. We call this the latency stretch; lower values of stretch are thus desirable.
A. Topologically-sensitive CAN construction
A Content-Addressable Network is an application-level net- work whose constituent nodes can be thought of as forming a virtual d-dimensional Cartesian coordinate space. This coordi- nate space is completely logical and bears no relation to any physical coordinate system. At any point in time, the entire co- ordinate space is dynamically partitioned among all the nodes in the system such that every node “owns” its individual, distinct zone within the overall space. For example, Figure 5 shows a 2-dimensional [0, I] x [0, I] coordinate space partitioned be- tween 5 CAN nodes. * Nodes in the CAN self-organize into an overlay network that represents this virtual coordinate space. A node learns and maintains as its set of neighbors the IP ad- dresses of those nodes that hold coordinate zones adjoining its own zone. This set of immediate neighbors serves as a coordi- nate routing table that enables routing between arbitrary points in the coordinate space. Intuitively, routing on the CAN works by following the straight line path through the Cartesian space from source to destination coordinates. Figure 6 shows a sample routing path. For a d dimensional space partitioned amongst n nodes, the average routing path length is thus O(d(n’id)) and individual nodes maintain O(d) neighbors.
The CAN construction mechanisms described in [ 41 allocate nodes to zones at random.’ Thus, a node’s neighbors on the CAN need not be topologically nearby on the underlying IP network. This can lead to inefficient routing because every application-level hop on the CAN could potentially be between two geographically (and topologically) distant nodes.
In this section, we apply our binning strategy to construct CAN topologies that are congruent with the underlying IP topol- ogy. Let us assume for the moment that only the ordering of landmarks is used for binning (the following ideas can be triv- ially extended to include level vectors). With m landmarks, m! 8The dwmptmn of how node\ create and mamtam thl\ structure 15 not re qmred to follow the dl\cu\\lon m thl\ paper. CAN operattlon 15 dexrlbed m detad m 141.
gWlth the exceptlon of SectIon 3.6 m 141 where the Idea of bmnmg 15 brIefly Introduced a\ work m progre\\.
Fig. 6. Exmple 2 d F~LKY such orderings are possible. Accordingly we partition the coor- dinate space into m! equal sized portions, each corresponding to a single ordering. Our current scheme to partition the space into m! portions works as follows: assuming a fixed cyclical or- dering of the dimensions (e.g. xyzxyzx...), we first divide the space, along the first dimension, into m portions, each portion is then sub-divided along the second dimension into m - 1 por- tions each of which is further divided into m - 2 portions and so on. Previously, a new node joined the CAN at a random point in the entire coordinate space. Now, at join time, a CAN node must first bin itself, i.e. based on its delay measurements to the set of landmarks, each node determines its associated bin. The new node then joins the CAN at a random point in that portion of the coordinate space associated with its landmark ordering.
A consequence of the above construction scheme is that the coordinate space is no longer uniformly populated. Because some bins are more highly populated than others their corre- sponding portions of the coordinate space are also more densely occupied than others leading to an uneven distribution of the size of zone spaces amongst the nodes. Thus some nodes hold much larger coordinate zones that others. We defer this problem of achieving While we believe the use of background load bal- ancing techniques (described in [ 41) where an overloaded node hands off a portion of its space to a more lightly loaded one might be used to alleviate this problem, we do not explore this question further in this paper and defer it to future work.
Fig. 7. 5 retch for ~1 2-dimen.sioncd CAN: topology TS-1K; #/eve/s=1 Construction 1 Latency Stretch 1
TABLE I
Stretch on ~1 2-d CAN using NLANR; #levels= 1
uneven space distribution. ‘a Finally, we divide this by the path latency on the underlying IP-level network to obtain the latency stretch.
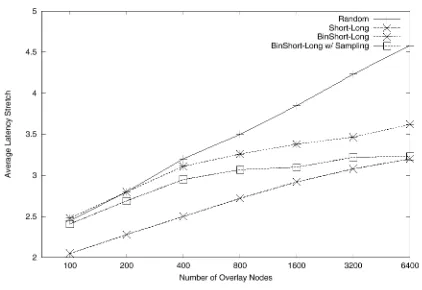
Figure 7 plots the CAN latency stretch (defined above) for in- creasing CAN sizes, i.e. for increasing numbers of CAN nodes. We use topology TS- 1 K and scale the CAN size by adding CAN nodes to the stub (leaf) nodes in the underlying topology. The delay of the link from the end-host node to the stub node is set to lms. Thus, in scaling the CAN size from 512 to 16K nodes, we’re scaling the density of the graph without scaling the backbone (transit) domain. Figure 7 compares the latency stretch for randomly constructed CANS (where nodes join the CAN at a random point in the space, as described in 141) to the stretch using the binning-based CAN construction scheme outline above. We see that binning-based construction greatly lowers the stretch. Also, as expected, with more landmarks, the binning is more accurate and the stretch decreases further.”
Figure 8 repeats the above test for topology PLRG2. As be- fore, the CAN size is scaled by scaling the density of CAN nodes attached to underlying topology nodes. Again, we are not sure to what extent the random assignment of link delays affects our re- sults for PLRGs. Table 1 lists the stretch for a 100 node CAN us- ing the NLANR data set. Because the NLANR data set has only
loWe wl\h to \tre\\ that thl\ adju\tment actually make\ our re\ult\ look wor\e. “Whde the absolute value of the \&etch appear\ high, thl\ ~5 prunardy be cauu\e we are u\mg a CAN with only two dmxn\lon\. Increa\mg the dlmen\lon ahty of the CAN \pace greatly reduce\ the \&etch for all con\tructlon xhema. In 141, we aI50 make u\e of a number of heurl\tlc techmque to further lower the latency. The\e techmque however, are CAN \pecdic and not relevant to thl\ paper. We thu\ do not make u\e of them m thl\ paper 50 that we can more clearly expose the performance gun\ cauu\ed by bmnmg alone.
Fig. 8. Stretch fir ~12~dimensional CAN: topology PLRG2; #levels= 1 103 nodes, we cannot experiment with increasing CAN sizes as we did for TS and PLRG.
B. Topologically-aware construction
of
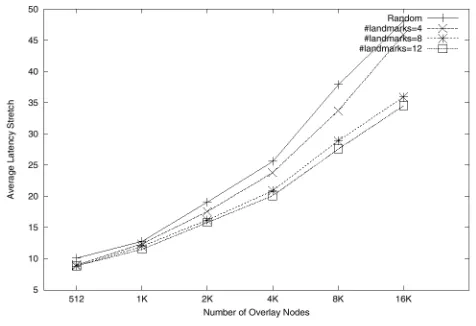
unstvuctuved overlays The previous discussion applied to the class of “structured” overlays (such as CAN, Chord, Pastry, Tapestry). However, many deployed overlays (such as Gnutella, FreeNet) are much less structured. We now ask whether our topological hints could be of use in the construction of these unstructured overlays. To study this question we chose to not focus on any one particu- lar existing overlay problem and instead consider the following more general one:Given a set
of
n nodes on the Internet, have each node picks any Ic neiglzhou nodes,fmn this set, so that the average uouting latency on the resultant overlay is low (assuming slzoutest path uouting).Even under the assumption of global knowledge of the IP- level latencies between every possible pair of nodes (i.e. the n2 distance matrix), the problem of constructing an optimal over- lay is known to be NP-hard 1291, 1281. Because we do not have an optimal construction algorithm, we experimented with a number of different heuristic algorithms and found one that appears to consistently perform well. Our heuristic algorithm works as follows: a node picks its Ic neighbors by picking the Ic/2 nodes in the system closest to itself (we call these connec- tions shout links) and then picks another k/2 nodes at random (we call these long links). Our intuition in devising the above algorithm was that the k/2 connections to closeby nodes will result in well-connected pockets of nearby nodes, while the ran- dom links serve to keep the graph connected and to interconnect these different pockets of nodes. Shortest path routing on the resultant overlay might then involve a series of short hops from the source node to a close-by node which has a long link to a node in the vicinity of the destination node and from there again taking a series of short hops to the destination node. We call this algorithm Shout-Long.
servers holding a given data object should a client attempt a re- trieval ?
While many parameters might be used to select a good server, the most frequently mentioned parameters are server load and distance (i.e. network latency) from the client. In this paper, we focus only on the distance parameter and define a good server to be one that is close to the client. In this section, we describe a scheme for server selection based on distributed binning.
Given the client and server bins, the server selection process works as follows:
. If there exist one or more servers within the same bin as the client, then the client is redirected to a random server from its own bin.
. If no server exists within the same bin as the client, then an ex- isting server is selected at random from the set of servers whose bin is most similar to the client’s bin. We define the degree of similarity between two bins to be the number of positions in their landmark orderings on which they match.
In practice, the above server selection might be implemented by having the client include its bin information in a DNS query. DNS name servers could maintain the bin information for servers holding their content (for example, CNN’s name server might maintain the bin information for Web servers holding CNN content). Name servers might then use the above scheme to select a server for the requesting client.
We compare the performance of our binning-based server se- lection to 3 schemes:
. Random: A client selects one of all available servers at ran- dom.
. Selection using the Hotz metric: Hotz 1301, 1311, like our binning scheme, uses RTT measurements from a node to a set of well known landmarks to estimate inter-node distances. The Hotz metric is computed as follows: Let dai represent the distance from a node A to landmark 1. Then for any two nodes A and B and Landmark I, the distance between
A and B is bounded below by Idai - dbi 1 and above by Idai + dbil assuming triangle inequality. Extending this to m Landmarks, the distance between nodes A and B is bounded below by MAX(Id,’ - dblI , . . , Id,” - dbml) and above by MIN(Id,’ + dbl 1 , . . , Id,” + dbml). Using Hotz’s scheme, the distance between A and B is then the average of the lower and upper bounds as computed above. Applying Hotz’s metric to server selection, a client selects the server to which its esti- mated distance is minimum. ”
. Selection based on Cartesian distance: Here, we simply re- gard each landmark as defining an axis in a Cartesian space. We thus treat a node’s vector of distances to m landmarks as its coordinates in m-dimensional Cartesian space and compute the distance between two nodes A and B as the Cartesian distance between their coordinates. For server selection, a client selects the server to which its estimated distance is minimum.
Note that one advantage in general (not necessarily for server selection) of using bins as a metric rather than the Hotz or Carte- sian distance is that the latter metrics require more information.
131n [30], Hotr define\ the metric we dwmbe but doe\ not apply hl\ work to the wrver wlectlon problem. Thl\ apphcattlon of the Hotr metric ~5 our mterpre tatlon of how It mght be uwd for wrver wlectlon.
Fig. 9. Unstructured Overh~s; TS-1OK; #/eve/s=l; #hndmwks= 12 by using our binning scheme to to approximate picking the Ic/2 closest nodes. Now, a node picks k/2 neighbors at random from its own bin and, as before, picks the remaining k/2 at random. We call this binning-based approximation algorithm BinShout- Long. If a node’s bin is not large enough for it to pick Ic/2 neighbors, it picks the required number of neighbors from bins that are most similar to its own bin where the degree of simi- larity beteen two bins is the number of positions in their land- mark orderings on which they match. Figure 9 plots the av- erage latency stretch ‘* for increasing system sizes for topol- ogy TS-1OK. We compare Short-Long, BinShort-Long and ran- domly constructed overlays where each node picks Ic neighbors at random. Note the difference in scaling behavior between Ran- dom and Short-Long. We also see that BinShort-Long follows the scaling behavior of Short-Long. Thus our binning-based algorithm tracks the scaling behavior of the global-knowledge heuristic algorithm. Although the scaling behavior of Short- Long and BinShort-Long is similar, there appears to be a consis- tent performance gap between the two. To better understand this performance gap, we experimented with the following variant of BinShort-Long: rather than pick k/2 nodes at random from its bin, a node measures its RTT to a sample set of nodes in its own bin and picks the k/2 closest of the sampled nodes. Figure 9 shows once such case (labelled “BinShort-Long WI sampling”). We see that with sampling, the performance gap between Short- Long and BinShort-Long decreases indicating that for a given node, the nodes in its own bin are indeed a good approximation of the nodes closest to it in the entire system.
Our aim in going through the discussion in this section is not to claim that either Short-Long or BinShort-Long is the ideal algorithm for constructing unstructured overlays. Rather, our point was to demonstrate that if someone were to develop a good overlay construction algorithm that required global relative proximity information, then binning (and probably any other similar, scalable, proximity inference scheme) offers a scalable and accurate way of approximating this global information.
IV. TOPOLOGICALLY-AWARESERVERSELECTION The replication of content over the Internet gives rise to the problem of server selection, i.e. from which of the multiple
Topology Hotz Crtsn Bin Rand TS-1OK 3.50 2.35 2.40 4.94
TS-1K 2.31 1.35 1.58 5.92 PLRG 1 1.6 1.98 1.72 2.51 PLRG2 1.54 2.01 1.81 2.49
NLANR 1.32 1.51 1.39 2.27
TABLE11
Averrrge Stretch
For example, with the latter metrics, for a node to locate close- by nodes (the Short-Long algorithm of Section 111 required this), it must learn of all available nodes in order to compare its dis- tance to each one in turn. With binning on the other hand, a node need only learn about those nodes in its bin and can then pick one of them. Thus, binning serves as an implicit first-order screening process which makes binning-based schemes some- what easier to apply scalably.
For server selection, we define the latency stretch from a client node as the ratio of its latency to the server selected by a selection scheme to its latency to the optimal server (i.e. the ac- tual closest server). We then compute the average latency stretch as the ratio of the average latency to the selected server by the average latency to the closest server. We evaluate our server se- lection scheme using the test topologies described in Section 11. Table 11 compares the different server selection schemes over a range of different topologies. All the tests used 12 landmarks and 3 levels. The number of servers was set to 1000 servers for TS-lOK, 100 for TS-1 K, PLRGl and PLRG2 and 10 for NLANR. We see that Cartesian-based selection performs the best for Transit-Stub topologies but not as well on PLRGs while Hotz-distance based selection shows exactly the opposite behav- ior. Binning-based selection works well across all the topolo- gies. But again, the small performance differences between the different schemes is not particularly interesting. What is inter- esting however, is that the above results show that all the above simple topological hints work quite well. Our binning scheme is one such hint that has the added advantage of being easy to use in a scalable manner.
Figure 10 shows the effect of increasing numbers of land- marks on the performance of binning-based selection. We used 1,000 servers for TS-1Ok and 100 servers in all other cases. As expected, with increasing landmarks, performance improves but quite quickly offers diminishing returns. We suspect that the slight performance improvement for PLRGs is because most nodes are within a few (2-4) hops away from each other, and so even a randomly selected server is unlikely, in general, to be very far from the client.
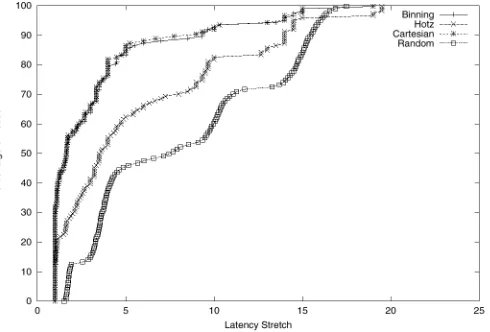
Plotting only the average latency stretch hides the individual node performance. In the remaining graphs we plot the distri- bution of stretch over all nodes. Figure 11 plots the cumula- tive distribution of the latency stretch for TS-1OK - transit-stub topology with 10,000 nodes - using 12 landmarks and 3 levels. Of the 10,000 total nodes, 1,000 nodes are selected at random as servers; the remaining act as clients. As can be seen, all three schemes perform significantly better than random server selec- tion. Cartesian distance and binning-based selection yield bet- ter results than the use of Hotz’s metric. The absolute value of
the latency stretch (on the X-axis) appears high, ranging up-to a factor of twenty. These high values are largely due to our hierar- chical link delay distribution (from Section II: 2ms inside Stub domains, 20ms inside Transit stubs and 5ms on Stub-Transit links). For example, consider a client whose closest server is within its own Stub domain. The closest server is then about 2ms away from the client. If the client incorrectly picks a server from across the Transit domain, then its distance to the selected server will be at least 34ms (2 + 5 + 20 + 5 + 2 as its trav- els from the source stub domain, across the transit domain and through the destination stub) yielding a stretch factor of approx- imately 17 even though a routing value of 34ms is quite good. To account for such inflated stretch values caused by having a server right next to a client, we recompute the stretch values in Figure 11 with the following adjustment: In calculating the la- tency stretch, we add a constant of 10.0 to both the numerator and denominator latencies. In other words,
Figure 12 repeats the results from Figure 11 with this adjust- ment. While the relative performance of the different schemes remains largely unchanged, we see that the absolute value of the stretch ranges falls dramatically showing that high stretch ratios are indeed for short latencies.
Figure 13 plots the cumulative distribution of stretch for the NLANR dataset (without the above adjustment since our NLANR trace did not have very short latencies to cause the above inflation problem). Of the 103 nodes in the dataset, we picked 10 servers at random, 12 landmarks at random, and the remaining nodes act as client nodes. The plot indicates that all three selection schemes perform significantly better than ran- dom selection. 50-60% of the nodes correctly select the closest server while around 90% of the nodes pick a server that is less than a factor of two away from the actual closest server.
Note that the Cartesian distance based selection has a longer tail than the other two selection schemes. Also, unlike our ear- lier simulation results, the performance of Hotz-distance based selection is competitive with the other two schemes. A conclu- sion one might draw from this plot is that we really do not need to work very hard to achieve good server selection. Hence in designing such topology inference systems one might argue that the simplicity, scalability and practicality of the system should be as important goals as prediction accuracy.
V RELATED WORK
1321 uses latency measurements to a set of well known land- marks to determine the geoguuplzic locality of Internet hosts. To determine geographic closeness between pairs of hosts, Geo- Ping uses a distance metric similar to the Cartesian metric de- scribed in Section IV. The authors in [ 14 1 describe a centralized clustering engine that uses BGP routing table dumps. For the reasons described in Section 1 we opted for a decentralized so- lution based only on end-to-end latency measurements.
In the context of application-level multicast, the authors in [ 281, [ 1.51, [ 271 propose heuristics for nodes in a multicast overlay to gradually improve the overlay structure to better map onto topology. Both schemes basically have nodes periodically probe other nodes to evaluate the usefulness of switching their neighbors in the overlay. In comparison, our binning scheme for topology awareness operates on short timescales and is, we believe, more lightweight.
Our initial work on CANS [ 41 explores a number of heuristics to lower the latency of CAN routing. These schemes however try to improve the selection of paths on an existing overlay. Our work in this paper, by contrast, tries to improve the structure of the overlay itself.
The authors in [ 331 propose a server selection technique
Fig. 13. CDF of Ic&nq w&h for NLANR d&r
where clients periodically perform measurements to all avail- able mirrors. Binning-based server selection instead requires a one-time measurement (with possible periodic refreshes) by the client to a small, fixed set of landmarks. In 1241, the accuracy of distance estimation in IDMaps is evaluated in the context of server selection. While the significant differences in the simula- tion environment make it is hard to draw any direct comparison, our server selection results appear at least comparable. The au- thors in [ 341 measure the the performance of certain commercial server selection schemes. Their results show that neither of the measured schemes achieve optimal (or even close to optimal) server selection but do improve significantly on random server selection. In view of the above, we find our server selection results very encouraging.
VI. CONCLUSION
lying network topology. Interestingly, our results using actual Internet traces better match simulations using PLRGs than the hierarchical TS topologies possibly providing application-level corroboration to previous work showing that the network-level topology of the Internet is well modeled by a PLRG [ 211, [ 201. While our results indicate that a small number of landmarks yield significant improvements which however, levels off quite quickly. Similar observations have been made by the authors in [ 24 1, [ 17 1. An open problem would be to understand just how much further improvement in performance might be possible us- ing sophisticated topology information.
ACKNOWLEDGMENTS
We would like to thank Ion Stoica and Eugene Ng for use- ful discussions, Brad Karp for the DNS root name server statis- tics, Yan Chen and Morley Mao for help with the NLANR data and Hongsuda Tangmunarunkit for providing us with the Power- Law Random Graphs.
REFERENCES
Gnutella, “http://gnutella.wego.com,” FreeNet, “http://freenet.sourceforge.net,”
I. Stoica, R. Morris, D. Karger, M. F. Kaashoek, and H. Balakrishnan, “Chord: A scalable peer-to-peer lookup service for internet applications,” in Proceedings of SIGCOMM 2001, Aug. 2001.
S. Ratnasamy, P. Francis, M. Handley, R. Karp, and S. Shaker, “A SC& able Content-Addressable Network,” in Proceedings of SIGCOMM 2001, Aug. 200 I
A. Rowstron and P. Druschel, “Pastry: Scalable, distributed object lo- cation and routing for large-scale peer-to-peer systems,” available at http://research.microsoft.com/ antr/PAST/, 2001.
J. Kubiatowicr et al., “Oceanstore: An Architecture for Glob&scale Persistent Storage,” in Proceedings of ASPLOS 2000, Cambridge, Mas- sachusetts, Nov. 2000.
D. Andersen, H. Balakrishnan, F. Kaashoek, and R. Morris, “The case for resilient overlay networks,” in HotOS VIII, Oberbayern, May 200 I Infrasearch, “http://www.infrasearch.com,”
Y. Chu, S. Rae, and H. Zhang, “A case for end system multicast,” in SIGMETRICS 2000, CA, June 2000.
IO] Inktoml, “http://www.mktoml.com,” I I] Akamal, “http://www.akamal.com,” 121 CIXO CDN, “http://www.cl\co.com/go/cdn,” 131 Napp\ter, “http://www.nap\ter.com,”
141 Balachander Krl\hnamurthy and Jla Wang, “On network aware clu\termg of web chat\,” m Proceedings of SIGCOMM ‘00, Stockholm, Sweden, Aug. 2000.
IS] Paul Frau\, “Yold: Extendmg the Internet multlca\t architecture,” Un pubh\hed paper, avvadable at http://www.ac~r~.org/yo~d/doc~/mdex.html, Apr. 2000.
161 P. Frau\ et al., “An Architecture for a Global Internet Ho\t Dl\tance E\tlmattlon Service,” m Proceedings IEEE Infocom ‘99, New York, NY, Mar. 1999.
171 E.Ng and H.Zhang, “Predlctmg Internet network dl\tance with coordlante\ ba\ed approacha,” Under \ubml\\lon, 2001.
IX] Yan Chen and Randy Katz, “On the placement of network momtormg \Ite\,” http://www.c\.berkeley.edu/ yanchen/wnm\/, 2001.
191 E. Zegura, K. Culvert, and S. BhattacharJee, “How to Model an Internet work,” m Proceedings IEEE Infocom ‘96, CA, May 1996.
201 M. Falout\o\, P. Falout\o\, and C. Falout\o\, “On Power law Relattlon \hlp\ of the Internet Topology,” m Proceedings of SIGCOMM ‘99, Cam bridge, MA, Sept. 1999, ACM.
2 I] H. Tangmunarunklt, R. Govmdan, S. Jamm, S. Shaker, and W. Wdhnger, “Network topologla, power law\ and hierarchy,” Tech. Rep. TROI 746, Techmcal Report, Umver\lty of Southern Cahforma, 2001.
221 W. Alello, F. Chung, and L. Lu, “A random graph model for ma\\we graph\,” m 32nd Annucd ACM Symposium on Theory of Computing. ACM,
2000.
1231 T. Hamen, J. Otero, T. McGregor, and H. Brawn, “Actwe measurement data analy\l\ techmquu,” htpp://amp.nlanr.net.
1241 Suglh Jamm, Cheng Jm, Ylxm Jm, Danny Raz, Yuval Shavltt, and Llxla Zhang, “On the placement of Internet m\trumentattlon,” m Proceedingc IEEE Infocom ‘00, Tel AVIV, Israel, Mar. 2000.
1251
1261
1271
1281
1291
I301
1311
1321
1331
1341
B. Zhao, J. Kublatowlcr, and A. Joseph, “Tapatry: An mfra\tructure for fault tolerant wide area locatlon and routmg,” UCB Techmcal Report,
200 I.
Antony Row\tron and Peter Druxhel, “Storage management and cachmg m PAST, a large x&, per\l\tent peer to peer storage utdlty,” m Proceed in,gy of the Eighteenth SOSP. ACM, 2001.
Y. Chu, S. Rae, S. Sahan, and H. Zhang, “Enabhng conferencmg apphca tlon\ on the Internet u\mg an overlay multIcat architecture,” m Proceed ing F of SIGCOMM 2001, Aug. 200 I
Y. Chawathe, S. McCanne, and E. Brewer, “An architecture for m ternet content dl\trlbutlon a\ an mfra\tructure \crvu,” avvadable at http://www.a.berkeley.edu/ yatm/paper\, 2000.
M.R.Garrey and D.S.John\on, Computers and Intrrrctcrhilit~: A Guide to the Theory of NP completeness, W.H.Freeman and Company, San Fran c,\co, CA, 1979.
S. Hotr, “Routmg mformattlon orgamzattlon to support xalable routmg with heterogeneou\ path requrement\,” Tech. Rep. PhD the\15 (draft), Umver\lty of Southern Cahforma, 1994.
Jame\ Guyton and Michael Schwartz, “Locatmg nearby copx\ of reph catted Internet server\,” m Proceedings of SIGCOMM ‘95, Boston, MA, Sept. 1995, ACM.
V.N.Padmanabhan and L.Subramanun, “An mvutlgattlon of geographic mappmg techmque for Internet ho\&,” m Proceedings of SIGCOMM 2001, Aug. 2001.
Z. Fa, S.Bhattach=Jee, E. Zegura, and M. Ammar, “A novel server \elec tlon techmque for lmprovmg the re\pon\e time of a rephcated \crv~cc,” m Proceedings IEEE Infocom ‘98, San Franclxo, CA, Mar. 1998.
![The Magnificent [Group] Seven: Usability Test Plan for Wikipedia.org. Erin Honeycutt Awnali Mills Jennifer Parker Kelli Bragg Walt Barrett](data:image/gif;base64,R0lGODlhAQABAIAAAP///wAAACH5BAEAAAAALAAAAAABAAEAAAICRAEAOw==)