ISSN(Online): 2319-8753 ISSN (Print): 2347-6710
I
nternational
J
ournal of
I
nnovative
R
esearch in
S
cience,
E
ngineering and
T
echnology
(A High Impact Factor, Monthly, Peer Reviewed Journal) Visit: www.ijirset.com
Vol. 8, Issue 10, October 2019
Study of Performance of Lubricants Used on
Sizing Machine
Sunil B. Mhetre
1,
Irshad M. Momin
2, Avadhut T. Hirugade
3Associate Professor, Department of Textile, DKTE Society’s Textile & Engineering Institute, Ichalkaranji,
Maharashtra, India1
Assistant Professor, Department of Textile, DKTE Society’s Textile & Engineering Institute, Ichalkaranji,
Maharashtra, India2
Vardhaman Textiles, Baddi, Himachal Pradesh, India3
ABSTRACT: Lubrication system of any machine is critical in the Textile Industry. The basic problem in the lubrication of Textile machinery is that the product comes into intimate contact with the machine parts and any contamination of the product or the lubricant cannot be tolerated. The new machines are designed with a view to work them at very high speeds over long periods without major break- down. Lubrication, therefore, is becoming more and more critical in maintaining both the efficiency and reliability of machines and thereby, the quality of the finished product. A majority of the problems and breakdowns on machines occur due to faulty lubrication. Cost effectiveness can be achieved only when the effective maintenance with lubrication is given prime importance. Effective performance of machine requires careful selection of lubrication system, the lubrication which gives long life to machine.
KEYWORDS:Sizing machine, lubrication, viscosity, contamination, spectrography.
I. INTRODUCTION
Today’s weaving preparatory machines give much faster production because of their high speed. Lubrication plays important role in maintenance of modern sizing machines. Good lubrication practices give high speed as well as high efficiency. The advancement in the environmental condition of industrial machinery working such as high temperature, high pressure and dynamic condition has demanded the new characteristically requirement of lubricant and their properties. The fluid lubricants are commonly used for reduction of wear, elimination of heat and corrosion etc.
II. RELATEDWORK
ISSN(Online): 2319-8753 ISSN (Print): 2347-6710
I
nternational
J
ournal of
I
nnovative
R
esearch in
S
cience,
E
ngineering and
T
echnology
(A High Impact Factor, Monthly, Peer Reviewed Journal) Visit: www.ijirset.com
Vol. 8, Issue 10, October 2019
III. MATERIAL & METHODS USED
The material and equipment used for the various types of oil and its testing are as follows. Oil samples are collected from headstock zone & dryer zone of sizing machine. Type of oil used is MOBIL SHC 632 for headstock zone & Kuber synthetic Gemcp gear oil for dryer zone. The samples collected are as follows:
1) Fresh oil.
2) Sample set I – Four years used oil and 3) Sample set II – Seven years used oil.
IV. RESULTS & DISCUSSIONS
To study the extent of lubricating oil degradation, testing of the following oil properties were carried out.
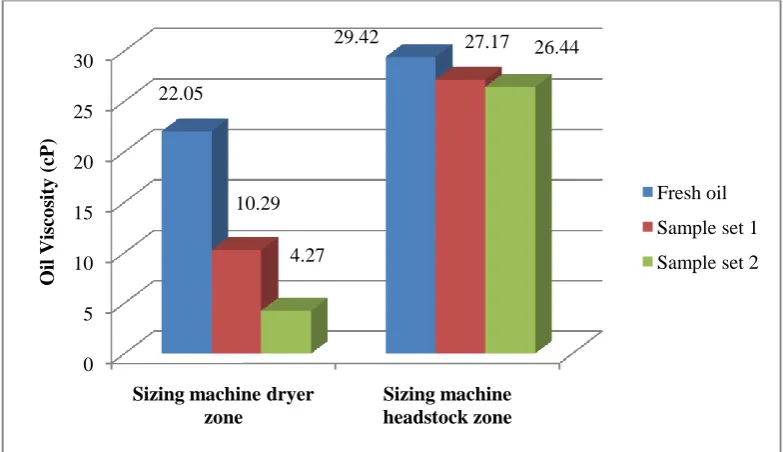
IV(A)OILVISCOSITY:
Viscosity results obtained by testing given oil samples at 25°C are represented in Figure 1. Viscosity is measured in centipoise (cP).
Figure 1: Viscosity results of selected oil samples.
It has been observed that oil viscosity decreases after certain period of time. The reasons behind decreasing oil viscosity may be one or more of the following. When the temperature of oil increases the particle moves faster and begins to move away from each other due to which viscosity of oil decreases. In addition lubricant also dissipates heat. This means the lubricant will sometimes be overheated. Overheating can cause the light ends of lubricant to vaporize or the lubricant itself to decompose. This can cause certain removal of additives from system, which affect the viscosity. When temperature greatly exceeds, the larger molecules will break apart into smaller molecules. This thermal cracking also referred as thermal breakdown, causes decrease in viscosity.
The concentration is amount of substance dissolved in a specific volume, because of temperature, heat dissipation and thermal breakdown. Concentration decreases which results in decreasing oil viscosity. The particle of same substance has an attractive force. Same substance has strong attractive force while other substance has weak attractive force, because of addition of contaminants it will affect the attractive force and cause decrease in oil viscosity. Due to
0 5 10 15 20 25 30
Sizing machine dryer zone
Sizing machine headstock zone 22.05
29.42
10.29
27.17
4.27
26.44
O
il
Vis
co
sit
y
(
cP
)
Fresh oil
Sample set 1
ISSN(Online): 2319-8753 ISSN (Print): 2347-6710
I
nternational
J
ournal of
I
nnovative
R
esearch in
S
cience,
E
ngineering and
T
echnology
(A High Impact Factor, Monthly, Peer Reviewed Journal) Visit: www.ijirset.com
Vol. 8, Issue 10, October 2019
various motions in gear box, shear force acts on lubricant which cause thinning of lubrication film resulting in decrease of viscosity. During actual working and during maintenance work such as cleaning, the foreign particles get added to lubricants which hampers viscosity.
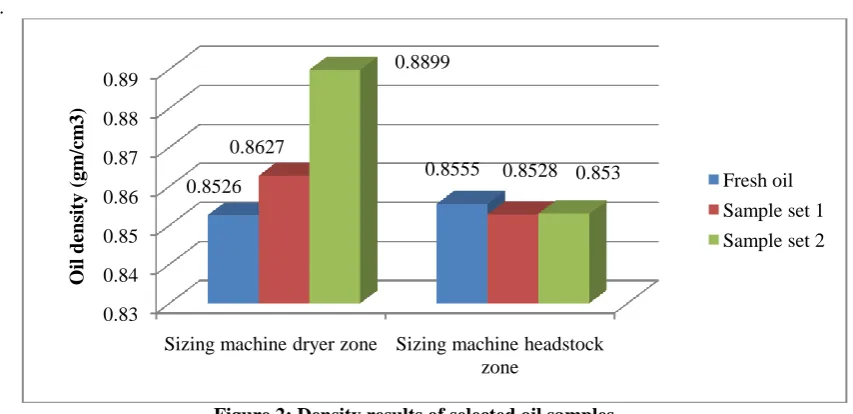
IV (B) OIL DENSITY:
Oil density results obtained by testing selected oil samples are represented in Figure 2. Density is measured in gm/cm3.
Figure 2: Density results of selected oil samples.
From Figure 2 it has been observed that oil density increases after certain period of time. The reasons behind the increase in oil density may be of addition of wear particles of metal contaminations.
IV (C) POUR POINT:
Oil pour point results obtained by testing selected oil samples are represented in Figure 3.
Figure 3: Pour point results of selected oil samples. 0.83 0.84 0.85 0.86 0.87 0.88 0.89
Sizing machine dryer zone Sizing machine headstock
zone 0.8526 0.8555 0.8627 0.8528 0.8899 0.853 O il dens it y ( g m /cm 3 ) Fresh oil
Sample set 1
Sample set 2
-5 -4.5 -4 -3.5 -3 -2.5 -2 -1.5 -1 -0.5 0
Sizing machine dryer zone Sizing machine headstock zone -1 -5 -1 -3 -2 -2 P o ur po int (° C) Fresh oil
Sample set 1
ISSN(Online): 2319-8753 ISSN (Print): 2347-6710
I
nternational
J
ournal of
I
nnovative
R
esearch in
S
cience,
E
ngineering and
T
echnology
(A High Impact Factor, Monthly, Peer Reviewed Journal) Visit: www.ijirset.com
Vol. 8, Issue 10, October 2019
It has been observed that oil pour point increases after certain period of time. The reasons behind the increase in oil pour point may be one or more of the following - cooling rate, formation of large crystal during solidification, temperature, improper additives or contaminants present in oil etc.
IV (D) OIL FLAMMABILITY:
Flash point results obtained by testing selected oil samples are represented in Figure 4.
Figure 4: Flash point results of selected oil samples.
It has been observed that flash point of oil sample in drying zone was decreased after certain period of time. It may be due to addition of wear particles in oil, oil cracking, etc. For headstock zone sample it is found to be increased due to contamination, wrong mixing of oil etc.
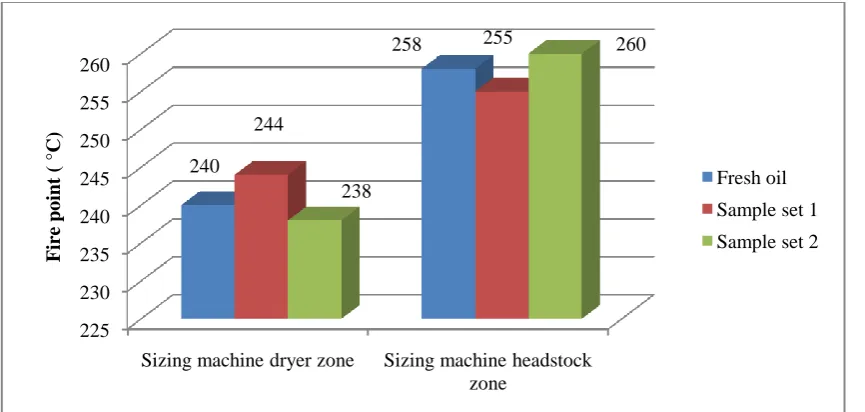
Fire point results obtained by testing selected oil samples are represented in Figure 5.
Figure 5 : Fire point results of selected oil samples. 220 225 230 235 240 245 250 255
Sizing machine dryer zone Sizing machine headstock zone 237 246 242 249 232 255 F la sh po int ( °C ) Fresh oil 225 230 235 240 245 250 255 260
Sizing machine dryer zone Sizing machine headstock
zone 240 258 244 255 238 260 Fire p o in t ( ° C) Fresh oil
Sample set 1
ISSN(Online): 2319-8753 ISSN (Print): 2347-6710
I
nternational
J
ournal of
I
nnovative
R
esearch in
S
cience,
E
ngineering and
T
echnology
(A High Impact Factor, Monthly, Peer Reviewed Journal) Visit: www.ijirset.com
Vol. 8, Issue 10, October 2019
It has been observed that fire point of oil sample in drying zone was also after certain period of time. It may be due to addition of wear particles in oil, oil cracking, etc. For headstock zone sample it is found to be increased due to contamination, wrong mixing of oil etc.
IV (E) CARBON RESIDUE TEST:
Carbon percentage results obtained by testing selected oil samples are represented in Figure 6. Results are expressed in %.
Figure 6: Carbon % results of selected oil samples.
It has been observed that oil carbon percentage increases after certain period of time. The reasons behind increase in carbon percentage may be oxidation, micro dieseling, additive deplition, contamination etc.
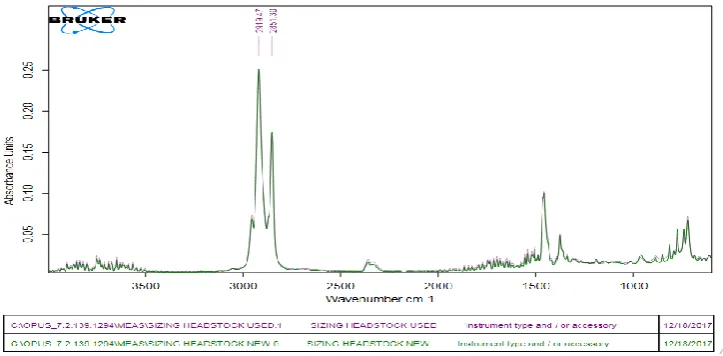
V. SPECTROSCOPY
For sizing machine overlapped spectroscopy graphs of headstock zone oil samples are as shown in Figure 7 and Figure 8.
Figure 7 : Headstock zone - Overlap fresh and used oil sample 1. 0
0.2 0.4 0.6 0.8 1 1.2
Sizing machine dryer zone
Sizing machine headstock zone
0.08 0.14
0.86
0.23 1.14
0.33
Ca
rbo
n
%
Fresh oil
Sample set 1
ISSN(Online): 2319-8753 ISSN (Print): 2347-6710
I
nternational
J
ournal of
I
nnovative
R
esearch in
S
cience,
E
ngineering and
T
echnology
(A High Impact Factor, Monthly, Peer Reviewed Journal) Visit: www.ijirset.com
Vol. 8, Issue 10, October 2019
For sizing machine (headstock zone) overlapped spectroscopy graphs for oil sample set I are shown in Figure 7. It is observed that both the spectra are overlaping one another, which means no degradation in oil sample after 4 years has taken place as compared to fresh oil.
Figure 8 : Headstock zone - Overlap fresh and used oil sample 2
.
For sizing machine (headstock zone) overlapped spectroscopy graphs for oil sample set II are shown in Figure 8. It is observed that both the spectra are having little difference in absorbency level, which means there is some degradation started in oil sample used for 7 years as compared to fresh oil.
Spectrum location
Table 1 : Spectrum location of sizing machine oil (headstock zone).
Spectrum location (cm-1) Change in absorbency
Figure 7 Figure 8
675 - 1000 0.06 – 0.07 0.04 -0.05
690 – 900 0.02 – 0.03 0.00 – 0.01
1400 - 1600 0.05 – 0.05 & 0.10 – 0.10 0.04 – 0.05 & 0.09 – 0.09
2840 – 3000 0.17 – 0.17 & 0.25 – 0.25 0.18 – 0.16 & 0.29 – 0.24
The peaks observed in both graphs are same so no any added functional group is present in sample. In this graph very small change in absorbency is observed which shows initial phase of oil degradation.
ISSN(Online): 2319-8753 ISSN (Print): 2347-6710
I
nternational
J
ournal of
I
nnovative
R
esearch in
S
cience,
E
ngineering and
T
echnology
(A High Impact Factor, Monthly, Peer Reviewed Journal) Visit: www.ijirset.com
Vol. 8, Issue 10, October 2019
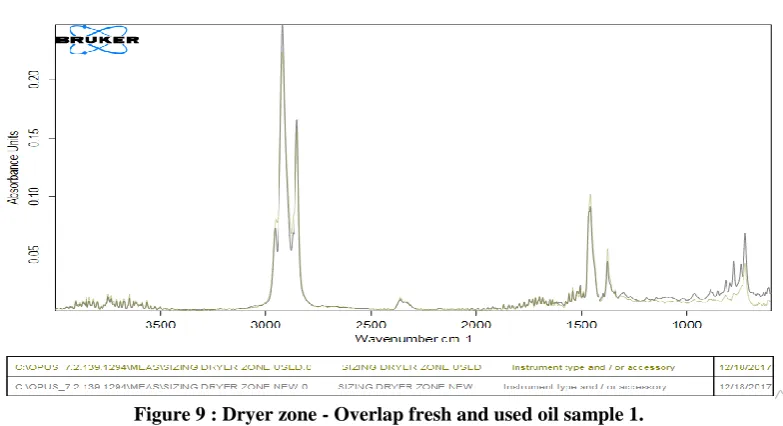
Figure 9 : Dryer zone - Overlap fresh and used oil sample 1.
For sizing machine (dryer zone) overlapped spectroscopy graphs for oil sample set I are shown in Figure 9. It is observed that both the spectra are almost overlaping one another, which means no degradation in oil sample after 4 years has taken place as compared to fresh oil.
Figure 10 : Dryer zone - Overlap fresh and used oil sample 2.
ISSN(Online): 2319-8753 ISSN (Print): 2347-6710
I
nternational
J
ournal of
I
nnovative
R
esearch in
S
cience,
E
ngineering and
T
echnology
(A High Impact Factor, Monthly, Peer Reviewed Journal) Visit: www.ijirset.com
Vol. 8, Issue 10, October 2019
Table 2 : Spectrum location of sizing machine oil (dryer zone)
Spectrum location (cm-1) Change in absorbency
Figure 9 Figure 10
675 - 1000 0.06 – 0.04 0.06 – 0.05
690 – 900 0.03 – 0.02 0.00 – 0.01
1400 – 1600 0.05 – 0.06 & 0.09 – 0.10 0.04 – 0.05 & 0.09 – 0.10
2840 – 3000 0.16 – 0.15 & 0.24 – 0.21 0.17 – 0.14 & 0.29 – 0.21
For sizing machine (dryer zone) overlapped spectroscopy graphs are shown above. These spectrum shows little changes. The peaks observed in both graphs are same so no any added functional group is present in sample. In this graph very small change in absorbency is observed which shows initial phase of oil degradation.
Reasons for change in absorbency:
1. Heat absorption capacity: During the actual working the heat generation takes place which affects the absorbency capacity of molecules.
2. Molecular forces or bond strength decreases: Because of heat generation the bond strength between molecules
decreases which causes change in absorbency.
3. Addition of water or increase in acid number: Because of continuous action, breakdown of molecules takes place and free – OH group gets attached to the free branch of carbon. The absorbency capacity of original compound and newly formed compound is different.
4. Addition of unsaturated group: Addition of unsaturated compound like alkene or alkyne causes change in absorbency level.
5. Color change due to addition of fine particle: Because of continuous working, addition of worn-out metal particles, addition of contaminant causes change in color of oil.
6. Intensity: The intensity is nothing but intensity of IR radiation. The change in intensity of IR radiation at the particular testing time causes difference in absorbency.
7. Opaque: Some time the oil under testing shows opaque nature which avoid penetration of IR radiation and causes change in absorbency level.
VI.CONCLUSIONS
A well balanced oil analysis program can monitor machine wear condition, oil contamination and oil degradation simultaneously. There are many different approaches to implement an oil analysis program, depending on the application and maintenance objectives. The result presented by fresh and used oil of headstock zone and dryer zone of sizing machine shows that there is a considerable change in oil properties of 7 year used oil than 4 year used oil. The spectroscopy graph also shows change in absorbency level.
ACKNOWLEDGEMENT
The authors are very much thankful to the management of DKTE Society’s Textile and Engineering Institute, Ichalkaranji, Maharashtra, India for their constant encouragement and motivation in publishing this article.
REFERENCES
[1] Yuegang Zhao, Oil Analysis Handbook for Predictive Equipment Maintenance, pp.25 (2014).
[2] Harish Hirani “Online Condition Monitoring of high speed gears using vibration and Oil Analysis”, Thermal Fluid and Manufacturing Science (2012).
ISSN(Online): 2319-8753 ISSN (Print): 2347-6710
I
nternational
J
ournal of
I
nnovative
R
esearch in
S
cience,
E
ngineering and
T
echnology
(A High Impact Factor, Monthly, Peer Reviewed Journal) Visit: www.ijirset.com
Vol. 8, Issue 10, October 2019
[4] Michael Garry, John Bowman “FT-IR analysis of used lubricating oils – General considerations”, Thermo scientific, WI USA (2007),
www.thermo.com
[5] R. R. Gosai, “Lubrication in weaving department”, BTRA Journal research paper.
[6] William F. Parish, “Lubrication of textile mill”, Ne’ I England cotton manufacturers associations. C M Everest John Wiley & Sons, 1893. [7] A. R. Lansdown, Lubrication and Lubricant selection A practical guide, Professional Engineering Publishing Ltd. London pp 203 (2004). [8] A. M. Nagar, “Optimisation utilisation of Lubricants in textile mills”, The Indian Textile Journal, Dec. 1985.
[9] A. D. Dongare and A. J. Gite, “Experimental analysis of tribological properties of various lubricating oils without and with using extreme pressure additives by using four ball extreme pressure oil testing machine”, IOSR Journal of Engineering, pp10-27 Vol. 4, Issue 8, August 2014.
[10] M. Farooq, A. Ramli, S. Gul and N. Muhammad (2011) “The study of wear behaviour of 12- hydroxystearic acid in vegetable oils” Journal of Applied Science 11(8) : 1381-1385.
[11] Ohno N. and Kuwano N. “Observation of mechanical behaviour of solidified oils bt using photoelastic method”, Journal of Japan Society of Lubrication Engineers 33,9, pp693-699.
[12] Ohno N. “Prediction of liquid lubricant viscosity at high pressure from the density measurements” Journal of Japanese Society of Tribologists, 44,7, pp560-566 (1999).
BIOGRAPHY
Sunil B. Mhetre is working as Associate Professor in DKTE Society’s Textile and Engineering Institute, Ichalkaranji, Maharashtra, India. He is having 28 years of teaching experience and 10 years of research experience.
Irshad M. Momin is working as Assistant Professor in DKTE Society’s Textile and Engineering Institute, Ichalkaranji, Maharashtra, India. He is having 15 years of teaching experience and 4 years of industrial experience.