American
Society of Range Management
The American Society of Range Management was created allied technologists, and to encourage professional improvement in I947 to foster advancement in the science and art of grazing of its members.
land management, to promote progress in the conservation and Persons shall be eligible for membership who are interested greatest sustained use of forage and soil resources, to stimu- in or engaged in practicing range or pasture management or late discussion and understanding of scientific and practical animal husbandry; administering grazing lands; or teaching, range and pasture problems, to provide a medium for the or conducting research, or engaged in extension activities in exchange of ideas and facts among society members and with range or pasture management or related subjects.
T
he JOURNAL OF RANGE MAN- AGEMENT , published bi-monthly, is the official organ of the American Society of Range Management. The Society, however, assumes no responsibility for the statements and opinions expressed by authors and contributors.Off ice, Executive Secretary. Address all inquiries and correspondence including memberships, renewals, replacements of JOURNALS, etc., to Executive Secretary, American Society of Range Management, P.O. Box 5041, Portland 13, Oregon. Dues. Membership dues should be sent to the Executive Secretary. The dues are $8.00 per year including, a subscrip- tion to the JOURNAL OF RANGE MAN- AGEMENT. Dues for student members are $4.00 per year, including the JOURNAL. All subscriptions mailed outside the North American continent and insular possessions of the U. S. are $8.50 per year. Subscrip- tions must be paid in advance. Remit by draft or check on U. S. banks in U. S. funds. Reprinting. The reprinting of articles or parts of articles published in the JOURNAL OF RANGE MANAGEMENT is author- ized on the express condition that full credit be given the JOURNAL and the author. The date of original publication must be shown with the credit line.
Posf Office Enfry. Second-class post- age paid at Portland, Oregon, and at ad- ditional offices.
Change of Address. Notices of change of address should be received by the Execu- tive Secretary one month before the date of issue on which the change is to take effect. Both the new and old addresses should be sent to the Executive Secretary, American Society of Range Management, P.O. Box 5041, Portland 13, Oregon.
Printers. The Nebraska Farmer Company, 1420 P Street, Lincoln, Nebraska.
Copyright 1960 by the American Society of Range Management.
JOURNAL OF RANGE MANAGEMENT
EDITOR E. J. WOOLFOLK
Pacific Southwest Forest & Range Exp. Sta. Berkeley 1, California
EDITORIAL BOARD 1958-60
ARNOLD HEERWAGEN W. R. HANSON
Soil Conservation Service Eastern Rockies Forest 321 New Customs Building Conservation Board
Denver 2, Colorado Calgary, Alberta
1959-61
GEORGE E. GLENDENING U.S. Forest Service
DONALD R. CORNELIUS Tempe, Arizona JACK R. HARLAN Agricultural Research Service
P. 0. Box 245 Oklahoma State University Berkeley 1, California Stillwater, Oklahoma
1960-62 F. A. BRANSON U.S. Geological Survey
Federal Center Denver, Colorado
L. T. BURCHAM LYNN RADER
California Division of Forestry University of California Sacramento, California Berkeley, California
OFFICERS OF THE SOCIETY
President:
FRED H. KENNEDY U. S. Forest Service Albuquerque, N. Mex.
President Elect:
V. A. YOUNG
Executive Secretary:
JOHN G. CLOUSTON
733 West 2nd St. P. 0. Box 5041
Mesa, Arizona Portland 13, Oregon
BOARD OF DIRECTORS 1958-60
JAMES L. FINLEY MELVIN S. MORRIS
P. 0. Box 136 University of Montana
Gilbert, Arizona Missoula, Montana
1959-61
JOHN CHOHLIS C. H. MCKINNON
Western Livestock Journal LK Ranches, Ltd. Sacramento, California Calgary, Alberta
1960-62
KARL G. PARKER GERALD W. THOMAS
Montana State College Texas Technological College
Bozeman, Montana Lubbock, Texas
Past President:
DONALD F. HERVEY Colorado State University
Fort Collins, Colorado HISTORIAN: A. A. BEETLE, Dept. of Agronomy,
IN THIS
ISSUE
Climatic Fluctuations in the Great Basin, 1931-56..._..Frederick L. Wernstedt 173
Wafer-Infake Studies on Range Soils af Three Locations in the
Northern Plains ._...__.__________~__________~_____Frank Rauzi
The Nutrient Status of Four Mountain Rangeland Soils in Wesiem Nevada and Eastern California . . .._._.Richard E. Eckert and A. T. Bleak
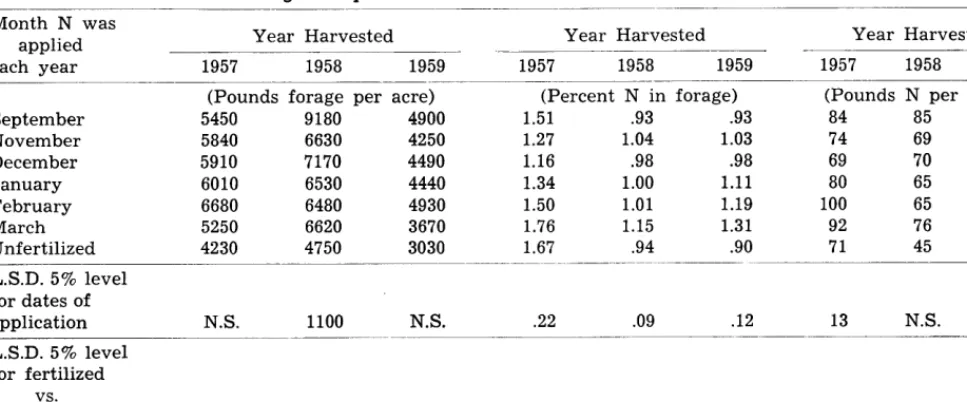
Responses of Annual Range fo Ura Applied ai Various Dates
Milton B. Jones
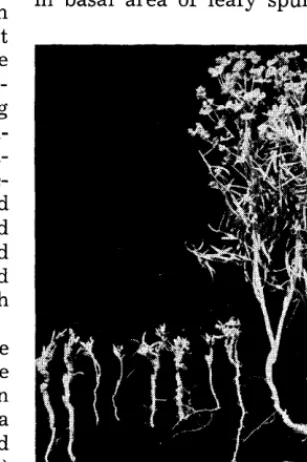
Effect of Selective Grazing by Sheep on the Control of Leafy
Spurge (Euphorbia esula L.) .._.._..._..A. Johnston and R. W. Peake
Integration in fhe Use of Public and Private Range in Pacific
Northwest Ranching ____ ____ ________________________________________._~ ________ __ ______ . . . . ..Tom Wilson
Effects of Burning and Clipping ai Various Times During fhe Wet Season on Tropical Tall Grass Range in Northern Australia
Edwin L. Smith
Fort Baker Ranges Returned fo Champagne Grasses.__...D. W. Cooper
Grass Management Pays Big Dividends . . . .._...._....__~____._~o~ace L. Leithead
Relationships Between Sprouting in Chamise and the Physiological
Condition of the Plant . . .._...MiZton B. Jones and Horton M. Laude
Technical Notes
Production of Native and Introduced Grasses in fhe Ponderosa Pine Region of Arizona...._...._...__C~a~Zes F. Cooper
Trirhabda Nifidicollis, A Pest of Rabbitbrush in New Mexico
Calvin L. Massey and Donald A. Pierce
Book Reviews: Methods of Vegetation Study (Edwin Allen Phillips); The Mammals of North America (E. Raymond Hall and R. Kelson); Approved Practices in Feeds and Feeding (Daniel W. Cassard); Soil, Grass and Cancer (Andre Voisin) ; Methods of Correllafion and Regression Analysis (Mordecai Ezekiel and Karl A. Fox)...._..._..
Current Literature ___________________________________________________________________.__________._______________________~.
With the Sections
News and Notes
Society Business
Cover
Photo- “TAKING
FIVE”
179
164
166
192
195
197
203
206
210
214
216
217
220
EDITOR’S ERROR
The photo erroneously carried as figure 1 of William F. Pringle’s article, page 139, number 3, volume 13, Journal of Range Management, May 1960, is correctly figure 2 of the Technical Note by Massey and Pierce appearing on pages 215 and 2 16 of this issue. Mr. Pringle’s photo was lost. My apologies to all concerned.
Journal of
Volume 13, Number 4 July, 1960RANGE
MANAGEMENT
Climatic Fluctuations in the Great Basin,
1931-56
FREDERICK L. WERNSTEDT
Associate Professor of Geography, The Pennsylvania State University, University Park, Pennsylvania
Drought is a persistent prob- lem for effective range manage- ment in the drier portions of the western United States. Whereas considerable study has been di-
rected toward correlation of
varying precipitation amounts and range yields, little research has been directed toward an un- derstanding of the magnitude of fluctuation in the area1 dimen- sion. While this is a problem
which assumes importance for
the geographer, since his pri- mary concern is one of spatial relationships, it is not without significance to those concerned with effective utilization of our western drylands.
Introduction
The expansion or contraction, and the deepening or lessening in severity, of the dryland cli- mates of the Great Basin of the United States have resulted in serious dislocation to the Great
Basin grazing economy. Area1
expansions of aridity bring
drought to agricultural regions that are inexperienced in coping
with decreased moisture; in-
creases in the severity of drought upset delicately balanced agri- cultural adjustments. Much has been written on the variability of one or more of the climatic elements. Such studies have em- phasized the fact that the magni- tude of year to year fluctuations is sufficient to obviate the use
of long term averages. The pres- ent paper intends to explore the year-to-year variability of cli- mate, both as to the area1 mag- nitude and degree of fluctuation of aridity, in the Great Basin of the United States.
The Great Basin of the United States
“Great Basin” is the topo- graphic term commonly applied to a major physiographic prov-
ince of the western United
States. The province, as gen- erally accepted, includes the ba- sin and range country of Ne- vada, western Utah and sections of eastern California, southeast- ern Oregon and southern Idaho which lies between the principal crest lines of the Wasatch Moun- tains and the Sierra Nevada- Cascades. Within these east-west bounds drainage is centripetal. The northern and southern lim- its of the Great Basin are not so clearly defined; nor is there
unanimity among physiograph-
ers concerning them. Since the present paper is concerned less
with physiographic and more
with climatic homogeneity a
northern limit has been selected so as to include the five south- eastern counties of Oregon and all of Idaho south of the Idaho Rockies. A somewhat arbitrary southern limit was selected
which marks the topographic
and climatic transitions into the
173
Sonoran desert area. This south- ern boundary roughly parallels U.S. Highway 91, extending in a straight line from El Cajon Pass, east of the Los Angeles lowlands, to a point in south- western Utah indicating the sep- aration between the Basin and the Colorado Plateau.
The Great Basin thus delim- ited is admittedly a region more of convenience; however, a con- siderable degree of geographical homogeneity is achieved within the area. Aridity, in varying de- grees, is generally prevalent throughout the region, except in peripheral areas and at higher elevations, and rather clearly separates the Basin from adjoin- ing areas to the north, east and west. Edaphic and biotic en- vironments also are remarkably similar within the Basin and dissimilar from adjacent regions.
The Great Basin thus delim- ited represents an area of ap-
proximately 238,000 square
miles.
Climatic Elements
The climatic elements of tem- perature, precipitation and rela- tive humidity, however, exhibit remarkably little north-south gradation in the Great Basin. Hot droughty summers, large di- urnal ranges of temperature, low relative and absolute humidities, general aridity and wide yearly and seasonal fluctuations from mean values characterize the climate of the entire Basin.
174
creasing latitude with Death
Valley (70”s) and areas in south- ern Nevada (60 OS) the warmer.
However, secondary warm re-
gions also occur along the north in the lowlands of the Snake River and around the Great Salt Lake and Salt Lake Desert areas. Latitudinal effects on mean an- nual temperatures are modified significantly by elevation, ex- posure, and the proximity of large water bodies.
Average summer temperatures show slight gradation from south to north. The less direct solar radiation in the higher latitudes is partially compensated by the increased duration of sunlight at
the more northerly stations.
Only increased elevation brings lower summer temperatures.
Average winter temperatures show greater latitudinal varia- tion than do the summer temper- atures-southern areas maintain approximately 45’ January tem- peratures while more northerly stations fall to below 20”.
The control upon temperatures exerted t h r o u g h latitude, coupled to the known high de- gree of atmospheric transpar- ency, the duration of sunlight, and the meagerness of a protec- tive vegetation cover bespeak of the entire Basin as an area of temperature extremes.
Temperature Variability Although temperature differ- ences from place to place in the Great Basin appear to be min-
imized when mean monthly or
annual values are employed, the year-to-year fluctuations from these average values are most
pronounced. Departure from,
rather than adherence to, mean temperature values is the rule. No part of the Great Basin has been completely free from freez-
ing temperatures-indeed, only
a few locales have escaped sub- zero minima. Conversely, with the exception of a few highland locations, daytime summer max-
imum temperatures everywhere
WERNSTEDT
in the Basin have exceeded 100”. Many stations have recorded ab- solute maxima in excess of 110” ; principally in the valley of the Snake River, the Salt Lake Des- ert and in southern Nevada and California, and a few locales have exceeded 120” (Death Val- ley, southern Utah and Califor- nia) .
Winter temperatures in partic- ular seem most susceptible to wide departure from mean val- ues. January, 1937 and 1949 were abnormally cold with average monthly temperatures well be-
low mean values (Figure 1).
During these years all of the Great Basin, excepting a 12,000
square mile area in extreme southern Nevada and California,
experienced average monthly
temperatures of less than 30”, and extensive areas throughout the Basin recorded values of less than 10”. In contrast, Janu- ary, 1953 was abnormally warm. During this latter year January
temperatures everywhere were
above 30”, large areas experi-
enced 40” temperatures and
southern regions remained in the 50”s.
Year-to -year fluctuations in
monthly, seasonal and annual
temperatures are of sufficient magnitude to seriously affect the
agricultural economy of the
f Goldfiold, Novodo
-25 I Richfirld, Idaho
II I I I I I I I I I ,, 1, )I, I,, , , 1 I 9
+ *s tP rs R”
FIGURE 1. Departures of Annual January Temperatures from Mean Values, 1931-1956,
CLIMATIC FLUCTUATIONS 175
Great Basin. Particularly the livestock industry, through loss by exposure, and winter wheat, through failure of germination, will suffer. Again stations far- ther north, particularly in Idaho
and northern Nevada, appear
more susceptible to greater tem- perature fluctuations in January than are the more southern lo- cales.
The magnitude of fluctuation in summer temperatures is nei- ther as great nor as significant agriculturally as the winter tem- perature fluctuations.
Average Precipifafion In general the Great Basin can be considered as a region of light (subhumid) precipitation. Ap- proximately one-seventh of the Great Basin receives an average annual precipitation of less than five inches; over one-half re- ceives less than ten inches, and 98-99 per cent receives less than twenty inches annually (Table
1). Extensive areas of the Great Basin are too dry for non-irri- gated agriculture in normal pre- cipitation years, in spite of a tendency throughout the Basin
toward a winter maximum re-
gime of precipitation and conse- quent lower evaporation. Those areas located at higher eleva- tions with western exposures
generally receive greater
amounts of precipitation; eastern slopes and interior basins, par-
---
FIGURE 2. Annual Precipitation of the Driest Year for the Great Basin, 1931-1956.
titularly in more southerly lati- tudes, receive least amounts. An extensive area in southeastern California and western Nevada
Table 1. Percentage of fhe Tofal Area of fhe Greaf Basin Included Within Selecfed Annual Precipiiafion Cafegories, 193 1-1956 *
Annual Precipitation Normal Year Driest Year Wettest Year
Less than 5” 15.3 47.6 0.5
5”_10” 36.5 49.9 11.7
lO”-20” 47.1 2.5 73.0
More than 20” 1.1 0.0 14.8
*Driest and wettest years are not necessarily simultaneous for each station.
Table 2. Percenfage of fhe Total Area of fhe Greaf Basin Included Wifhln Each Climafic Type, 1931-1956”
Type of Climate Average Year Driest Year Wettest Year
Arid (BW) 31.3 74.0 4.7
Semi-Arid (BS) 50.9 23.0 16.4
Humid (C and D) 17.8 3.0 78.9
*Driest and wettest years are not necessarily the same for each station.
lying immediately east of the Sierra Nevadas and extending northward to the latitude of Reno receives the least precip- itation (under 5 inches).
Precipifafion Variability The order of magnitude of pre- cipitation variability in the Great Basin is extreme, prob- ably as great or greater than for any other area in the United States (Visher, 1954). Consider- ing the Basin in its entirety, dur- ing the period 1931-1956, annual
precipitation averaged 11.41
176
16 inches in 1941 (Figures 2 and 3). Variations in seasonal pre- cipitations from year to year are equally extreme and of critical import to agriculture. The Great
Basin receives an average
“Spring Precipitation” (April through June) of 2.90 inches, yet values have fluctuated from less than 2 inches in 1931, 1934, 1939 and 1940, and on occasions entire months were rainless, to more than 4 inches in 1941 and 1944.
Consideration of the Great Ba- sin in its entirety, however large the year-to-year departures from mean precipitation values are,
overshadows the magnitude of
the individual station fluctu- ations. Not only are variation curves smoothed by averaging, b u t meteorological phenomena are neither similar nor simul- taneous throughout the B a sin. Frequently drought in northern sections of the Basin is attended by
average
or above average pre- cipitation in southern areas, or vice versa. Each station, indi- vidually, will experience a much greater magnitude of variability than over-all Basin conditions indicate.Plants, whether as an indige- nous or cultural cover, are sus- ceptible to precipitation vari- ability. Too little precipitation is especially destructive, result- ing in failure to germinate, death, decreased yields, inferior products and a host of attendant symptoms.
Climate
Geographers, climatologists
and agriculturists have long
sought ways to synthesize the
more important elements of a
climatic environment in order to analyze the relationships ex-
istent between climate and
plants. This sought-for objective has not met with complete suc- cess. Since the objective of this study concerns climatic variabil- ity and this objective can be at- tained regardless of whether
WERNSTEDT
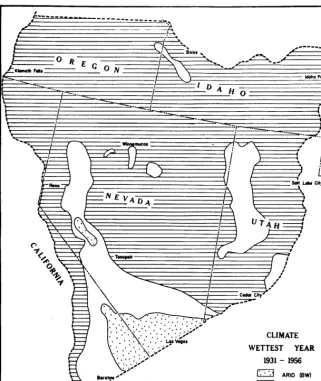
ANNUAL PRECIPITATKU WETTEST YEAR
1931- 1956
FIGURE 3. Annual Precipitation of the Wettest Year for the Great Basin, 1931-1956.
Koppen’s system of climatic classif ication (1936)) DeMar- tonne’s index of aridity (1927) or Thornthwaite’s precipitation effectivity (1948) is used, the more familiar Koppen classif i- cation is emp1oyed.l
Most of the Great Basin nor- mally experiences subhumid cli-
mates (Koppen’s BS and BW).
Humid climates (Koppen’s C and D) are generally encountered only at higher elevations where heavier precipitation, due to oro- graphic lifting, and lower tem- peratures result in greater avail- ability of moisture for plant nourishment.
Under norm al precipitation and temperature conditions ap- proximately 18 per cent of the
Basin experiences humid cli- mates, principally in the foot- hills of the Sierra Nevadas, Cas-
1 The system of climate classifica- tion first proposed by Dr. W. Koppen in 1923 and subsequently published in modified form in 1931 and 1936 was based primarily up- on botanic associations. Five basic climatic types were recognized and defined:
A climates-Tropical rainy climates B climates-Dry climates w h e r e evaporation exceeded precipitation. Two subtypes: BS (semi-arid) and BW (arid)
C climates-Warm temperate rainy climates
cades, W asatch and Bitteroot Mountains, in the higher moun- tains of central Nevada and in certain central Utah Piedmont areas. The remainder to the Ba- sin normally experiences arid or semi-arid climates.
The core of Great Basin arid- ity lies in western Nevada and eastern California immediately to the east of the Sierra Nevadas. Here a pronounced rain-shadow effect, coupled with the pres- ence of semi-permanent anticy- clonic circulation and higher temperatures, have combined to produce a 74,000 square mile area of arid climates. Lesser areas of arid climate are found in the Salt Lake Desert, and in isolated basins in western Ne-
CLIMATIC FLUCTUATIONS
vada. Except under irrigation these arid regions, representing 31 per cent of the Basin area, do not support permanent agricul- ture.
Much of the remainder of the Great Basin (51 per cent) ex- periences semi- arid climates- transitional arid-humid climates which neither exclude nor guar- antee success in non-irrigated agricultural pursuits.
Climatic Variability
The magnitude of climatic
variability is as great as the vari- ability in the individual climatic elements. Only a very small por- tion of the Basin has remained within the same climatic type during each of the years be-
CLIMATE DRIEST YEAR
1931- 1956 a ARID (SW) 0 STEPPE (BS) a HUMID (‘2 AND 0)
FIGURE 4. Climate of the Driest Year for the Great Basin, 1931-1956, according to the Koppen system of climatic classification.
177
tween 1931-1956. A small 10,000 square mile area in southeastern California and southern Nevada maintains its aridity, while at
higher elevations an 8,000 square mile area persists with perenni-
ally humid climates. The greater portion of the Great Basin, ap- proximately 92 per cent, alter- nates from one climatic type to another, frequently with disas- trous, although occasionally sa- lubrious, agricultural repercus- sions.
During the period 1931-1956 fully 74 per cent of the Great Basin experienced at least one arid year, more often undergoing a prolonged series of arid years. Similarly 79 per cent of the Ba- sin experienced at least one hu- mid year with, unfortunately, too seldom frequency (Figures 4 and 5).
Two areas within the Great Basin seem particularly suscep- tible to frequent and extreme climatic fluctuation: west cen- tral Utah and the Snake River valley. In these two regions moist subhumid or dry humid climates prevail sufficiently of- ten to encourage permanent ag- ricultural occupance. Both areas, however, can experience severe aridity, often for prolonged pe- riods.
Summary and Conclusions The raising of sheep and cattle is a major economic pursuit in the Great Basin. The industry generally is based upon open range grazing for at least a por- tion of each year. With a major dependence upon the availability and sufficiency of range forage it is obvious that climatic fluc- tuations will play a dominant role in the success of the grazing economy. Unfortunately statis- tical data are not perfected to the point that correlation be-
tween fluctuating livestock
178 WERNSTEDT
CLIMATE WETTEST YEAR
1931 - 1956 I: ARID (EW) 0 STEPPE (es) = HUMID (C AND 0)
FIGURE 5. Climate of the Wettest Year for the Great Basin, 1931-1956, according to the Koppen system of climatic classification.
a time when losses suffered In spite of the lack of adequate through preceding severe winter statistical data, the strong de- weather conditions and spring or pendence of a livestock industry summer drought have been re- upon prevailing climatic condi-
placed. tions in the Great Basin can be
amply demonstrated. Two cli-
matic conditions appear to ma- terially reduce livestock num- bers, i.e., severe winter tempera- tures and light precipitation. Sections of the Great Basin are particularly susceptible to fre- quent abnormally cold winters; winters cold enough to materi- ally reduce livestock numbers
through exposure, pneumonia,
and the inability of livestock to secure forage because of ground conditions. The combination of low precipitation, high day tem- peratures, low relative humidity, high evaporation, high winds,
high proportion of sunshine
cause plants to use available water more quickly.
Year-to-year fluctuations in climate, particularly in precipi- tation and winter temperatures, have profound short term effects upon the livestock industry in the Great Basin. These effects are manifested through reduc- tions of livestock herds brought about by exposure and vari- ations in range herbage supplies.
LITERATURE CITED
DEMARTONNE, E. 1927. Regions of
interior-basin drainage. Geo-
graphical Review. 17: 397-414. KOPPEN, W. 1936. Das geographische
system der klimate. Handbuch der
Klimatologie. Gebruder Born-
traeger, Berlin. 1: l-40.
THORNTHWAITE, C. W. 1948. An ap- proach toward a rational classifi- cation of climate. Geographical Review. 48: 55-94.
VISHER, S. S. 1954. Climatic Atlas of the United States. Univ. of Har- vard Press, Cambridge. 403 pp.
Argentine Opportunities
Argentina is interested in a positive program of range improvement. To further its grassland development and cattle improvement programs, Argentina is seeking two North American Range Management Specialists. Recruitment to fill these positions is now in process.
Water-Intake Studies on Range Soils at Three
Locations in the Northern Plains1
FRANK RAUZI
Soil Scientist, Soil and Water Conservation Research Division, Agricultural Research Service, U. S. Depart- ment of Agriculture, Laramie, Wyoming
The ability of rangelands to
absorb and store rain water is
of great importance in the pro-
duction of range forage, main-
tenance of stock water, and con-
trol of runoff and erosion. Every
effort should be made to im-
prove or maintain the storage
ability of these lands. This is
especially important in western
arid and semi-arid areas where
moisture is the limiting factor
in forage production.
Some of the more important
physical factors
affecting ab-
sorption and storage of water in-
clude soil and rainfall charac-
teristics, amount
of surface
cover, and type of management
prevalent on the areas (Duley
and Domingo, 1949; Lassen et al.,
1952; Osborn, 1952). Rainfall re-
tention is proportionally higher
with good vegetative cover pro-
tecting the soil because
this
leads to higher
water-intake
rates (Osborn, 1952; Rauzi 1956;
Rauzi and Zingg 1956).
Water-intake studies using a
truck-mounted
infiltrometer
(Figure 1) were conducted dur-
ing the summer months of 1956
at three locations in western
North Dakota and at four loca-
tions in Montana (Rauzi, 1956).
Fenceline comparisons forming a
contrast were utilized and a to-
1 Cooperative project between the Western Soil and Water Manage- ment Research Branch, Soil and Water Cons. Res. Div., ARS, U. S. Dept. Agr.; Soil Cons. Serv., U. S. Dept. Agr.; and the Wyoming Agri- cultural experiment station.
Published with the approval of the Director of the Wyoming Agricul- tural Experiment Station as Jour- nal Paper No. 109.
tal of 40 plots were studied.
Objectives of this study were
(a) to determine the effect of
different kinds and amounts of
grass cover on the ability of a
soil to absorb water, and (b) to
obtain a relative water-intake
rating for major soil types under
varying vegetative covers.
Methods and Materials
Simulated rainfall was applied
to a circular area of approxi-
mately 13 square feet by use of
a mobile infiltrometer. The test
plot for water-intake measure-
ments was 2 feet square and lo-
cated in the center of the area
receiving rainfall (Figure 2).
Under this arrangement, the test
plot was relatively free from the
influence of lateral water move-
ment. Water-intake rate was
measured as the difference be-
tween the rate of applied rain-
fall and the rate of measured
runoff. Surface detention, re-
tention, absorption, and inter-
ception by vegetation and mulch
material are included in the
measured intake but usually are
negligible after the first 15 to 30
minutes of the test.
Intensity of rainfall on the
test plot varied from 3.00 to 4.50
inches per hour. Rainfall was
applied to each plot for a l-hour
period and the amount of run-
off was determined at 15-minute
intervals which permitted eval-
uation of water intake by 15-,
30-, 45-, or 60-minute periods.
Rate of water intake during the
second 30-minutes was found to
be more stable than during ear-
lier periods and was believed to
be more nearly typical of con-
ditions during an actual storm.
This value was used along with
intake rate during the fourth 15-
minute period for all statistical
analyses.
All standing vegetation in the
test plot including previous
years’ growth was clipped
at
ground level one or two days
after the test. This material was
bagged, air-dried, and weighed,
and the yield computed
in
pounds per acre. All mulch ma-
terial on the test plot was col-
lected and yield determined in
the same manner.
Data for different range-con-
dition classes encountered were
grouped into two categories: ex-
FIGURE 1. Mobile raindrop applicator used to determine water-intake rates on rangelands.
180 FRANK RAUZI
FIGURE 2. Two by two foot square plot exclosure with runoff spout attached as used in this study. The burlap on the spout is to absorb simulated rainfall to prevent splash into
the plot.
cellent and good ranges were grouped as “high” and fair and poor ranges as “low.” Range con- ditions and so i 1 s descriptions were obtained from Soil Conser- vation Service technicians in the areas studied.
Locations
Three sites studied in North Dakota were located in Williams County within a lo-mile radius of Williston in a lo- to 14-inch rainfall belt. Fenceline contrasts used were between rangelands rated in excellent and fair con- ditions (Figure 3). Soil texture was classed as loam. The dom-
inant grasses were western
wheatgrass (Agrop yron smithii), needle-and-thread (Stipa com- ata), and blue grama (Bouteloua gracilis).
Two of the four sites in Mon- tana were in McCone County in a lo- to 14-inch rainfall belt. One was located approximately 2 miles northeast of Circle, Mon- tana, and the- other approxi- mately 15 miles west of the Wolf Point Bridge, south of the Mis- souri river. The two sites form- ing the fenceline contrast were rated in good and fair range con- dition (Figure 4) . Soil texture
was classed as silt loam. Western wheatgrass, needle-and-thread, and blue grama were again the dominant grasses. At the time of test this area was extremely dry and growth was very lim- ited.
The other two sites in Mon- tana were in Glacier County in a 15-to 19-inch rainfall belt, one approximately 18 miles north- west of Browning and one ap-
proximately 2 miles east of East Glacier. The site northwest of Browning was a fenceline con- trast rated excellent and poor. Soil texture was classed as loam. The site east of East Glacier was a fenceline contrast rated ex- cellent and fair. Soil texture was classed as silt loam. Both sites are in the 15- to 19-inch- rainfall belt. Dominant grasses were rough fescue (Festuca sca- brella), Idaho fescue (Festuca idahoensis), and wheatgrasses (Agropyron spp.). Shrubby cinquefoil (Potentilk fruticosa) was found on both the high and low range conditions along with several forbs, both annual and perennial.
Resulfs
Willisfon, North Dakota Area
In the Williston, North Dakota area average water-intake rate for the three sites during the second 30-minute period of the l-hour test was 3.02 inches per hour on the high-condition range and 1.14 inches on the low-condi- tion range (Table 1). Average rate during the fourth 15-min- ute period was 2.88 inches per hour for the high condition range and 0.96 inch on the low-condi- tion range.
FIGURE 3. Fenceline contrast at North Dakota Site 1, located approximately 6 miles
northeast of Williston, N. Dak. The contrast is between range in excellent and in fair
WATER-INTAKE STUDIES 181
Table 1. Wafer-intake rate and pounds of forage and mulch per acre on rangelands in high and low range con- dition for three sites near Willisfon, North Dlakofa, 1956.
Site* Forage Range Condition Mulch
Intake Rate during l-hour Test of
Second 30-minutes Fourth 15Minutes
High Low High Low High Low High Low
Lbs. per Acre Lb. per Acre Inches per hour Inches per hour
1 3,030 880 2,280 1,070 2.76 1.41 2.64 1.28
2 3,020 650 2,020 1,570 3.11 0.81 2.96 0.56
3 2,410 770 3,280 990 3.19 1.20 3.04 1.00
Average 2,820 770 2,530 1,210 3.02 1.14 2.88 0.96
:% Each range condition had three test plots for a total of 6 plots per site.
There was an average of 2,820 pounds per acre standing vege- tation at the time of test for the three sites rated in high condi- tion and 770 pounds per acre for the sites rated in low condi- tion. Sites rated in high condi- tion had received limited or no use by livestock whereas two of the three sites rated in low con- dition were being utilized at the time of test and the other site was being rested for the year.
On these three sites the
amount of standing vegetation
and mulch present was quite
uniform within the two range
groups. Higher water-intake
rates were associated with the better cover conditions, which protected the soil from raindrop impact and thus prevented the sealing of the pore spaces which occurs on bare soil. A storm in- tensity of between 2.00 and 2.50 inches per hour for a 30-minute period would be expected to oc- cur in this area once in five years (Yarnell, 1935). On the basis of the second 30-minute period of the l-hour test, rangelands rated in good condition would have sufficient cover to prevent major runoff from such a storm.
McCone County, Montana Area At the study areas in McCone County, Montana, water-intake rate during the second 30-min- ute period of the l-hour test on ranges rated in high condition was 1.41 inches per hour and 0.90 inch on ranges rated in low condition (Table 2) . During the fourth 15-minute period of the l-hour test, ranges rated in high
condition had a water-intake rate of 1.36 inches per hour com- pared to a rate of 0.76 inch on ranges rated in low condition.
Standing vegetation present at the time of test was 1,740 pounds per acre on the high-condition ranges and 620 pounds per acre on the low-condition ranges. To- tal cover, including mulch ma- terial, for the high-condition range was 3,090 pounds per acre and 1,230 pounds per acre on the low-condition range.
There was only 0.51 inch per hour difference between the two conditions during the second 30- minute period. This would tend to indicate that differences be- tween range conditions for these two sites were not very great.
At the time of test the ranges rated in high condition had re- ceived little or no use, whereas those ranges rated in low con- dition were being utilized.
Glacier County, Montana Area At the Glacier County, Mon- tana sites water-intake rate av- eraged 2.19 inches per hour dur- ing the second 30-minute period of the l-hour test on the ranges rated in high condition and 0.88 inch for the ranges rated in low condition. During the fourth 15- minute period water-intake rate on the high condition range was 2.04 inches per hour and 0 inch on the low-condition range.
There was an average of 4,130 pounds per acre standing vege- tation on the high condition
FIGURE 4. Fenceline contrast at Montana Site 2, located approximately 15 miles south
182
RAUZIFIGURE 5. Fenceline contrast at Montana Site 4, east of East Glacier. Pasture on the left of the fence is used as winter pasture and rates in excellent condition. The pasture to
the right of the fence is rated in fair range condition.
range and 1,870 pounds per acre
on the low-condition range at
the time of test. Mulch material
averaged 5,740 and 2,030 pounds
per acre, respectively, for the
high and low range condition.
Ranges rated in high condition
had received no use from live-
stock at the time of test, as they
are used for winter pasturage.
The low-condition ranges were
being utilized at the time of test
(Figure 5) .
Multiple Regression Analyses
The data indicated that forage
yield and mulch seemed to be
related rather. closely to water
intake. To test this hypothesis,
individual plot data were ana-
lyzed by means of multiple re-
gression analysis to determine
the degree of association be-
tween the variables.
An analysis combining all sites
was made using water-intake
rate (fourth 15-minute period)
as the dependent variable (Y)
and forage yield X, (tons per
acre) and mulch X, (tons per
acre) as the independent vari-
ables. The correlation coefficient
for this analysis was R= 0.637,
which showed that the forage
yield and mulch accounted for
approximately 41 percent of the
variation in water-intake rates.
The regression equation (Ey =
0.2264 X, + 0.0170 X, + 0.14)
was statistically significant at
the 0.01 level. Partial correla-
tion coefficients for the inde-
pendent variables, forage yield,
r = 0.635, and mulch, r = 0.456,
indicate that both independent
variables contribute significant-
ly to the water-intake rate.
Since total regression
ac-
counted for only 41 percent of
the variation in water-intake
rates, the three different areas
(Williston, McCone, and Glacier
County) were analyzed separ-
ately to determine if a closer as-
sociation among the variables
existed for the individual areas.
Sites in the Williston area had
a correlation coefficient of R =
0.915, which indicated that vari-
ations in forage and mulch yield
accounted for 84 percent of the
variation in water-intake rate.
The regression equation (Ey =
0.4134 x, + 0.0229 x, + 0.09)
was statistically significant at
the 0.01 level. Partial correlation
coefficients for the independent
variables were for forage yield,
r = 0.914, and mulch, r = 0.575,
indicating again that both inde-
pendent variables contribute sig-
nificantly to water-intake rates
but that forage yield was more
closely related to water-intake
rates than was mulch.
The two sites in McCone
Table 2. Wafer-intake rate and pounds of forage and mulch per acre on rangeland in high and low range con- dition for four sites in Montana, 1956.
Mulch Intake Rate during l-hour Test of
Site* Forage Range Condition Second 30-minutes Fourth 15-minutes
High Low High Low High Low High Low
Lbs. per Acre Lbs. per Acre Inches per hour Inches per hour
McCone County ’
1 1,880 660 1,710 530 1.35 0.79 1.52 0.60
2 1,600 580 990 690 1.47 1.02 1.20 0.92
Average 1,740 620 1,350 610 1.41 0.90 1.36 0.76
Glacier County
3 3,890 1,360 5,470 2,970 1.80 0.71 1.56 0.42
4 4,380 2,380 6,000 1,100 2.59 1.05 2.64 1.00
Average 4,135 1,870 5,735 2,035 2.19 0.88 2.04 0.76
WATER-INTAKE STUDIES 183
County had a correlation coeffi- infiltration of rainwater and in absorb the maximum amount of cient of R = 0.672 indicating that
variation in forage yield and mulch accounted for 45 percent of the variation in water-intake rates. The regression equation
(Ey-0.1544X, + 0.980X, +
0.13) was not statistically sig- nificant but approached signifi- cance at the 0.5 level. Partial correlation coefficients for the independent variables were for forage yield: r = 0.658 was sig- nificant at the .05 level, and for mulch, r = 0.592, approached significance at the .05 level in- dicating that both independent variables contribute to water- intake rates.
The two sites in Glacier County had a correlation coeffi- cient of R = 0.803, which showed that variation in yield and mulch accounted for 65 percent of the variations in water-intake rates. The regression equation (Ey = 0.1148 X, + 0.0864 X, + 0.01) was statistically significant at the 0.01 level. Partial correlation coefficients for the independent variables, forage yield, r = 0.749, and mulch, r = 0.756, indicate
that both of the independent variables contributed signif i- cantly to water-intake rates.
Further analysis showed that the three regressions were dif- ferent and that the three areas represent three distinct popula-
tions. When the areas were
grouped together, only 41 per- cent of the variation in water- intake rates was accounted for by variation in amount of forage yield and mulch, but, when ana- lyzed separately, from 45 to 84 percent of the variation was ac- counted for.
Discussion
These studies on water-intake rates on rangelands emphasize the importance of vegetation and mulch material in increasing the amount of rainfall absorbed by
the soil. Dyksterhuis and
Schmutz (1947) state that with few exceptions, mulches are the primary factor in determining
preventing erosion. The pastures rated in low condition had less water intake because too heavy use had decreased the amount of standing vegetation and mulch material, which bared the soil to the sealing action of the rain- drops. Duly and Domingo (1949) found that when the grass was clipped and the litter removed, water-intake rates were reduced because of a loss of the surface protection. Trampling by live- stock probably contributed to the lower absorption capacity of the soil. Lassen et al. (1942) state that the principal effect of soil compaction, so far as soil- water relations are concerned, is the reduction of pore space and increase in soil density. As a result, ranges rated in high condition took in almost three times as much water as did the pastures rated in low condition
(Rauzi, 1956).
On two of the three areas studied, analysis showed that the amount of standing vegetation
present contributed more to
water intake than did the mulch material. Hopkins (1954) work- ing in Kansas found that mulch affected the water-intake rates but was not a controlling factor.
Hanks and Anderson (1957)
found that destroying the sur- face mulch by burning substan- tially decreased water intake on native bluestem pastures in Kan- sas. In Glacier County standing vegetation and mulch material contributed about equally to the intake rates.
Frequently during the sum-
mer months, torrential rains of high intensity but of short dura- tion occur and result in exces- sive runoff and erosion. This is especially true on those range- lands not protected with a good cover of grass and mulch. Also, that portion of the precipitation that becomes runoff is lost, thereby reducing on-site produc- tiveness. It is therefore impor- tant that rangelands be man- aged so that they are able to
water from torrential rains to increase forage and reduce ero- sion.
Summary
Water-intake studies were
conducted with a mobile infil- trometer on rangelands at three locations in the northern plains. Two of the three areas (Willis- ton, North Dakota, and McCone County, Montana) are in the lo- to 14-inch-rainfall belt. The other area (Glacier County, Montana) is in the 15-to-19-inch- rainfall belt. Fenceline compari-
sons were made between pas-
tures rated in either a high or low range condition. Soil tex- ture for th sites was either silt loam or loam.
Ranges rated in high condition absorbed almost three times as much water in the form of simu- lated rain as the low-condition ranges during the fourth 15-min- ute period of the hour test. Ranges rated in high condition had more standing vegetation and mulch material present at the time of test than did those rated in low condition.
Regression analysis was used to compare variations in water intake with variations in forage and mulch yield. An over-all regression of the three areas in- dicated that the relationship be-
tween water-intake rates and
amount of forage yield and
mulch was highly significant, but only 41 percent of the vari- ation in water intake was ac- counted for. Individual regres- sions for each area were then computed and it was found that from 45 to 84 percent of the vari- ation in water intake was ac- counted for by mulch and forage yield in the individual areas.
184
RAUZI
Although significant relation-
ships between water-intake rates
and amount of forage yield and
mulch were established for all
areas, the individual regressions
for the different areas show a
closer degree of association
among the variables and there-
fore greater accuracy can be ob-
tained from their use.
LITERATURE CITED
DULEY, F. L. AND C. E. DOMINGO. 1949. Effect of grass on intake of water. Nebr. Agr. Exp. Sta. Res. Bul. 159: 1-15.
DYKSTERHUIS, E. J. AND E. M. SCHMUTZ. 1947. Natural mulches or “litter” of grasslands; with kinds and amounts on a southern prairie. Ecology 28:163-179.
HANKS, R. J. AND KLING L. ANDERSON. 1957. Pasture burning and mois- ture conservation. Jour. Soil and Water Cons. 12:228-229.
HOPKINS, HAROLD H. 1954. Effects of mulch upon certain factors of the
grassland environment. Jour.
Range Mangt. 7:225-258.
LASSEN, L., HOWARD W. LULL AND BERNARD FRANK. 1952. Some plant- soil water relations in watershed
management. U. S. Dept. Agr. Circ. 910: l-64.
OSBORN, BEN. 1952. Storing rainfall at the grass roots. Jour. Range Mangt. 5: 408-414.
RAUZI, FRANK. 1956. Water infiltra- tion studies in the Bighorn Na- tional Forest. Wyo. Agr. Exp. Sta. Mimeo. Circ. 62: 1-7.
RAUZI, FRANK AND A. W. ZINGG. 1956. Rainmaker helps prove a theory. Soil Conservation. 21: 228-229-240. YARNELL, DAVID L. 1935. Rainfall in- tensity-frequency data. U. S. Dept. Agr. Misc. Pub. 204: l-67.
The Nutrient Status of Four Mountain
Rangeland Soils in Western Nevada
and Eastern California1
RICHARD E. ECKERT AND A. T. BLEAK2
Range Conservationists, Crops Research Division, Agri- cultural Research Service, U. S. Department of Agri- culture, Reno, Nevada, and Ephraim, Utah, respectively
Artificial revegetation of de-
pleted grazing lands on the
eastern slope of the Sierra Ne-
vada Range has resulted in vary-
ing degrees of success. Fair to
good stands have been attained
at elevations of 6,000-7,000 feet.
At elevations of 8,000-10,000 feet
the use of selected species and
approved planting methods have
resulted in good seed germina-
tion and emergence; however,
seedlings lacked vigor and grew
slowly.
Three-year-old
plants
often appeared to be seedlings
and produced herbage of less
than 100 pounds per acre. The
purpose of the study reported
here was to investigate the nu-
trient status of the soil, one of
1
This study was begun by A. T. Bleak while stationed at Reno, Nevada.2 The authors wish to extend their appreciation to E. A. Naphen, of the Soil Conservation Service, for reviewing this manuscript and to Lou Langen, also of the Soil Con- servation Service, for collecting the Smith Valley soil.
the environmental factors which
may have been responsible for
the limited plant growth ob-
served.
Review of Literature
The various methods of deter-
mining the nutrient status of the
soil can be divided into two main
classes: chemical and biological.
The latter can be sub-divided
into two groups: those in which
certain microorganisms are used
as the test plants and those in
which higher plants serve as the
nutrient-extracting agent. (Van-
decaveye, 1948),
According to Vandecaveye
(1948)) some of the first pot-cul-
ture tests were conducted by
Boussingault in 1838. Also, ac-
cording to Vandecaveye (1948),
Mitscherlich, in 1930, placed this
type of investigation on a quan-
titative basis and studied the ef-
fect of a single factor on the
growth of plants. Jenny et al.
(1950) described the lettuce-pot
culture in which Romaine let-
tuce was the indicator plant and
the concept of relative yield was
used to compare treatment re-
sponse. Stephenson and Schu-
ster (1941) developed a pot-cul-
ture technique in which sun-
flower was used as the indicator
plant. The principle of this
method consists of vigorous ex-
traction of nutrients by massive
plant growth on a small quantity
of soil. Colwell (1943) used sun-
flower for determining boron-de-
f iciency
symptoms.
Billings
(1950) determined the nutrient
status of soil developed from
chemically altered rocks in wes-
tern Nevada. Indicator plants
were corn, sagebrush, and to-
bacco.
Vlamis et
al.(1954) presented
a greenhouse assay of the nutri-
ent status of brushland soils in
southern California. A modif ied
Mitscherlich pot-testing tech-
nique was used and lettuce was
the test plant. The authors re-
ported that in general, the green-
house evaluation of fertility cor-
related fairly well with field es-
timation of the natural vegeta-
tive cover. Mondrzak-Rosenberg
(1958)) using the method of
Jenny et
al.(1959), published
the results of pot-fertility trials
on Israel soils.
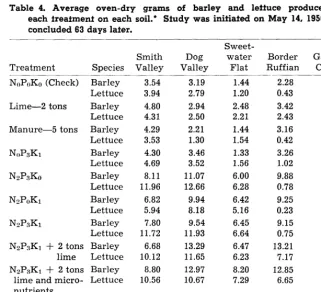
Table 1. Descripfion of study sites
- Annual
Precipi- Revege-
Eleva- tation tation
Site tion (inches) results
Smith Valley 4,750 7 5-6 tons of
hay per year
Dog Valley 6,300 15* Fair
MOUNTAIN RANGELAND SOILS 185
Sweetwater
Flat 7,200 12*
Border Ruffian 8,200 25*
Galena Creek 9,700 40”
Fair
Poor
Poor
*Estimated precipitation
fertility studies. Alfalfa and mil- let were the test plants. These workers concluded that for al- falfa and probably for a number of other plants, greenhouse fer- tility trials could be conducted in l- to S-gallon containers as ac- curately as in larger ones. Ter- man (1959) made a statistical
study of 141 greenhouse pot
teds. Corn, oats, wheat, red clover, millet, ryegrass, and su- dangrass were the test plants. Coefficients of variations were found to decrease with increase in yield. Three replications were found to be sufficient from the standpoint of accuracy. Statisti- cal relationships were similar whether a-gallon pots or No. 10 cans were used.
Methods and Materials Soil from each of four moun- tain sites was selected for study. Artificial revegetation had been attempted at each. In addition, one productive cultivated soil was included in the study as a basis for comparison. The five sites are described in Table 1.
Various chemical characteris- tics of the soils are given in Table 2. The pH of a saturated paste was obtained by a glass- electrode meter (method 21b of the U. S. Salinity Laboratory)
(1954). Electrical conductivity
Native vegetation (Reseedings in the timber
type
were in the brushybarren openings) or
Artemisia tridentata (cropped since 1950)
Pinus jejjreyi, Ceanothus vel- utinus, Arctostaphylos pat&a, Artemisia tridentata
Artemisia tridentata, Chryso- thamnus viscidijlorus, Prunus and ersonii
Pinus contorta, Abies con- color, Artemisia tridentata Chrysothamnus spp., Lupinus spp., Pinus al bicaulis, Pinus contorta
_
of a saturation extract was used to appraise the soluble-salt con- tent of the soils (methods 3a and 4b.) The organic-matter content of the soil was determined by the Walkley-Black method, total nitrogen by the Kjeldahl method,
cation-exchange capacity by the
ammonium acetate method, to-
tal-extractable calcium and po- tassium by the flame photometer method, and phosphorus by the sodium bicarbonate method, all as outlined by the Oregon State College Soil Testing Laboratory
(1954). Aluminum was evalu-
ated by the LaMotte method
(1952).
The pot fertility procedures used were adapted from those described by Jenny et al. (1950).
A sample of the surface 6 inches of soil was passed through a Y&inch mesh screen and 1600 grams of air-dry soil placed in 6-inch clay pots. These pots had been coated inside and outside with two layers of clear plastic. The ten treatments included in this experiment were replicated three times in a randomized- block design. The various treat- ment combinations are presented in Table 3.
Lime was added as hydroxide of lime; manure was processed
steer manure. Nitrogen was
added as ammonium nitrate,
P,O, as calcium dihydrogen phosphate, and K,O as potassium sulfate.
Lime, manure, and sulfur were mixed with dry soil. All other chemicals or mixture of chemi- cals were dissolved in water and the aqueous solution was mixed with the dry soil.
On May 14, 1956, five pre- soaked, sprouting Frontier bar- ley seeds were transplanted to one series of pots and one Ro- maine lettuce plant was trans- planted to a second series of pots. Pots were weighed daily and sufficient water added to bring the soil to approximate field capacity. Any excess water was caught and used in the fol- lowing irrigation of the respec- tive pots. All pots were sprayed with malathion every 5-7 days for mite and aphid control. Each