The Context for Australian SME Exits
Rodney Con Foo
Correspondence to: H. Rodney E. Con Foo Research Student
Centre for Strategic Economic Studies Victoria University, City Campus, Level 13
PO Box 14428 Melbourne City MC VICTORIA,
AUSTRALIA 8001 Tel: +61 (0) 417 388 288 Fax: +61 (0)3 9836 5297 Email: rodney_confoo@keatsbury.com
ABSTRACT
SMEs play a significant role in the Australian economy as they account for 95% of enterprises and 60-70% of jobs. The nature of SMEs are that there are many start-ups and almost as many failures each year. Whilst there have been significant studies on areas associated with business cessation, there has been very little research focus on business exits that do not include business cessation.
Of the 3,015,318 active businesses in operation on June 30, 2004 the vast majority (72.2%) were employing businesses i.e. owner only operated or legal entities established for non-trading purposes. The non-agriculture private sector consisted of 90.0% small business (1-19 employees), 9.4% of medium business (20-199 employees), and 0.6% large business (200+ employees).
1.
Introduction
This paper forms part of the background discussion to a study on successful small medium
enterprise (SME) exits in Australia. Its aim is to undertake an analysis of two prior studies on
business exits. The focus of this analysis is to determine if it is possible to reconcile their
results so to produce a common harvest rate for use in subsequent sections of this study.
SMEs play a significant role in the Australian economy; they account for 95% of enterprises
and 60-70% of jobs (OECD 2000). The nature of SME operation in Australia is that there are
many start-ups and almost as many failures each year. Significant studies (Peacock, 2000;
Beddall Inquiry, 1990; Lowe et al., 1990; Price, 1984; Williams, 1987) have been completed
on areas associated with business cessation (liquidation, insolvency etc.) because of the
consequences associated with loss of jobs, social impacts, legal and regulatory issues, and
possible flow on effects to other businesses and organisations. In comparison, very little
research focus has been placed on business exits that do not include business cessation.
2.
Counts on Australian Businesses
A start point for any discussion on the exits begins with a counts on Australian businesses.
Counts on the population of Australian businesses can be obtained from a range of qualified
sources. Three principal sources are the Australian Bureau of Statistics (ABS), the Australian
Tax Office (ATO), and the Australian Securities and Investment Commission (ASIC) [ABS
2005A]. Irrespective of the source, making accurate counts is a complex task that is very
count. As a result, counts on businesses can vary significantly; at June 30, 2004 this ranged
from a high of 5.2 million1 to a low of 1.4 million2.
A good starting point for any defined count is the Australian Business Register (ABR) which
is a whole-of-government register of Australian Business Numbers (ABN) maintained by the
ATO. All businesses with annual turnovers in excess of $50,000 and not-for-profit
organisations with turnover in excess of $100,000, are required to register for an ABN and
remit Goods and Services Taxes (GST) to the ATO (ABS, 2005A). In some instances,
separate businesses with related ownership may operate under a single ABN and in other
cases; multiple commercial activities may be registered as separate ABNs. For these
situations, the ABS maintains a ‘population’ (ABSMP – ABS Managed Population) for
businesses where the ABN unit count is not suitable. This population comprises of typically
large, complex, and diverse businesses. A correlation of the ATO ‘population’ (ATOMP –
ATO Managed Population) i.e. GST paying businesses, and the ABSMP, provides a
foundation for a valid count on active Australian businesses.
The June 30, 2004 Australian Bureau of Statistics count of Australian businesses reported that
there were 3,015,318 active private and public businesses (ABS, 2005A and ABS, 2005B).
This count excluded businesses without ABNs, general government, the central bank,
non-profit institutions serving households, charitable institutions, social and sporting clubs, trade
unions and other associations, unincorporated entities, diplomatic or trade missions, and
foreign governments. An exclusion of businesses without ABNs, i.e. with turnovers
<$50,000, is numerically significant; however, for the purposes of this analysis, where counts
of employing businesses are generally excluded, this will also eliminate almost all
non-employing businesses. Accessing readily available and reliable data on activities of very
1
Cumulative count of records on the Australian Business Register (ABS, 2005A).
2
Actual Priv Sect Non-Agr Overall
Large 4,646 0.6% 0.2% Medium 71,791 9.4% 2.4%
Small 686,400 90.0% 22.8% Figure 1 Source Adapted: ABS 2005A & ABS 2005B
All Businesses
Public & Private 3,015,318 Non Employing 2,178,240 Employing 837,078 Non Agriculture Private Sector 762,837 Public Sector 130 Agriculture, Forestry & Fishing
74,111 Medium Business 71,791 Small Business 686,400 Large Business 4,646
small non-employing businesses and
family-owned agriculture businesses is
problematical. The ABS study of Business
Exits Australia (1997)3 [Business Exits]
bypasses this issue by analysing only
employing, agriculture, and
non-government enterprises. A subsequent study
(ABS, 2005C) study Experimental
Estimates, Entries and Exits of Business
Entities (Experimental Estimates) also
eliminates non-ABN enterprises coupled
with taxation activity / inactivity in its count of businesses.
This analysis on business exits attempts to reconcile these studies in order to provide a
definitive count on SME exits; in particular, businesses that go to harvest. The Business Exits
(ABS, 1997) study provides the most constraining criteria and therefore provides the
framework to reconcile other business counts.
Of the 3,015,318 active businesses in operation on June 30 2004 (ABS, 2005B) the vast
majority (72.2%) were non-employing businesses i.e. owner only operated or legal entities
(trusts, corporate shells, etc.) established for non-trading and structural purposes. Of the
837,078 employing enterprises, 130 were public enterprises i.e. government owned, and
74,111 were involved in agriculture, forestry and fishing. The non-agriculture private sector
consisted of 90.0% small business (1-19 employees), 9.4% of medium business (20-199
employees), and 0.6% large business (200+ employees) [ABS, 2005B].
3
94-95 95-96 01-02 02-03 03-04
Business Exits 7.2% 8.0%
Experimental Estimates 11.4% 4.3% 4.1%
Figure 2 Source Adapted: ABS, 1997 & ABS, 2005C
3.
Business Exits
There is very limited data available on business exits in Australia (ABS, 1997). The most
common and available
information from sources such as
the Department of Attorney
General and ASIC, is usually
associated with measures on business failure and bankruptcy. Even this data provides only
partial insight into business failure because it often does not cover events such as voluntary
closures and forced sales which do not result in bankruptcy proceedings (ABS, 1997 and
Bickerdyke et al., 2000). In order to identify rates of business exits due to changes in
ownership / mergers (often referred to as ‘harvest’) it is necessary to remove data associated
with business failure (forced or voluntary). To date, the most in-depth analyses of business
exits have been Business Exits Australia (ABS, 1997) and Experimental Estimates, Entries
and Exits of Business Entities (ABS, 2005C).
The findings from these studies ostensibly reveal similar exit rates; Business Exits (ABS,
1997) reports an average exit rate of 7.6% and Experimental Estimates (ABS, 2005C) reports
an average exit of 6.6%. If the abnormally high 2001-20024 rate is removed from
Experimental Estimates (ABS, 2005C) the ‘adjusted’ rate becomes 4.2% and is more attune
with a normal year’s activity. Even allowing for survey and sampling errors there is now a
sizeable disparity in exit rates. Other than the obvious timing differences, these results are
drawn from studies that varied considerably in their methodologies, their sources, and their
scope. Is it possible to reconcile these findings?
4
3.1 Experimental Estimates
Experimental Estimates (ABS, 2005C) studied entries and exits of businesses based on the
ATO maintained Australian Business Register (ABR). The key unit of data in the ABR is the
ABN (Australian Business Number) which is discrete and unique to each business entity. All
businesses with turnover above the GST threshold5 are required to register for an ABN by the
ATO. Businesses with turnovers below this threshold may voluntarily register for an ABN.
All businesses without ABNs i.e. non-trading and not registered, have been excluded from
this study. Utilising the counts of ABNs with records on tax activity provides the key basis
for determining business entries and exits.
The final year of the Experimental Estimates (ABS, 2005C) study coincides with another
ABS study, ABS Business Register- Counts of Australian Businesses (ABS, 2005B). By
combining counts from both studies for the year ending June 30, 2004, it is possible to attain a
better degree of alignment between the findings of Experimental Estimates (ABS, 2005C)
with Business Exits (ABS, 1997).
Experimental Estimates (ABS, 2005C) start point is a stated population of 3,388,166 at June
30, 2004 (ABS, 2005C) which aligns with the ABS reported count (3,015,318 discrete
entities) of Australian private and public businesses (ABS, 2005B). This 11% differential can
be mostly attributed to the different methodologies used in the count, the difference being that
Experimental Estimates does not account for complex and diverse businesses utilising
multiple ABNs6.
5
GST threshold for not-for-profit entities is $100K and $50K for all others.
6
Category Overall Count Count Exit
June 30, 2004 Population(A) 3,388,166 128,139
Less Agric., forestry & fishing (A) (271,473) (12,969)
Less government enterprises (B) (130) -
Less non employing enterp. (A) (2,103,411) (92,484)
Adjusted Totals 1,013,152 22,686
Adjusted Rate 2.24%
Figure 3 Source Adapted: ABS 2005A & ABS 2005B
(A) Source Experimental Estimates, Entries and Exits of Business Entities (ABS, 2005B).
(B) Source ABR – Counts of Businesses (ABS, 2005B). It is assumed that the exit rate for Government enterprises is nil. Even if all Government enterprises were included this would only adjust the overall exit rate by 0.01%.
Combining data from these two
‘aligned’ sources results in adjustments
for agriculture, forestry and fishing; for
government enterprises; and
non-employing enterprises. The net result
is an adjusted exit rate of 2.24% for the
non-agriculture private sector. This
represents a widening of differences
but if the overall population is then
adjusted for multiple ABNs (reduce the starting point by 372,848 [difference between
3,388,166 and 3,015,318]) this would provide an adjusted exit rate of 3.54%. By definition,
exit rates involve two types of exits; business harvest (changes in ownership) and business
failure or cessation. Since the purpose of this analysis is to identify the number of businesses
which were harvested it is necessary to remove all data from this exit rate associated with
business failure.
A 1996 longitudinal study on small business failures (Watson and Everet) identified two types
of failures; insolvent failures which were typically liquidations and bankruptcies, and solvent
failures which were voluntary closures where enterprises were solvent but owners were
unwilling to make further losses or unwilling to continue because of non-financial business
reasons e.g. commitment, stress etc. According to Watson and Everet (1996) for every three
registered failures there is another one closure that can be classified as a solvent failure
(28%). For the period July 1, 2003 till June 30, 2004, the Australian Securities and
Investment Commission reported 11,008 insolvency appointments, i.e. companies that
voluntarily appoint a liquidator or have a court appointed liquidator (ASIC, 2006A & ASIC
estimate on business failure (insolvent and solvent) of 15,289 enterprises for the year ending
June 30, 2004. If we now deduct this from the adjusted overall exit count of 22,686, this
identifies that 7,397 enterprises were harvested; a rate of 1.15% of private sector
non-agriculture businesses. The ASIC data on insolvency (ASIC, 2006A and ASIC, 2006B) may
contain overlapping counts for non-employing enterprises and enterprises from agriculture
and forestry. Therefore, within the bounds of non-sampling error, this rate of 1.15% should
be considered a forecast at the lower end of harvest rates as it includes counts for agriculture
and forestry which had previously been excluded.
3.2 Business Exits
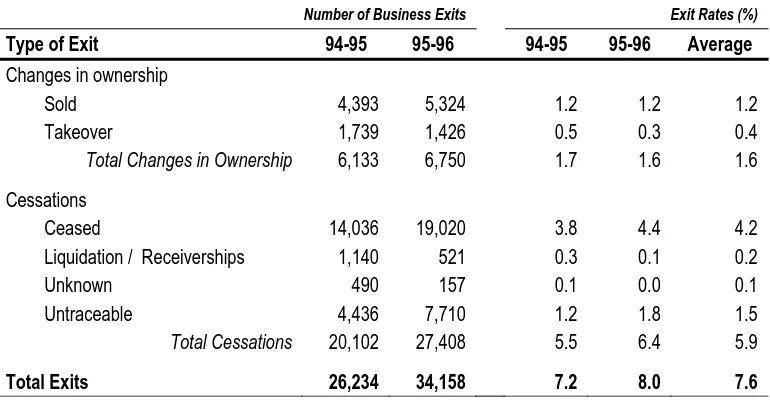
Business Exits (ABS, 1997) examined the rates at which firms exit the business population by
studying responses to surveys on Fixed Capital Expenditure and Stocks and Sales for the
periods 1994-95 and 1995-96. The scope of the study was non-government employing
businesses but excluded businesses operating in agriculture, forestry and fishing. Exits were
categorised into two groups: changes in ownership and business cessation. Changes in
ownership included all businesses that were sold, taken over or merged; and cessations were
businesses that ceased or closed, were liquidated or in receivership, or businesses that were
untraceable, or the reasons for their exit were unknown. Up to 20% of the sample population
Number of Business Exits Exit Rates (%)
Type of Exit 94-95 95-96 94-95 95-96 Average
Changes in ownership
Sold 4,393 5,324 1.2 1.2 1.2
Takeover 1,739 1,426 0.5 0.3 0.4
Total Changes in Ownership 6,133 6,750 1.7 1.6 1.6
Cessations
Ceased 14,036 19,020 3.8 4.4 4.2
Liquidation / Receiverships 1,140 521 0.3 0.1 0.2
Unknown 490 157 0.1 0.0 0.1
Untraceable 4,436 7,710 1.2 1.8 1.5
Total Cessations 20,102 27,408 5.5 6.4 5.9
Total Exits 26,234 34,158 7.2 8.0 7.6
Figure 4 Source Adapted: ABS, 1997
From a total sample of 60,392 surveys over the two years, the study estimated that the overall
exit rate was 7.6% of which 5.9% involved business cessations and 1.6% involved changes in
ownership (ABS, 1997). Over one in five exits (20.1%) were not traceable by those
conducting the study and subsequently these were all categorised as business cessations rather
than proportioned over the two groups. As acknowledged by the authors, this slightly
overstates cessations and equally, understates changes in ownership. If they were
proportioned according to the pre-existing distribution this would produce ‘adjusted’ rates of
5.6% and 2.0% for business cessations and changes in ownership respectively.
One of the key findings of this study was the higher exit rate (7.7%) by small business (1-19
employees) than medium and large businesses (20+ employees) which had an overall exit rate
of only 5.4% (ABS, 1997). Medium and large businesses tended to fail at a rate almost half
(49.2%) that of small business (3.0% cessation rate versus 6.1% for small business) and if an
exit were to occur there was a better than 45% chance of that being a business harvest rather
business (20.8%). Medium and large businesses also had a 56.3% better harvest rate than
their small business counterparts (2.5% versus 1.6%).
Number of Business Exits Exit Rates (%)
Age of Business In Owner Change Cessation Change In Owner Cessation Total
Less than 2 years old 2,510 9,184 2.1 7.4 9.5
2 to less than 5 years old 1,908 6,999 1.5 5.7 7.2
5 to less than 10 years old 1,390 4,899 1.6 5.6 7.2
10 or more years old 633 2,673 0.9 4.0 4.9
Total 6,441 23,755 1.6 5.9 7.6
Figure 5 Source Adapted: ABS, 1997
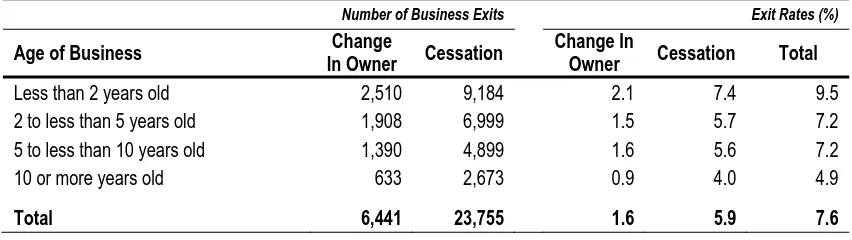
Overall the rate of exit for younger businesses was higher than the overall average. This was
applicable for both business cessation (7.4% versus 5.9%) and changes in ownership (2.1%
versus 1.6%). One of the explanations for this with regard to business harvest is that as
businesses grow, some owners are not able to fund their growth and are subsequently forced
to divest (Legge and Hindle, 2004; Gaujers et al., 1999; Stevenson et al.,1994). Another
explanation is that after the initial ‘excitement’ of start-up, some owners discover that they are
less interested in operating their businesses than first envisaged because of issues like loss of
commitment, lower than forecast profitability, increased stress, family related issues, and
drains on personal finance (Schaper, and Volery, 2004; Legge and Hindle, 2004; Flamholtz
1990; Gaujers et al., 1999). Bickerdyke et al. (2000, p.19)7 attribute this to smaller businesses
being more owner dependent and when the owner-operator dies, becomes sick, or seeks a
lifestyle change, “business cessation is the likely outcome”. Larger businesses are more likely
to be owner diversified and therefore less dependent upon a single individual. More mature
businesses are more likely to have gone through these phases and as a result, businesses
which have been in operation from two to ten years, tend to have exit rates more in line with
7
Bickerdyke, Lattimore and Madge (2000) used a combination of the ABS (1997) study on Business Exits Australia combined with data on business-related bankruptcies published by the Inspector-General
the overall averages. The ABS (1997) study found that more than 90% of exits due to
changes in ownership can be attributed to businesses less than 10 years old. Bickerdyke et al.
(2000) examined whether exit rates were a function of size or age with the general
appreciation that younger businesses tended to be smaller and mature businesses larger. They
concluded that exit rates were correlated to size rather age. The explanation for the lower exit
rates of larger business was that larger businesses had lower transactional costs than their
smaller counterparts and this enabled them to reorganise (downsize, restructure, etc.) rather
than exit (Bickerdyke et al., 2000, p.21).
Once they exceed ten years however, they tended to have a lower than average exit rate. An
explanation for this is that mature businesses can become ‘cash cows’ with a regular flow of
profits to their owners so they are reluctant to sell out. The presence of professional managers
in mature larger businesses also allow owner operators to pursue a chosen lifestyle without
disposing of their business. To some SME business owners the business is not just a source
of funds but it may also represent a desired lifestyle. Being one’s own boss and being able to
choose when and how hard they work is attractive to some owners and this is achieved more
often in mature businesses. Once owners have established this lifestyle they are often
Rate
Rptd Rate Adj Error Lower Range Range Upper
Business Exits 1.6% 2.0% 8.4% 1.3% 2.3%
Experimental Estimates 1.15% 5.0% 1.0% 1.3%
Figure 6 Source Adapted: ABS, 1997 & ABS, 2005B
4.
Discussion and Conclusions
The combination of Business
Exits Australia (ABS, 1997)
and Experimental Estimates,
Entries and Exits of Business Entities (ABS, 2005B) provides a foundation for understanding
business exits related to harvest (changes in ownership). Taking into account its reported
standard error, Business Exits reports a harvest rate range, with a 95%8 surety, of 1.3% to
1.9%. If all ‘untraceable’ responses are not placed into the ‘cessations’ category and are
ignored or dispersed proportionally, the harvest range is adjusted upwards to 1.7% to 2.3%9.
Whilst Experimental Estimates acknowledges the difficulty in quantifying ‘non-sampling
error’ (p.36), for the purposes of this analysis, a 5%10 standard error is adopted. Applying this
error and the same logic as for Business Exits to the calculated Experimental Estimates
harvest rate11 of 1.15%, provides a harvest range of 1.0% to 1.3%. Overlaying the range of
outputs from both studies provides a spread from 1.0% to 2.3% with an overlap at 1.3%.
Whilst it may be more accurate to provide an operating range to which businesses are
harvested, the purpose of this analysis was to determine if it was possible to derive a single
rate which was supported by the results Business Exits and Experimental Estimates studies
and be able to used as a benchmark for ongoing analysis. It is concluded that a benchmark
harvest rate of 1.3% fulfils this criteria.
Based on a June 30, 2004 population of 762,837 employing non-agricultural private
enterprises this would forecast that approximately 9,917 owners sold their businesses in that
financial year. This compares favourably with the 1995-1996 Business Exits count of 6,750
8
Standard error stated as 8.4% for sample (ABS, 1997, p.3).
9
Apply the 8.4% standard error to the adjusted exit rate of 2.0%.
10
As used in ABS publication Business Operations and Industry Performance Australia (2002) p.36.
11
businesses allowing for a 3.5% annual growth in business counts for the period 1996 to
200412. Utilising a similar methodology to the Bickerdyke et al. (2000) study but adjusting
for CPI13, the annual value added for these exits is estimated to be $9.26 billion or an average
of $933,356 per business.
The definition of an exit in both Business Exits and Experimental Estimates are clearly
defined but neither study takes into account three distinct scenarios which would impact on
any counts on business harvest and business cessation. The first scenario is where there is a
change in business ownership due to imminent business failure. In this case the change in
ownership is counted as a harvest but without the benefits of timing, this should be considered
as a business cessation. The overall result would increase the count and hence the rate, for
changes in ownership and conversely, reduce it for cessation.
The second scenario is that in many cases where there is a change in ownership, the old
corporate entity will be voluntarily closed / liquidated. This is undertaken to reduce the risk
of prior operation (litigation, warranties etc.) and can be executed by either the old or new
owner depending on whether the shares in the entity are sold as part of the change in
ownership or whether just the business assets are sold. This deregistering of the associated
ABN attached to the entity’s records as a business cessation but in this case, it is actually
associated with a business harvest. Removing non-employing ABNs from the count may
account for some potential errors in cessations (in situations where deregistration occurs
across financial years) but misses the change in ownership. The overall effect is to again
12
In the period 1983-84 to 2000-01 the ABS reported that small business numbers had an average annual increase of 3.5% and medium / large businesses grew at annual rate of 3.3% (ABS 2001)
13
CPI (Consumer Price Index). Bickerdyke et al. (2000) used data from A Portrait of Australian Business
increase the count and hence the rate, for changes in ownership and conversely, reduce it for
cessation.
Business cessation is associated with business failure. In the third scenario some owners
choose to close the business down by voluntarily liquidating it because they cannot sell the
business or choose not to sell it. This is often the case in smaller businesses without large
numbers of employees and where the business is very much owner / operator dependent. In
these cases it could be argued that by voluntarily closing a business and freeing up capital and
assets which are required to operate the business, the owner is actually undertaking a form of
business harvest. Again, this error is diminished by removing non-employing ABNs from the
count but the net effect is an increase in the change of ownership count.
The overall impact of these three outcomes is anticipated to result in a significant increase in
the harvest rate but this would only be confirmed by a further empirical based study with
these scenarios predefined as described above. Therefore, the stated harvest rate of 1.3% is
considered to be conservative.
5.
References
ABS [Australian Bureau of Statistics] (1997). Business Exits Australia 1994-95 and 1995-96. Occasional Paper, Cat no. 8144.0, ABS, Canberra.
ABS [Australian Bureau of Statistics] (2001). Small Business in Australia. Information Paper, Cat no. 1321.0, ABS, Canberra.
ABS [Australian Bureau of Statistics] (2005A). A Statistical View of Counts of Business in Australia. Information Paper, Cat no. 8162.0, ABS, Canberra.
ABS [Australian Bureau of Statistics] (2005B). Business Register, Counts of Business – Summary Tables. Cat no. 8161.0.55.001, ABS, Canberra.
ABS [Australian Bureau of Statistics] (2005C). Experimental Estimates, Entries and Exits of Business Entities. Cat no. 8160.0.55.001, ABS, Canberra.
ASIC [Australian Securities and Investment Commission] (2006A). ‘2003 Insolvency Statistics’. Viewed 12 June 2006,
ASIC [Australian Securities and Investment Commission] (2006B). ‘2004 Insolvency Statistics’. Viewed 12 June 2006,
<http:/www.asic.gov.au/asic/ASIC_PUB.NSF/byheadline/>
Beddall, D. (1990), Challenges, problems and opportunities, Report of the House of Representatives Standing Committee on Industry, Science and Technology on small business in Australia. Australian Government Printing Service.
Bickerdyke, I., Lattimore, R. and Madge, A. (2000). Business Failure and Change: An Australian Perspective. Productivity Commission, AusInfo.
Flamholtz, E. G. (1990). Growing Pains – How to make the transition from an
entrepreneurship to a professionally managed firm. Josset-Bass Publishers, San Fransisco.
Gaujers, R., Harper, J. and Browne, J. (1999). Guide to Managing a Successful Small Business in Australia. McGraw-Hill Book Company Australia Pty Limited.
IC [Industry Commission] and DIST [Department of Industry, Science and Tourism] (1997). A Portrait of Australian Business. AGPS, Canberra.
Legge, J. and Hindle, K. (2004). Entrepreneurship – Context, vision and planning. Palgrave Macmillan USA.
Lowe, J. McKenna, J. and Tibbits, G. (1990). ‘Small Firm Growth and Failure: Public Policy Issues and Practical Problems’, Conference Series no. 17. pp. 175-190, University of Newcastle, Newcastle.
OECD (2000). OECD Small and Medium Enterprise Outlook – 2000 Edition. Organisation for Economic Co-Operation and Development.
Peacock, R. (2000). Failure and Assistance of Small Firms.
Price, R. (1984). Small Business Management for Small Business Owners / Managers. Wordsworth International, Melbourne.
Schaper, M. and Volery, T. (2004). Entrepreneurship and Small Business – A Pacific Rim Perspective. John Wiley & Sons Australia, Ltd, Milton, Australia.
Stevenson, H. H., Roberts, M.J. and Grousbeck, H. I. (1994). New Business Ventures and the Entrepreneur. Irwin, Sydney Australia.
Watson, J. and Everett, J. (1996). ‘Do small business have high failure rates?’, Journal of Small Business Management. vol. 34, no. 4, pp. 45-62.