A Decision Support System for Predicting
Student Performance
Lalit Dole1, Jayant Rajurkar2
Assistant Professor, Dept. of CSE, G.H.Raisoni College of Engineering, Nagpur (M.S), India1
.
Dept. of CSE, G.H.Raisoni College of Engineering, Nagpur (M.S), India2
.
ABSTRACT: In recent years data mining has been successfully implemented in the business world. Evaluating students' academic success is becoming increasingly challenging, its use is intended for identification and extraction of new and potentially valuable knowledge from the data. Predicting educational outcome is a practical alternative heterogeneous environment. Performance prediction models can be built by applying data mining techniques to enrolment data. In this paper we present an Naive Bayes algorithm (NB) approach to predict graduating cumulative Grade Point Average based on applicant data collected from the surveys conducted during the summer semester at the University of Tuzla, the Faculty of Economics, academic year 2010-2011, among first year students and the data taken during the enrolment. The Naive Bayes algorithm is used to discover the most suited way to predict student's success.
KEYWORDS: Data Mining, Classification, Prediction, Naive Bayes algorithm (NB), Student Evaluation.
I. INTRODUCTION
Many leading higher education and Technical Education institutions aim is to contribute to the improvement of quality of higher education, the success of creation of human capital is the subject of a continuous analysis[1]. Therefore, the prediction of students' success is essential for higher education and Technical education institutions, because the quality of teaching process is the ability to meet students' needs. In this sense important data and information are gathered on a regular basis, and they are considered at the appropriate authorities, and standards in order to maintain the quality are set. All participants in the educational process could benefit by applying data mining on the data from the higher education system decibel in figure1. Computational data process from different Perspectives represents from data mining with the goal of extracting implicit and interesting samples , trends and information from the data, it can greatly help every participant in the educational process in order to improve the understanding of the teaching process, and it centres on discovering, detecting and explaining educational phenomenon’s [1].
.
Figure 1. The cycle of applying data mining in educational systems.
In this paper we present an approach using Bayesian networks to predict graduating cumulative Grade Point Average based on applicant data collected from the surveys conducted during the summer semester at the University of Tuzla, the Faculty of Economics, academic year 2010-2011, among first year students and the data taken during the enrolment. Bayesian prediction model can provide valuable information to departmental faculty members in making decisions. They may be more comfortable with the predictive results if the system can show them the past student most similar to the applicant being considered. In this paper different techniques of data mining suitable for classification have been compared: Bayesian classifier, neural networks and decision trees. Neural networks have in many areas shown success in solving problems of prediction, approximation, function, classification and pattern recognition. Their accuracy was compared with decision trees and with the Bayesian classifier. The results indicate that the Naïve Bayes classifier outperforms in prediction decision tree and neural network methods. It also indicated that a good classifier model has to be both accurate and comprehensible for professors.
II. DATADESCRIPTION
The data for the model were collected through a questionnaire survey conducted during the summer semester at the Faculty of Economics in Tuzla, academic year 2010-2011, among the first year students. After eliminating incomplete data, the sample comprised 257 students who were at the time of researches present at the practice classes. The model of students' success was created, where success as the output variable is measured with the success in the course ''Business Informatics’’ [1].
Sr. Variable Coding Sr. Variable Coding
1. Gender
(S)
A – male B – female
2. Family
(BCD)
Numeric value
3. Distance
(UAS)
Numeric value
4. High
School (VSS)
A –Grammar School
B – High school for
economics C – Rest
5. GPA
(PO)
Numeric value
6. Entrance
exam (URK)
Numeric value
7. Scholars
hips (SS)
A – Not B – Sometimes C – Yes
8. Time
(VRI)
9. Material s (MAT)
A – book,
B – the notes of other students, C – notebook from the lectures, D – notes edited or made by student E – all that is available to student
10. the
Internet (INT)
A – Yes B – No
11. Grade
importa nce (VO)
A – Not important at all, B – not important C – Somewhat important, D – Important,
E – Very important 2000 KM
E – over 2000 KM
12. Earnings
(MPD)
A – less than 500 KM B – from 500 to 1000 KM C – from 1000 to 1500 KM D – from 1500 to
Table1. Student related variables
As input to the model 12 variables are used, whose names and coding is shown in Table1. Distribution of the final students' grades in the course ''Business Informatics'' is shown in Figure 2. It is evident that the prediction error rate will be much higher in the first case due to different distribution of grades through classes; hence the advantage is given to the second case of this study.
III.DATAMININGAPPROACH
Data mining is a computational method of processing data which is successfully applied in many areas that aim to obtain useful knowledge from the data [9]. The goal of the analysis is the categorization of data by class, then that is the new information on classes to which data belongs. In order to do this, algorithms are divided into two basic groups:
Unsupervised algorithms and Supervised algorithms.
The mining is ''unsupervised'' or ''undirected'', when the output conditions are not explicitly represented in the data set: the task of unsupervised algorithm is to discover automatically inherent patterns in the data without the prior information about which class the data could belong, and it does not involve any supervision [11].
The most common methods of classifications are: decision trees, induction rules or classification rules, probabilistic or Bayesian networks, neural networks and hybrid procedures.
IV.NAIVEBAYESALGORITHM
A Bayesian network [8] is a graphical representation of a probability distribution. It is a directed acyclic graph in which nodes represent random variables and links represent probabilistic influences between the variables. Probabilistic dependence and independence are expressed by the presence or lack of paths between nodes in the graph[2]. The fact that probabilistic dependence is encoded in the network topology in this way permits probability distributions over large numbers of random variables to be compactly represented and permits calculations to be performed efficiently. Due to the inherent uncertainty of the performance prediction problem, we chose to use Bayesian networks for the modeling task. Using a probabilistic model has the advantage that it can later become a component of a higher level optimization model.
Naive Bayes algorithm (NB) is a simple method for classification based on the theory of probability, i.e. the Bayesian theorem [10]. It is called naïve because it simplifies problems relying on two important assumptions: it assumes that the prognostic attributes are conditionally independent with familiar classification, and it supposes that there are no hidden attributes. that could affect the process of prediction. This classifier represents the promising approach to the probabilistic discovery of knowledge, and it provides a very efficient algorithm for data classification.
V. EXPERIMENTAL RESULTS
We have performed the experiments on WEKA software package ,that was developed at the University of Waikato in New Zealand. This package has been implemented in the software language Java and today stands out as probably the most competent and comprehensive package with algorithms of machinery learning in academic and nonprofit world (Machine Learning Group at University of Waikato, 2011).
To get a better insight into the importance of the input variables, it is customary to analyze the impact of input variables during students' prediction success. The impact of certain input variable of the model on the output variable has been analyzed. Tests were conducted using four tests for the assessment of input variables: Chi-square test, One R-test, Info Gain test and Gain Ratio test. The results of each test were monitored using the following metrics: Attribute (name of the attribute), Merit (measure of goodness), Merit dev (deviation, i.e. measure of goodness deviation), Rank (average position occupied by attribute), Rank and dev (deviation, deviation takes attribute's position). The results obtained with these values are shown in Table 4.
ATRIBUTE Chi-
Squared
One R Info
Gain
Gain Ratio
AVG Rang
PO
1.3
1
1.3
1
1.15
URK
1.7
8
1.7
2
3.35
MAT
4.7
6
4.7
4.3
4.93
VRI
3.7
10.3
3.3
4
5.33
SS
7.7
5
7.7
6
6.6
VO
5.7
10.3
5.3
6
6.83
MPD
5.7
9.3
5.7
6.7
6.85
INT
7
7
7.3
6.7
7
VSS
8.7
4
9
9
7.68
S
9
5.7
9
9.3
8.25
UAS
11
5
11
11
9.5
BCD
12
6.3
12
12
10.58
In this aggregate table "Merit" columns are not applicable, because the algorithms use mutually incompatible metrics. The aim of this analysis is to determine the importance of each attribute individually. Table 4. shows that attribute PO (GPA) impacts output the most, and that it showed the best performances in all of the four tests. Then these attributes follow: URK (entrance exam), MAT (study material), VRI (average weekly hours devoted to studying). The following attributes had the smallest output impact: BCD (number of household members), UAS (distance of residence from the faculty) and S (sex).
We have carried out some experiments in order to evaluate the performance and usefulness of NB classification algorithms for predicting students’ success. The results of the experiments are summarized in Table 5, 6, 7 and 8. The performances of the NB models are evaluated based on the three criteria: the prediction accuracy, learning time and error rate, which are illustrated in Figures 4, 5, and 6.
From the results, Naïve Bayes has better prediction. NB classifiers used for experiment, the accuracy rate of NB
algorithm is the Highest.The Naïve Bayes and decision tree classifier learn more rapidly in the time to build a model
for the given dataset.
The performance of the learning techniques is highly dependent on the nature of the training data. Confusion matrices are very useful for evaluating classifiers. The columns represent the predictions, and the rows represent the actual class. To evaluate the robustness of classifier, the usual methodology is to perform cross validation on the classifier. In general, cross validation has been proved to be statistically good enough in evaluating the performance of the classifier. Good results correspond to large numbers down the main diagonal and small, ideally zero, off-diagonal elements.
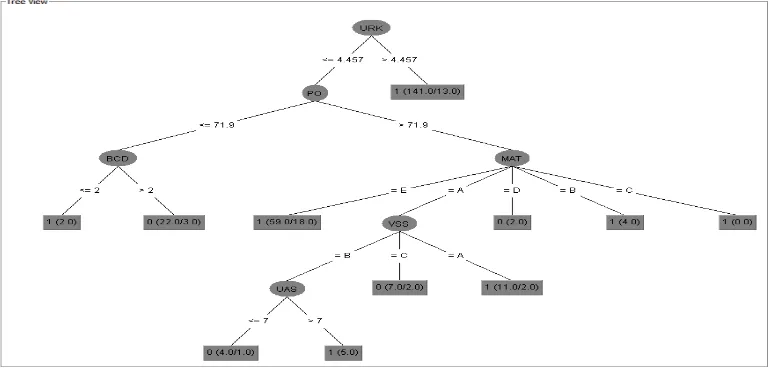
Figure 2. Obtained decision tree model.
The model (Figure 2) is easy to understood. This model can give faculty interesting information about student and provides guidance to teacher to choose a suitable track, by analyzing experiences of students with similar academic achievements.
VI.CONCLUSION AND FUTURE WORK
In this paper, we have present supervised data mining algorithms , Naive Bayes (NB) algorithm applied on the preoperative assessment data to predict success in a course (either passed or failed) and the performance of the learning methods were evaluated based on their predictive accuracy, ease of learning and user friendly characteristics.
The results indicate that the Naïve Bayes classifier outperforms in prediction decision tree, indicated that a good classifier model has to be both accurate and comprehensible for professors. This study was based on traditional classroom environments, since the data mining techniques were applied after the data was collected. It can be concluded that this methodology can be used to help students and teachers to improve student’s performance; reduce failing ratio by taking appropriate steps at right time to improve the quality of learning. It is important to answers how to obtain that predicting models are user friendly for professors or non-expert users and how to integrate data collection system of university and data mining tool.
REFERENCES.
1. Edin Osmanbegović,Mirza Suljić,”DATA MINING APPROACH FOR PREDICTING STUDENT PERFORMANCE”,Economic Review –Journal of Economics and Business, Vol. X, Issue 1, May 2012.
2. Nguyen Thi Ngoc Hien and Peter Haddawy,” A Decision Support System for Evaluating International Student Applications”, 37th ASEE/IEEE
Frontiers in Education Conference,2007.
3. Hadkkinen I., “Do University entrance exams predict academic achievement?”, Working Paper Series, Department of Economics, Uppsala University,
2004.
4. Golding P., Donaldson O., “Predicting academic performance”, Proc. 36th ASEE/IEEE Frontiers in Education Conference, 2006, 21-26.
5. Chowdhury A. A., “Predicting success of a beginning computer course using logistic regression”, ACM conference on ComputerScience, 1987, p449.
6. Dekhytar A., Goldsmith J., “The Bayesian advisor project”, online at http://www.cs.engr.uky.edu/~goldsmit/papers/#BAP.
7. Bekele R., Menzel W., “A Bayesian approach to predict performance of a student (BAPPS): A Case with Ethiopian Students”, Proc. IASTED International Conference on Artificial Intelligence and Applications, 2005.
8. Jensen F., “Bayesian Networks and Decision Graphs”, Springer- Verlag, 2002.
9. Klosgen, W. & Zytkow, “Handbook of data mining and knowledge discovery, Oxford University Press”, New York ,2002.
10. Witten, I.H. & Frank E. “Data Mining – Practical Machine Learning Tools and Techniques, Second edition”, MorganKaufmann, San Francisco,2000.
11. Cios, K.J., Pedrycz W., Swiniarski, R.W. & Kurgan, L.A.,”Data Mining: A Knowledge Discovery Approach”, Springer, New York,2007.
12. Kumar S. A. & Vijayalakshmi M. N.,”Efficiency of Decision Trees in Predicting Student's Academic Performance”, First International Conference on Computer Science, Engineering and Applications, CS and IT 02, Dubai, pp. 335-343, 2011.