© 2016, IJCSMC All Rights Reserved 439 Available Online atwww.ijcsmc.com
International Journal of Computer Science and Mobile Computing
A Monthly Journal of Computer Science and Information Technology
ISSN 2320–088X
IMPACT FACTOR: 5.258
IJCSMC, Vol. 5, Issue. 5, May 2016, pg.439 – 447
Translation of Entity Relational
Model to Dimensional Model
Savita Sehgal, Kamal Kumar Ranga
M.Tech, Assistant Professor
Computer Science Department, Ganga Institute of Technology and Management, Kablana, Jhajjar, Haryana Maharashi Dayanand University, Rohtak, Haryana
sehgal.savita@gmail.com
Abstract— Maturity of Star model for data warehouse (DW) requires sufficient amount of time, knowledge, proficiency and enough familiarity of data warehouse designing. As an substitute to data warehouse designing steps, transformation techniques are used. These techniques transform Entity Relational model (of relational OLTP) to Star model/s. We here present and evaluate a systematic approach for transformation of Entity Relational model to Star model. On experimenting, we prove that, by using our approach, inexpert designers can produce Star models alike to the star models produced by qualified data warehouse designers.[1]
An ER model can be transformed into dimensional models by a method of selective subsetting, denormalization, and (optional) summarization. Understanding the relationship between the two types of models can help to bridge the gap between operational system (OLTP) design and data warehouse (OLAP) design. Concluding, it results in a more complete dimensional design, which is less dependent on the designer’s capability to choose the ―right‖ proportions.[2]
Keywords: Decision support systems, computer-based decision aids, Data Warehouse, ER model, Star model.
I. INTRODUCTION
The answer to understanding the relationship between DM and ER is that a single ER diagram splits down into multiple DM diagrams. Think of a large ER diagram as representing every possible business process in the enterprise. It’s no wonder the ER diagram is extremely complex. The first step in converting an ER diagram to a set of DM diagrams is to break up the ER diagram into its isolated business processes and to represent each one independently.
© 2016, IJCSMC All Rights Reserved 440
The final master DM model of a data warehouse for a large project will consist of somewhere between ten and twenty very similar-looking star join schemas. Every star join will have four to twelve dimension tables. If correctly designed, many of these dimension tables will be shared from each fact table to every other fact table.
II. THEORETICAL EXPLANATION:WHY DIMENSIONAL MODELING WORKS
The theoretical explanation of dimensional modeling’s success in designing databases is that the end users can understand and write queries efficiently.
Rule #1: ―Chunking‖
Psychological studies demonstrate that because of limits on short-term memory, human beings have a strictly limited capacity for processing information—this is estimated to be “the magical number seven, plus or minus two”. If the amount of information received exceeds these restrictions, information burden result and knowledge degrades quickly (Lipowski, 1975). The primary mechanism used by the humans to deal with with large amounts of information is to arrange it into “chunks” of convenient size (Weber,1996; Baddeley, 1999; Miller, 1956). The capability to recursively develop information-saturated chunks is the answer to people’s capability to handle complexity every day. This procedure of organizing data into a set of split star schemas efficiently provides a way of organizing a large quantity of data into cognitively convenient “chunks.”
Rule #2: Hierarchical Structuring
Hierarchy is one of the most common ways of organizing difficulty for the purposes of human perceptive, and is one of the fundamental principles of systems theory (Flood and Carson, 1993; Klir, 1985). Herbert Simon, the double Nobel Prize winner, observed the use of hierarchy to organize intricacy in organizational systems, social systems, biological systems, physical systems, and symbolic systems (Simon, 1996). Thus, he projected hierarchical organization as a common architecture for complexity. Hierarchical structures act as a convolution management device by reducing the number of items one can deal with at every level of the hierarchy. For example, instead of having to deal with a million clients, one can cluster them into a hundred market sectors and then into ten market subdivisions. Hierarchical structures are a well-known and accepted way of organizing information, and are all around us in everyday life. Each dimension in a star schema naturally consists of one or more hierarchies. These provide a way of classifying business events stored in the fact table, thereby dipping complexity.
Inference
These two rules together present possible details for why dimensional modeling has been so flourishing in practical. Unlike conventional database design techniques, dimensional modeling is not based on any presumption but simply progress as a result of practice. However, quicker review shows that it is based on some common organizational principles (from psychology and systems theory) that have been used to manage complexity in a wide range of area. This is barely unexpected, as one of the most important troubles in data warehousing is complexity management. Existing practice in dimensional modeling has extra of the characteristics of an art than a science, and relies greatly on common-sense, practice, and “rules of thumb. For example, the “seven plus or minus two” principle could be used to define a limit on the number of proportions in a star schema, to make certain that it characterizes a theoretically controllable “chunk” of data.
III. SHORTCOMINGSOFEXISTINGTECHNIQUES
There are a number of methods for converting an ER schema into a Star Schema. Limitations of each method are mentioned below.
Schema Transformation Technique (ST):
© 2016, IJCSMC All Rights Reserved 441 From E/R to Dimensional Fact Model (ERDFM):
Limitations of this method are: i) ERDFM is semi-automated approach and it gives best product only when schema is normalized, ii) in the nonexistence of relationship between entity and selected fact, this approach cannot result in any attribute tree, iii) constellation of multiple start schemas’ cannot be produced, by using this approach.
From ER to Dimensional model (GER):
The limitations of this method are: i) this move toward producing surprisingly different Star models from same ER schema (that has differently designed ER Diagrams), ii) all transactional entities produce fact tables
IV. DERIVING DIMENSIONAL MODELS FROM ERMODELS
Modern approaches to dimensional design typically acquire a top-down approach, in which dimensional models are produced directly from user query and analysis requirements (“demand side analysis”). While this may seem like a sound, “customer-driven” approach, it ignores one of the fundamental realities of the data warehouse environment. To a great extent, a data warehouse is just a repackaging of operational data in a further handy form.
Producing dimensional models from ER models also gives a more planned approach to dimensional design than starting from first principles. There is a large theoretical “leap” in getting from end-user examination requirements to dimensional models, with which every but the majority talented designers have trouble. This approach mentioned in this paper can diminish this knowledge curvature by providing a stepwise approach to developing dimensional models starting with the source data.
Figure 1: ER Representation of a Star Schema
Example, (Figure 1) Entity Relational model for an order processing system. This consists of 42 entities, which is less than half the size of the average application data model, but sufficient to demonstrate the main rules of the approach. The majority of end users would find this schema beyond the understanding, as it surpass the limits of human cognitive capacity many times over. Also, simple queries would require multi-table joins and/or sub queries, and as a consequence, end users would be heavily reliant on technical professionals to write down queries for them.
The conversion of an ER Model to dimensional form takes place in four steps:
Step 1: Classifying entities
Step 2: Designing high-level star schema Step 3: Designing thorough fact table
© 2016, IJCSMC All Rights Reserved 442 Step 1: Classification of entities
The primary step in the transformation technique is to classify entities into three divergent categories:
Transaction Entities: These entities trace details of business proceedings (e.g., orders, shipments, payments, insurance claims, bank transactions, hotel bookings, airline reservations, and hospital admissions). The majority of decision support applications are centered on these events to spot patterns, trends, and potential problems and opportunities. The exemption to this rule is the case of “snapshot” entities: entities recording a fixed rank of some product at a point in time (e.g., account balances and inventory levels). These do not trace business events as such, but the result of events on the condition of an entity.
Component Entities: The entities those are straightforwardly linked to a transaction entity by a one-to-many relationship. They are caught up in the business event, and answer “who,” “what,” “where,”“how,” and “why” questions about the event.
Classification Entities: These entities are associated to a component entity by a chain of one-to many relationships. These entities describe embedded hierarchies in the data model and are used to categorize component entities.
Classification of entities for above is shown in Figure 2.
Figure 2. Classification of Entities
The three transaction entities are given in the model: Order, Order Item, and Stock Level. Order and Order Item match up to business events, while Stock Level records a fixed level (a “snapshot” entity). Order and Order Item stand for dissimilar levels of detail of the identical business event. There are six component entities: Customer, Employee, Retail Outlet, Product, Warehouse and Delivery Method. Product is a factor of two different transactions (Stock Level and Order Item). Therefore, there are thirty one classification entities defining separate but partially overlapping hierarchies in the model. Note that some of the entities in the underlying data model do not fit into any of these categories. Such entities do not fit the hierarchical organization of a dimensional model and hence cannot be represented in the form of a star schema. Thus, the practice of “dimensionalizing” an ER model successfully “weeds out” nonhierarchical data.
Step 2: Designing High-Level Star Schema
© 2016, IJCSMC All Rights Reserved 443 2.1 Identifying Star Schemas Necessary
Each transaction entity is a candidate for a star schema. The procedure of creating star schemas is subsetting—dividing a large and composite model into manageable-sized chunks. Each star schema is centered on only one business event, and therefore represents a manageable-sized “chunk” of data. However, the transactions not always have one-to one association among transaction entities and star schemas: All the transactions will not be important for decision- making purposes: user input will be necessary to opt which transactions are appropriate. Numerous star schemas at dissimilar levels of detail may be necessary for a particular transaction. When transaction entities are associated in a master-detail structure, they should be joined into a single star schema, as they symbolize different views of the same event
2.2 Defining the Level of Summarization
One of the most significant decisions in star schema design is to decide the appropriate level of granularity— the level of detail at which data is stored. Granularity is defined as what each row in the fact table represents. At the top level, there are two main options in choosing the level of granularity: Unsummarized (transaction level granularity): this is the uppermost level of granularity wherein each fact table row match up to a solo transaction or line item Summarized: transactions may be summarized by a division of dimensions or dimensional attributes. In this case, each row in the fact table corresponds to multiple transactions. The subordinate level of granularity (or conversely, the higher the level of summarization), the less storage space is necessary and the faster queries will be executed. Hence, the disadvantage is that summarization all the time loses information and consequently confines the types of analyses that can be carried out. Transaction-level granularity provides greatest flexibility for analysis, without information lost from the unique normalized model. However, for performance—when dealing with large data volumes— or to make simpler the view of data for a particular set of users, some level of summarization may be necessary. An vital design consideration is that all of these star schemas should use accurately the same dimension tables or views defined on these tables— these are called “conforming” dimensions (Kimball, 1996, 2002).[4]. This ensures that users can “drill across” from one star schema to another. There is an almost infinite range of possibilities for creating summary level star schemas for a given transaction entity. In general, any combination of dimensions or dimensional attributes may be used to summarize transactions. For example, orders could be summarized by: Month (an attribute of the Date dimension) and Retail Outlet: this gives monthly sales totals for each retail outlet. Date, Product, and City (an attribute of the Retail Outlet dimension): this gives daily product sales for each city. These indicate the “group by” conditions for star schema load processes.
2.3 Identifying Relevant Dimensions
Component entities connected with each transaction entity symbolize candidate dimensions in the star schema. However, the correspondence among component entities and dimensions is not always one to one: If a component entity has no dependent attributes, its key will be included in the fact table but it will not have its own dimension table. This is called a degenerate dimension. Clear dimensions are required to represent dates and times. These correspond to data types rather than entities at the operational level.
© 2016, IJCSMC All Rights Reserved 444
The above figure shows fact table corresponds to an individual Order Item (line item granularity). The star schema has six dimension tables corresponding to the five component entities associated with the transaction, plus an additional Date dimension. There are multiple relationships to the Date dimension corresponding to the date the order was made and when it was posted to the general ledger.
Transaction entities associated in a master-detail structure should be united into a single star schema. Component entities related with either of the entities turn out to be dimensions in the resulting star schema. Many times the “master” entity will grow to be a “degenerate” dimension in the star schema: it forms part of the key of the fact table but has no corresponding dimension table (Figure 4). Reason for this is that all attributes of the master entity should be allocated down to the item level and stored in the fact table.
Figure 4: Merging of "Master-Detail" Entities
Figure 5: Transaction Level Star Schema for Stock Level Transaction Entity
Figure 5 represents the transaction level star schema for the Stock
Level transaction entity, which is an illustration of a “snapshot” or level entity. Every tuple in the fact table records the inventory level of a particular product in a particular warehouse on a particular date.
The star schema has three dimension tables, corresponding to the two component entities associated with the transaction entity plus an explicit Date dimension. When non-transaction level granularity is chosen, the dimensions required will be determined by how the transactions are summarized. This will normally be a division of the dimensions used in the transaction level star schema, though dimensions may themselves be subsets of the transaction level dimension tables (e.g., Month instead of Date).
© 2016, IJCSMC All Rights Reserved 445 Step 3: Detailed Fact Table Design
Complete fact tables for each star schema is defined as under (attribute level design).
3.1 Defining Key
Composite key consisting of the keys of all dimension tables in addition to any degenerate dimensions is the key of each fact table. In a relational database, the key should be negligible: no subset of the attributes in the key should also be distinctive. However, the key of a fact table includes all dimensional keys, and will as a result not be nominal in the majority of cases.
Figure 7: Transaction Level Order Item Fact Table
3.2 Defining Facts
The non-key attributes of the fact table are facts that can be evaluated using numerical functions. The attributes are stored in transaction entities. On the other hand a key notion in defining facts is that of additivity.
Figure 8: Daily Sales Summary Fact Table
© 2016, IJCSMC All Rights Reserved 446
means converting semi and non-additive facts to additive facts. In the example, Unit Price (a non-additive fact) can be converted to an additive fact by multiplying it by Quantity Ordered to form the Extended Price (the total price for an individual order item). Note that this transformation does not lose information: the Unit Price for a particular order item can be derived by dividing the Extended Price by the Quantity Ordered. Figure 7 shows the detailed fact table design for the transaction level (non-summarized) Order Item star schema. Each row in the table corresponds to an individual order item. The key of the fact table consists of the keys of all the dimension tables, as well as the degenerate dimension. The non-key attributes are the combination of the attributes in the two original transaction entities (Order and Order Item). For transaction entities connected in a “master-detail” structure, all attributes of the master record should be allocated down to the item level if possible (Kimball, 1995). For example, if discount is defined at the master (Order) level, the total discount amount should be allocated at the item level (e.g., in proportion to the price for each item). Otherwise, queries will result in multiple counting of discounts. The same should be done to delivery charges, order level taxes, fees, etc. If attributes of the master entity cannot be allocated down to the item level, different star schemas may be required for each.
Step 4: Detailed Dimension Table Design
This is the last and the most important step that completes the detailed design of the star schema.
4.1 Defining Dimensional Key
The key of each dimension table should be a straightforward (single attribute) numeric key. Thus, the operational key may require to be generalized to ensure that it remains unique over time. Because operational systems often only require key uniqueness at a point in time (i.e., keys may be reused over time), this may reason problems when performing historical investigation. Also situations where the dimensional key needs to be indiscriminate is in the case of gradually altering dimensions.
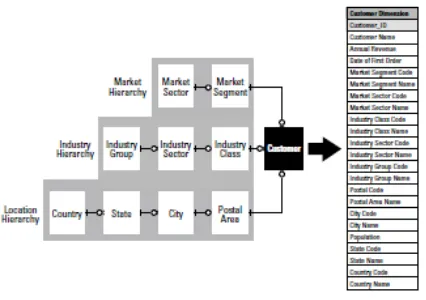
4.2 Collapsing Hierarchies
Dimension tables are built by “collapsing” or denormalizing hierarchies into component entities.
Figure 9. Collapsing Hierarchies
The final dimension table contains the union of all attributes in the original entities— as many descriptive attributes should be included as possible to support slicing and dicing of data in different behaviors. Therefore, it is common for dimension tables to contain more than a hundred attributes. This process introduces redundancy in the form of transitive dependencies, which are violations to third normal form which means that the resulting dimension table is in second normal form (2NF).
4.3 Replacing Codes and Abbreviations by Descriptive Text
© 2016, IJCSMC All Rights Reserved 447
V. CONCLUSION
The widely accepted view that dimensional modeling is fundamentally different from, and incompatible with, ER modeling is questioned here. We have shown that a dimensional model is just a restricted form of an ER model and that there is a simple transformation between the two. An ER model can be changed into a set of dimensional models by a process of selective subsetting, denormalization, and (optional) summarization:
Subsetting: The ER model is divided into a set of disconnected star schemas, each centered on one business event (transaction entity). This reduces complexity through a process of “chunking.” Denormalization: Hierarchies in the ER model are combined to form dimension tables which reduces difficulty by reducing the count of separate tables. Master-detail transaction entities are denormalized into a single fact table, as these represent different views of the same underlying event.
Summarization: The majority flexible dimensional structure is one in which each fact represents a single transaction or line item. Thus, the summarization may be required for performance reasons, or to suit the needs of a particular group of users.
Transforming dimensional models from an Entity Relational model gives a more controlled method to developing dimensional models than starting from scratch, which can help avoid many of the drawbacks faced by inexperienced designers. It also helps to resolve the difficult problem of matching “supply” (operational data sources) and “demand” (end-user information needs) in data warehouse design. Further it gives a more absolute dimensional design, as it involves selecting from all possible ways of examining the data in the underlying operational systems, and hence is less dependent on the designer’s ability to choose the “right” dimensions.
All of the tables in the star schema are denormalized to at least some extent: each table corresponds to multiple entities in the original normalized ER model. The dimension tables are the result of collapsing classification entities into component entities, while the fact table is the result of merging the master and detail transaction entities. All of the dimension tables are in 2NF: they have simple keys and no repeating attributes. The fact table is in 3NF as Discount Amount (an attribute of the Order entity) has been allocated down to the line item level. This means that Order becomes a degenerate dimension as it has no other dependent attributes. The Date Dimension is a new table which does not correspond to any entity in the original ER model. This is because dates must be explicitly modeled in a star schema, whereas at the operational level they are represented as data types.
REFERENCES
[1] https://www.academia.edu/4487441/A_systematic_approach_for_transformation_of_ER_schema_to_dimensional_schema [2] From_ER_Models_to_Dimensional_Models_Part_I