c
Owned by the authors, published by EDP Sciences, 2010
Total neutron cross section for
181
Ta
A. Mati´c1,a, R. Beyer1, E. Birgersson1, A. Ferrari1, E. Grosse1, R. Hannaske1,2,
A. Junghans1, T. K¨ogler1,2, R. Massarczyk1,2, M. Mosconi3, R. Nolte3, K.-D. Schilling1, R. Schwengner1, and A. Wagner1
1 Institut f¨ur Strahlenphysik, Forschungszentrum Dresden-Rossendorf, Germany 2 Technische Universit¨at Dresden, Germany
3 Physikalisch Technische Bundesanstalt Braunschweig, Germany
Abstract. The neutron time of flight facility nELBE, produces fast neutrons in the en-ergy range from 0.1 MeV to 10 MeV by impinging a pulsed relativistic electron beam on a liquid lead circuit [1]. The short beam pulses (∼10 ps) and a small radiator volume give an energy resolution better than 1% at 1 MeV using a short flight path of about 6 m, for neutron TOF measurements. The present neutron source provides 2·104n/cm2s at the
target position using an electron charge of 77 pC and 100 kHz pulse repetition rate. This neutron intensity enables to measure neutron total cross section with a 2%–5% statistical uncertainty within a few days. In February 2008, neutron radiator, plastic detector [2] and data acquisition system were tested by measurements of the neutron total cross section for181Ta and27Al. Measurement of181Ta was chosen because lack of high quality data in
an anergy region below 700 keV. The total neutron cross – section for27Al was measured
as a control target, since there exists data for27Al with high resolution and low statistical
error [3].
1 Introduction
Global greenhouse effect induced by CO2 emission has become the most significant ecological
problem of modern world in recent years. The main CO2emission comes from fossil fuel burnings
(oil, coal). As a search for renewable energy sources is intensified, nuclear energy is identified as the alternative for the fossil burning processes. The main problem for the present nuclear reactors is a radioactive waste management. Future Generation IV nuclear reactors and accelerator driven systems are required to produce smaller amount of radioactive waste and to burnup existing radioactive waste. The primary goals of the GenIV nuclear reactors are to: improve nuclear safety, improve prolifera-tion resistance, minimize waste and natural resource utilizaprolifera-tion, decrease the cost to build and run such plants. The six most promising GenIV nuclear reactor models were selected for the further develop-ment, by the Generation IV International Forum GIF Ref. [4]. Three from the six recommended reactor models will work with fast neutrons. Furthermore, in order to increase economical efficiency the very-high-temperature reactor is supposed to work at temperatures up till 1100◦C, which makes possible hydrogen production. All other suggested models need to work in a temperature range between 500◦C and 1000◦C. One of the most critical points in early stage of GenIV reactor development is a research for support materials, these materials need to be temperature resistant and radiation damage resistant. Tantalum and its alloys are prospective supporting materials or coating materials for GenIV reactors, due to tantalum high melting point (3017◦C) and high corrosion resistance [5]. Additionally, there is a lack of high quality data below 700 keV for total neutron cross section for181Ta, therefore, we made
ae-mail:[email protected]
Chamber
−
Dump
Plastic
Pb loop
e
Fission
n
Beam
(a) (b)
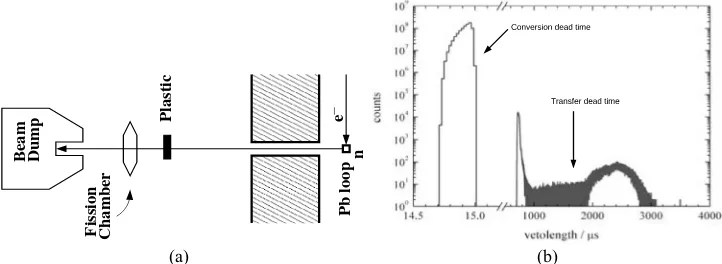
Fig. 1. (a)A schematic view of detector setup.(b)A simulatedconversiondead time andtransfer dead time spectra.
the first test of neutron TOF facility nELBE by performing neutron transmission experiment with a
181Ta absorber.
2 The experimental setup
The electrons are accelerated up tp 40 MeV using the superconducting Electron Linac for beams with high Brilliance and low emittance ELBE [6]. The bremsstrahlung radiation is induced by imping-ing a high intensity electron beam on a liquid lead loop [1], and fast neutrons are generated via the (γ,n) reactions. Owing to an electron bunch length of less than 10 ps, and small dimensions of the neutron radiator (∼1 cm3 Ref. [1]), we are able to achieve high time – of – flight resolution with a
short flight – path of 6 m. Schematic view of experimental area and position of a detector system are given in Fig. 1(a). Neutrons are isotropically emitted from the radiator and guided by a conical collimator (entrance diameter is 2 cm, length 2.4 m, and exit diameter is 3 cm Ref. [6]). A proton – recoil plastic detector developed in house [2] was used as neutron detector. The detector is made from fast plastic – scintilation material EJ200. Originally the detector is developed for measurements of outgoing netrons for neutron inelastic experiments, therefore it is cutted in large area stripes of 1000×42×11 mm3. For a determination of position of the proton-recoil reaction and better timing resolution, the scintillators are readout by two Hamamatsu2 R2059-01 2 inch. photomultiplier tubes (PMTs), one at each end. The achieved time resolution (FWHM) is better than 700 ps [2]. A VMEbus-based data acquisition system is used for readout of the detector, a 32-channel QDCs (CAEN V792) integrate the analog signals of both PMTs, used to readout the plastic detector, for 500 ns to obtain the light output signal and itroduces aconversiondead – time in order of 7–8µs. One multihit multievent TDC (CAEN V1190A) is used to determine timing information, it collects 32 events and introduces atransfer dead time larger than 700µs, during a readout of memory. The nELBE setup is devel-oped dominantly for neutron inelastic scattering experiments and consists of the plastic detectors for neutron detection and BaF2detectors for emittedγ-rays detection. Therefore QDC CAEN V792 is
ex-changed later on with CAEN V874B TAPS (conversiondead time is in order of 15µs), the same mod-ules are used in BaF2branch too. A detailed description of the data acquisition system can be found
in Ref. [2].
3 Neutron time-of-flight spectra
TOF [ns] 0 500 1000 1500 2000 2500
Counts/[ns]
1 10
2
10
3
10
4
10
5
10
6
10
7
10
Neutron TOF for tantalum absorber
(a)
Neutron time›of›flight [ns]
0 500 1000 1500 2000 2500
Counts/accelerator bunch [counts/ns]
›9 10
›8 10
›7 10
›6 10
›5 10
›4 10
›3 10
›2 10
›1 10
Neutron time of flight spectra
(b)
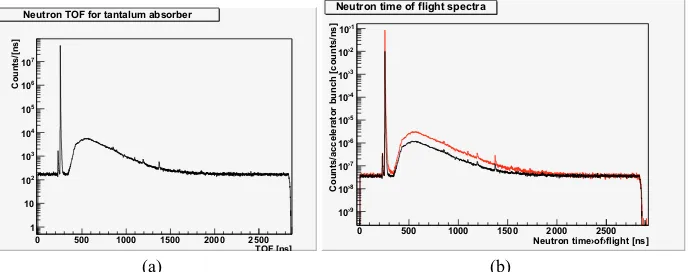
Fig. 2. (a)A typical TOF spectrum at nELBE.The spectra are completely dominated byγ– flash count rate.
(b)A typical TOF specta at nELBE without target (red) and with traget (black). Spectra are normalized to the number of bunches when system was able to record data at given channel (ns). Please note that a background level for target – measurement and no – target measurement are the same.
5 different absorbers. For the experiment we used a 2.55 cm thick 181Ta (99.988%) absorber and
4.00 cm thick27Al (100%) absorber. We accumulated spectra by changing absorbers, or without
ab-sorber, every hour. Average neutron andγcount rates for different runs showed good beam stability during the experiment.
Typical nTOF spectra for181Ta and no target are shown at Fig. 2(a). Clearly separatedγ– flash and a white neutron spectra can be seen. It is clear that theγ– flash originating from radiator completely dominates the spectra. Neutrons make only 0.6% of total events for the no target measurement, 0.6% of total events for the27Al measurement and 3.2% of total events for the181Ta measurement. With an
averageconversiondead time around 8µs, originating from QDC digitizing process, it is clear that a detection of aγwill prevent detection of a neutron in the same bunch. Therefore, every channel has different life – time, which has to be taken into proper account in the data analysis.
The data acquisition system at the time of the experiment was recording only total dead – time information. In order to determine the dead time per data acquisition channel we needed to investigate the distribution ofconversiondead time andtransferdead time. For this purpose we builded a setup with the existing electronic modules used in the actual double time – of – flight setup, used for the in-elastic scattering experiments. We used a 3MBq226Ra radioactive source and plastic detectors together
with adapted electronics in order to simulate nTOF spectra. At same time we collected information aboutconversiondead time andtransferdead time. Typical dead time spectra obtained with this setup are shown at Fig. 1(b). From the figure it can be seen thatconversiondead time is in range of 15µs, andtransferdead time in range 700µs till 3 ms. The investigation of dead – time spectra showed that shape of the spectra depends on the number of detectors in system, type of electronic modules, setted thresholds for QDC and CF and more. It became clear that an accurate correction, and with that an independent cross section measurement, can not be done without recorded dead time after every each dataconversionand data readout. Therefore, the existing DAQ system has been modified to record these dead time information too, and it will be used for future neutron transmission experiments, and it is already used for neutron inelastic scattering experiments.
4 Total neutron cross section for
27Al and
181Ta
As mentioned earlier, during the experiment in February 2008 we collected neutron transmission data for27Al. This measurement is done in order to compare our the first test measurement with existing
0.5 1 1.5 Neutron Energy [MeV]
2 3 4 5 6 7 8
Cross Section [barn]
Rohr 1994 Schwartz 1974 nELBE
neutron total cross section for 27Al
Referent data are rebined on nELBE energy resolution
(a)
0 2 4 6 8
Cross section [barn]
nELBE February 2008 Schwartz_1974
Total neutron cross section for 27Al
Conversion time 7 µs
0 1 2 3 4 5 6
Neutron Energy [MeV] -40
-20 0 20 40
Relative diff [%]
Difference betwen Schwartz and nELBE data
(b)
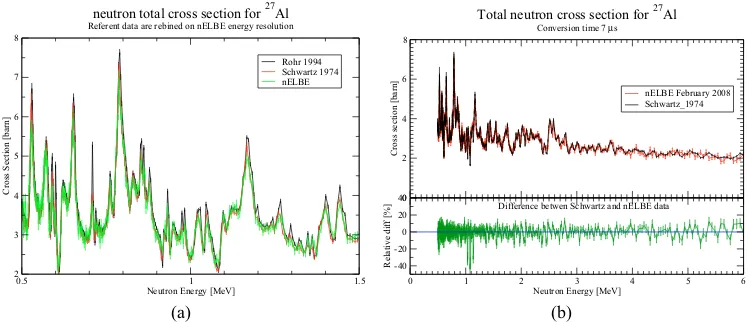
Fig. 3. (a)An hardening effect can be seen. Owning to its high time resolution, Rohr data have larger cross section at strong narow resonances. Reference data are rebined to nELBE energy resolution.(b)The difference between present data and Schwartz [7] data. Present data are systematically higher than Schwartz data for 1%.
obtained during dead – time determination experiment. However, the mean conversion time for these two modules differ, therefore, we will shift the mean value of the determined dead – time distribution up to a value where our measured total neutron cross section has the best agreement with published values for27Al. And after that use the adjustedconversion dead – time distribution with the same
mean value in order to correct181Ta measurement and check agreement with published data for181Ta.
Therefore, we will calibrate our tantalum data relatively to the aluminum.
Furthermore, in data analysis we need to consider that regardless to the excellent time resolution of nELBE facility (less than 1 ns), due to the flight path of 6.5 m, present energy resolution is between 0.2% and 2% in a neutron energy range between 0.2 MeV and 10 MeV. In this case our energy resolu-tion is worse than at Geel [3] with a flight path of 388 m. This difference in energy resolution makes a problem to compare present data with Rohret al.[3] because of “hardening” effect Ref. [8] in case of narrow resonances measurement. An example of the hardening effect can be seen from Fig. 3(a),27Al
has strong narrow resonances, where total neutron cross section rapidly vary and can not be consid-ered constant within our bin size. This is the case when the primary beam flux in the sample will not decrease exponential, some neutrons of certain energies will be removed more than others and a trans-mission experiment will provide an averaged cross section. In order to compare the present data with the previous, we first rebined Rohr [3] and Schwartz data [7] to our Energy resolution, see Fig. 3(a). From the same figure it can be seen much better agreement between present data and Schwartz data, due to the similar energy resolution, therefore from now on we will compare present data only with Schwartz data Ref. [7].
The original not gated spectra contain all events that triggered the detector system. Every of these events producedconversiondead time. For every time bin and for every event in that bin we randomly generateconversion dead time based on theconversionspectra from Fig. 1(b). This way we have information when the DAQ system was blocked and for how long, videlicet, we know for every time – bin when it was blocked. Consequently, for every each channel, we obtained information for how many accelerator bunches a channel was live. For the transfer dead time we assume an uniforme distribution, because transfer time is much wider (700µs–3 ms) than an accelerator cyclus (10µ).
As we explained before, for the transmission data analysis we needed to adjust the obtained
conversiondead – time distribution Fig. 1(b), to a dead - time distribution corresponding to DAQ system with CAEN – V792 QDC. For that purpose we shifted the obtainedconversiondead – time distribution for a constant value up a value what gives the best agreement with Schwartz data [7]. The best agreement is obtained for aconversiondead – time distribution of∼7µs, where an average difference between present data and Schwartz data was 1%, see Fig. 3(b). Furthermore, the value of
∼7µs for theconversiondead time is in an agreement with nominal CAEN – V792 QDCconversion
4 5 6 7 8 9
Cross section [barn]
nELBE February 2008 Foster_1972
Total neutron cross section for 181Ta
Conversion dead time is 7 µs
2 3 4 5 6
Neutron Energy [MeV] -40
-20 0 20 40
Relative diff [%]
Difference betwen Foster and nELBE data Average difference is +1.6 %
(a)
0 1 2 3 4 5 6
Neutron Energy [MeV] 4
5 6 7 8 9
Cross section [barn]
Martin (1966) Foster (1972) nELBE February 2008 Poenitz (1981)
Total neutron cross section for 181Ta
(b)
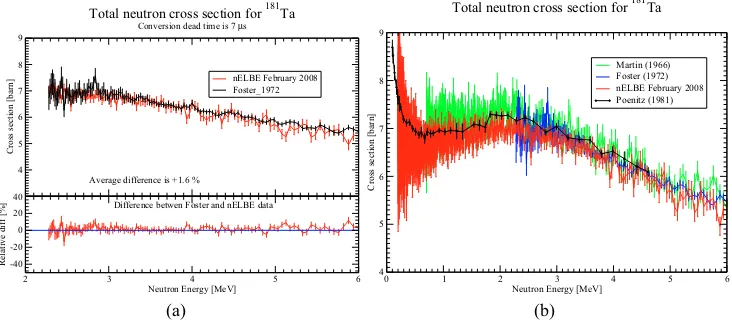
Fig. 4. (a)The difference between present data and Martin data. Present data are systematically lower than Ref. [9] for 1.6%.(b)Total neutron cross sesction for181Ta, present data are compared with previosly published data
Refs. [9–11].
Theconversionmean value for27Al is adjusted at 7µs, and we used the sameconversion- time
distribution in order to analyze our181Ta data. We want to check does same parameter what corrected
aluminum data can correct tantalum data. The best agreement we obtained with data published by Fosteret al.[10], where we obtained cross section sistematically lower for 1.6 %. The present data in comparison with all previous data are given at Fig. 4(b) There are few publications for neutron total cross section at181Ta in fast energy region that we compare our results with, Refs. [9–11]. Experiments
done by Martin [9] and Foster [10] have high resolution, however, there is a systematic shift, Martin’s data are systematically higher than data given by Foster. Furthermore data given by Poenitz [11] has low energy resolution. We did not want to judge who from Foster or Martin has better data, we checked how much are we in agreement with every of them. After applying of the correction we found that we are in the excelent agreement with Foster data [9], see Fig. 4(a), systematically we are 1.6% lower than Martin.
5 Conclusion
The present data analysis done on a data set collected during February 2008 shown that in the case of high count rate TOF experiments it is necessary to collect and record dead – time data for each and each event in order to get correct dead time values for every channel. Therefore, if dead time per event can not be collected by a system, a minimum required information is to collectconversion
dead – time spectra. As it is shown above this information is enough to analyze data. In our case we managed to reproduce dead – time spectra buy building up a dedicated setup. Theconversiondead – time distribution was adjusted to the27Al data Ref. [7], by using this information we obtain total
neutron cross section for181Ta in agreement with measurements Refs. [9–11]. We showed consistency
of calculated cross sections for the correction for both absorbers. The data acquisition system at nELBE facility has implemented recording of dead time per events, therefore, procedure described above will not need to be perfomed. A new neutron transmission experiments for181Ta is scheduled, the future
data will be an excellent cross – check for correctness of the described procedure.
References
3. G. Rohr, Conf. on Nucl. data for Sci. and Tecn., Gatlinburg (1994), p215
4. US Department of Energy, A technolgy roadmap for generation IV nuclear energy systems, GIF-002-00
5. S. Byunet al., J. of Nucl. Mater.377, (2008) p72 6. J. Kluget al., NIM A577, 2007, p641
7. R.B. Schwartz et al., National Bureau of Standards, Washington DC, US, Monograph number 138, 1974/01
8. J.B. Marion and J.L. Fowler,Fast neutron physics part IIp1004–p1005 9. R.C. Martinet al., Buil. Amer. Phys. Soc.12, (1967), p106