Author’s Accepted Manuscript
Optimization of microstructured hollow fiber design for membrane distillation applications using CFD modeling
Xing Yang, Hui Yu, Rong Wang, Anthony G. Fane
PII: S0376-7388(12)00571-6
DOI: http://dx.doi.org/10.1016/j.memsci.2012.07.022
Reference: MEMSCI11528
To appear in: Journal of Membrane Science
Received date: 27 May 2012
Revised date: 20 July 2012
Accepted date: 22 July 2012
Cite this article as: Xing Yang, Hui Yu, Rong Wang and Anthony G. Fane, Optimization of microstructured hollow fiber design for membrane distillation applications using CFD
modeling, Journal of Membrane Science,
http://dx.doi.org/10.1016/j.mem-sci.2012.07.022
This is a PDF file of an unedited manuscript that has been accepted for publication. As a service to our customers we are providing this early version of the manuscript. The manuscript will undergo copyediting, typesetting, and review of the resulting galley proof before it is published in its final citable form. Please note that during the production process errors may be discovered which could affect the content, and all legal disclaimers that apply to the journal pertain.
Optimization of microstructured hollow fiber design for membrane distillation
applications using CFD modeling
Xing Yang1,2, Hui Yu1,2,3, Rong Wang*,1,2, Anthony G. Fane1,2
1. Singapore Membrane Technology Centre, Nanyang Technological University, Singapore 639798
2. School of Civil and Environmental Engineering, Nanyang Technological University, Singapore 639798
3. School of Chemical Engineering, Sichuan University, China 610065
*Corresponding author at: School of Civil and Environmental Engineering, Nanyang Technological University, 639798 Singapore,
Abstract
This study explores the potential of microstructured hollow fiber designs to enhance process
performance in a direct contact membrane distillation (DCMD) system. Hollow fibers with
ten different geometries (wavy and gear-shaped cross sections) were evaluated. A series of
three dimensional computational fluid dynamic (CFD) simulations were carried out to
investigate their capability in terms of depolarizing the buildup of liquid boundary layers, thus
improving water productivity.
Analyses of heat and mass transfer as well as the flow-field distribution in respective MD
modules were obtained. It was found that the enhancement of the heat-transfer coefficients, hf,
was up to 4.5-fold for a module with a wavy fiber design 07 and an approximate 5.5-fold hp
increase for a gear-shaped fiber design. The average temperature polarization coefficient and
mass flux Nm of the gear-shaped fiber module showed an improvement of 57 % and 66 %,
respectively, over the original straight fiber design, followed by the wavy designs 07 and 08.
The enhanced module performance was attributed to the improved hydrodynamics through
the flow channels of various fiber geometries, which was confirmed by the visualization of
flow-field and temperature profiles in CFD. Investigations of the fiber-length effect showed
that the gear-shaped fiber modules exhibited the highest flux enhancement of 57–65 % with
the same length, compared to the modules with original straight and wavy fibers.
In addition, the gear-shaped fiber module is very sensitive to feed velocity changes. Therefore,
employing a smart microstructured design on the membrane surface would bring in a
production and hydraulic energy consumption (HEC) among the modules with various fiber
geometries were compared. With 1.9-fold surface area increase per unit volume, the
gear-shaped fiber configuration had the highest water production but the lowest HEC,
followed by wavy designs 07 and 08.
Key words: membrane distillation, computational fluid dynamics, microstructured fiber
1. Introduction
As a hybrid process of membrane separation and conventional distillation, membrane
distillation (MD) is considered as a promising alternative technology for desalination to
obtain clean water when waste-heat or low grade heat are available. It is a combined mass-
and heat-transfer process, where the driving force is the vapor pressure gradient (due to the
temperature difference) across the membrane wall. The membrane material itself should be
sufficiently hydrophobic to separate the feed (hot) and permeate (cold) streams, as well as to
prevent pore-wetting problems. In the configuration of direct contact MD (DCMD), the mass
and heat transfers take place in three steps: water molecules in the hot stream first evaporate
at the mouth of the membrane pores, then the vapor flows through the membrane matrix until
condensation takes places on the cold permeate surface. As a result, high-purity water is
generated. Having been studied for over 3 decades, MD is of great interest due to the benefits
of moderate operating temperature, acceptable permeation rate and high salt rejection.
However, industrial applications of MD remain limited due to the following technical
challenges [1, 2]: difficulties in fabricating suitable MD membranes for high water
permeation flux and prevention of pore wetting; relatively high thermal energy consumption
(with the access to low great heat), and poor flow hydrodynamics and/or severe temperature
polarization (TP) effects that compromises module performance [3, 4].
In MD, the membrane structure and material properties contribute to the permeation rate,
focused on membrane development [5-9], with special interest in hollow fibers due to their
high surface area and modular versatility[3]. Although a few highly permeable hollow fiber
membranes with large MD coefficients are available [7, 10-15], the development of MD
membranes are still constrained by the conventional spinning methods and the limitation of
suitable material properties. Also, the advantages of highly permeable fibers are often
compromised by the morphological defects, weak mechanical strength and unsustainable
long-term performance [11].
On the other hand, many studies have also focused on strategies to improve the MD
performance through optimizing operation parameters [9, 16-20] and designing novel
membrane modules [21-23] to alleviate the TP phenomenon and enhance permeation flux. It
is shown that by incorporating proper flow alteration aids such as channeled design, external
spacers or baffles into module designs, secondary flows or eddies are created. As a result, the
MD flux can be greatly enhanced and the TP phenomenon can be mitigated [1, 9, 16-19,
24-29].
Another area that has been investigated for improved module performance is the
microstructured surface design of the hollow fiber membranes. Inspired by the concept of
corrugated surface adopted in heat-exchangers to enhance flow hydrodynamics, novel hollow
fibers with modified surface geometries have been fabricated using specially designed
spinnerets [30, 31]. It was reported that hollow fibers with modified surface geometries such
as gear or flower shapes in cross-section have greatly improved membrane filtration
water flux enhancement, but also acting as turbulence promoters and improving anti-fouling
performance for submerged membrane bioreactors (MBR) and ultrafiltration modules [32-36].
In spite of the potential benefits for creating similar improvement in a combined mass- and
heat-transfer process, no related work has been done for MD applications.
In parallel with extensive experimental studies to investigate the hydrodynamics in membrane
modules, computational fluid dynamics (CFD) modeling has also been widely adopted to
simulate and analyze fluid dynamic behaviors in membrane processes [37, 38]. With the
visualization of the flow-field (including velocity, pressure, temperature and concentration
profiles) at any locations in a defined flow channel, CFD modeling can be used to correlate
the fundamental mass- and heat-transfer performance with flow hydrodynamics. Therefore, it
has become a valuable evaluation tool for industrial applications. Nevertheless, the CFD
simulations of the MD process have been greatly limited due to the complex coupling of mass
and heat transfer across bulk fluids and the membrane matrix. Mostly, simplified
mathematical models were used in prior MD modeling work [37]. For instance, simulations of
the feed, permeate and membrane were often treated as a conjugate problem to obtain velocity
and temperature fields; while the solute transport and latent heat induced by evaporation were
ignored [39, 40]. To date, the CFD work on hollow fiber MD modules is sparsely reported [38,
41]. A recent CFD study, which proposed an improved heat-transfer model to couple the
latent heat to the energy conservation equation and combine it with the Navier-Stokes
equations, was performed by our group to address the transport relationships between the
fluids (feed and permeate) and the membrane in a single-fiber MD module [38]. The model
identifying the controlling local resistances in MD under various circumstances [41, 42].
The present work aims to evaluate the performance of a shell-side feed DCMD system with
nine different types of modified fiber geometries via three dimensional (3D) CFD modeling.
Since the gear- or flower-shaped fibers were comprehensively studied experimentally by
others [30, 31], the current study mainly discusses the wavy microstructure and only one
specific gear-shaped design. The following aspects have been investigated computationally:
(1) optimization of fiber geometric structures in terms of main MD process metrics and
flow-field and temperature distributions; (2) investigations of the length effect of modules
with original straight, optimized wavy and gear-shaped fibers; (3) effect of flow conditions on
the performance of the modules with original straight and modified fibers; (4) comparison of
membrane area, water production and hydraulic energy consumption (HEC) among modules
with various micro-structured fibers using the original design as a benchmark.
2. Theory
1.1 Geometric structures and CFD modeling methods
3D models were developed using the commercial software Fluent 6.3 to study the
hydrodynamic behavior and heat transfer characteristics of ten modules with original straight
and modified fibers of various surface geometries.
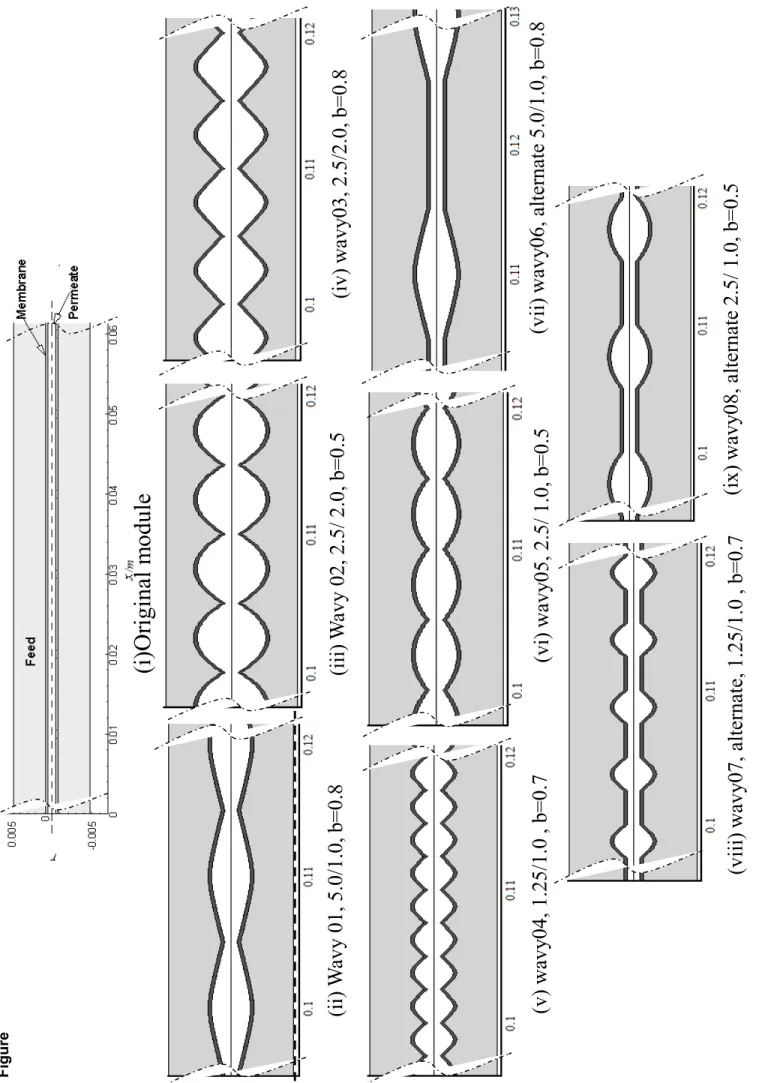
modified fibers were designed to have regularly distanced waves with a constant wall
thickness or gear-like (cross-section) structure on the outer surface. The assumed dimensions
of these single-fiber modules are 0.250.84 m in length and 0.0095 m in shell diameter. For
the convenience of CFD modeling, the geometries were assumed to be ideal
axially-symmetric structures. Hence, a series of geometric structure for 3D computing
domains were built using Gambit 2.4.6 for half of the actual modules, whose mirrored images
of cross-sectional structures (within a length range of 0.015 m with respect to the overall
length of 0.25 m) are shown in Fig. 1 (a); while Fig. 1 (b) shows a local domain amplification
to specify the dimensional parameters of these wavy microstructures, in which Rmi and Rmo are
the inner and outer radii of the fiber, x and y are the cross-sectional dimensions of a wave
in x and r (from the baseline to the conic peak) directions; Lx is the interval between two
waves; b is the shape parameter, which represents the shape of the conic wave. To clearly
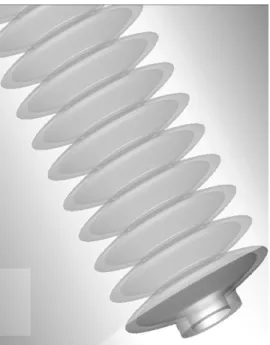
show the structures of these configurations, Fig. 2 depicts the 3D schematics of single-fiber
modules containing fibers of a representative wavy design and gear-shaped, respectively. In
all modules, the feed and permeate streams flow through the shell and lumen of the fiber,
respectively, in a counter-current mode. The dimensional specifications and respective actual
outer surface area As (taking into account the surface corrugation) of these modified fiber
geometries are given in Table 1, which shows that both wavy designs 02 and 03 have a
3.6-fold area increase compared to the original fiber; while the gear-shaped fiber gains
1.9-fold increase.
With the geometries structured, CFD simulations were carried out using Fluent. A coupled
on the membrane surfaces into the MD process. Nevertheless, the influence of the normal
mass flow across the membrane matrix was ignored due to a negligible contribution from the
MD mass flux in a single module [38]. Based on the governing transport equations and
boundary conditions involved in the simulating process discussed in a previous study [38], a
brief summary is given in Table 2. It includes mathematical models, boundary conditions and
modeling algorithms. In this study, a laminar model is used for simulating the original module
operated under laminar operating conditions (Re < 2000); while a realizable k- method is
applied for the original module under turbulent conditions (Re>2000) or configurations with
modified fibers.
In addition, it is assumed that all nine modified fibers have the similar membrane
characteristics (i.e., wall thickness, porosity, and pore size/pore size distribution, etc) as the
original fiber but with different surface geometries [38]. Also, the module specifications and
the operating conditions are the same as used previously [38]. The heat-transfer model has
been verified previously [38, 41, 42],based on an established DCMD system for a series of
experimental settings, including various feed inlet temperatures, fiber lengths and flow
velocities, and modified module configurations with external aids. Based on our previous
verification results, the comparisons between the CFD simulation results and experimental
data of mass flux (Nm) and feed pressure drop (Pf) showed good agreement with small
relative errors of ± 5 %. Hence, the model verification shall not be repeated here.
1.2 Computational domain and grid structures
As mentioned previously, the geometric structures of ten single-fiber modules with original
straight and modified fibers were created in this study using the Gambit software. A
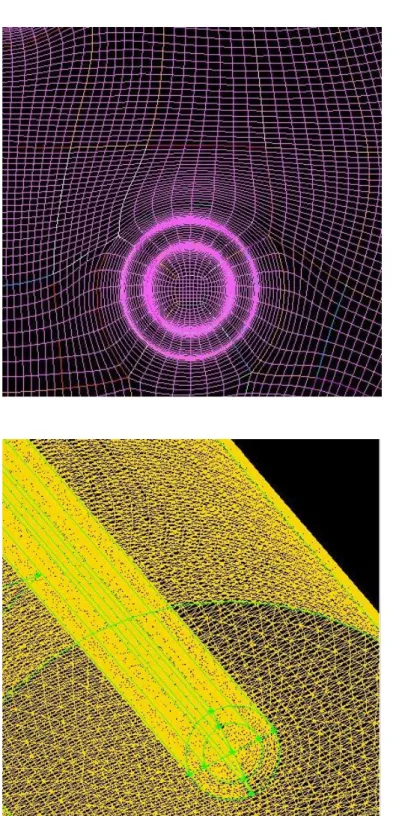
combination of tetrahedral and hexahedral girds was adopted to generate meshes within the
calculating domains for all configurations. The grid number was optimized using the grid
independence tests. In the radial r direction, a grid scale of 5×10⁻⁶ m was chosen for the bulk
permeate and membrane, and progressively increased scales from 5×10⁻⁶ to 2×10⁻⁴ m were set
for the bulk feed (shell-side); while in the axial x direction, a grid scale of 1×10⁻⁴ m was
employed. A local mesh structure of a modul e with straight fibers is shown in Fig. 3. It is
noted that the effect of the hollow fiber membrane surface roughness on the wall boundary
conditions was ignored due to its much smaller scale than that of a mesh element. The
iteration criterion for convergence is 10-5 in Fluent.
1.3 Heat-transfer analysis of MD process
As the influence of the normal mass transferred across the membrane matrix was ignored due
to the negligible amount, the corresponding induced latent heat was treated as a MD
characteristic and coupled into the heat-transfer model during the simulations [41]. The MD
heat transport is often elucidated in three steps, and the overall heat-transfer rate through the
The respective heat-transfer coefficients of the feed hf, the permeate hp and the membrane hm
can be calculated based on the temperature profiles provided by CFD simulations. The main
heat-transfer equations and definitions and equations required for data post-processing are
summarized in Table 3.
In Table 3, the MD coefficient C and solution temperatures (vapor pressure) given in Eq. (5) both contribute to the permeation flux Nm. Based on the prior studies, the C is an intrinsic mass-transfer coefficient of the membrane [43] and is calculated based on a combination of structural parameters (thickness, porosity, pore size and pore size distribution) [42]. Therefore, in the current study a general C value for the selected original straight and wavy designs is determined as 8.0×10⁻⁷ kg·m-2·s-1·Pa-1; while due to the slight variation of thickness, the gear-shaped fiber has a modified value C* of 6.4×10⁻⁷ kg·m-2·s-1·Pa-1 with fixed membrane matrix structure (where C* = (0.6+0.4 (m/m*))C, with the original m = 0.27 mm and
modified m* = 0.52 mm, as shown in Fig. 2(b)). As important MD performance metrics, the
temperature-polarization coefficient (TPC) and hydraulic energy consumption (HEC) can be calculated based on Eqs. (9) and (10), respectively. The TPC characterizes the actual driving force of the system [3]; while the HEC (J·kg-1) and water production (kg·day-1) are used to assess the performance of these microstructured fibers in terms of the pumping electricity cost and water production.
3. Results and discussion
1.4 Optimization of fiber geometric designs in DCMD
Based on an analysis of the controlling heat-transfer resistance in different MD systems,
external hydrodynamic aids can be employed to achieve a significant enhancement when the
heat transfer through the liquid-boundary layers plays a dominant role [42]. Hence, in this
study, a similar DCMD system [highly permeable membrane with membrane coefficient C =
8.0×10⁻⁷ kg·m-2·s-1·Pa-1 and C*(gear) = 6.4×10⁻⁷ kg·m-2·s-1·Pa-1, and relatively low operating
temperatures Tf = 327.15 K, Tp = 293.85 K] was selected to investigate the effectiveness of
hydrodynamic improvement by incorporating modified fibers with various surface
microstructures. To optimize the fiber geometry particularly for MD applications, nine
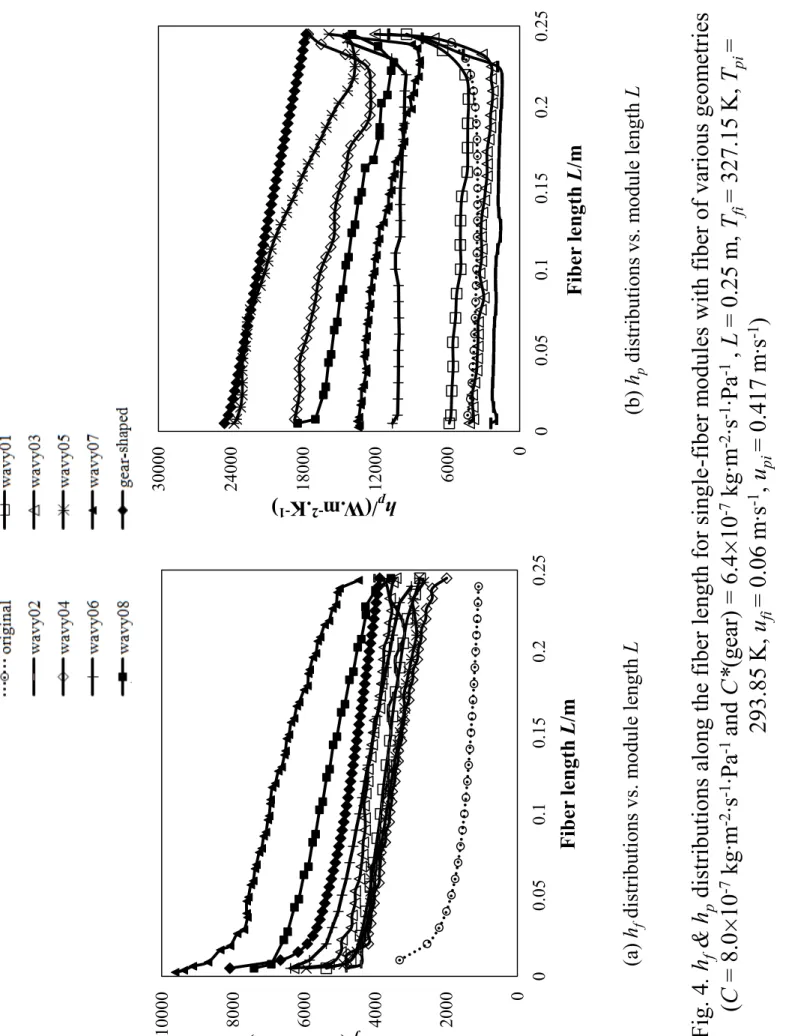
different microstructures listed in Table 1 were simulated, and Fig. 4 shows the distributions
of the simulated heat transfer coefficients at the feed and permeate sides, hf and hp, along the
fiber length L, respectively, for single-fiber modules with the original and nine modified
fibers.
In Fig. 4 (a) the hf distribution curves for all fiber geometries show a general decreasing trend
along the fiber length L. For the original module, the highest hf appears at the entrance of the
feed side and then decreases along the flow direction until reaching a plateau when the flow is
fully developed; while for the rest of the modules, the curves continuously decrease towards
the exits. This is due to the slower build-up of the liquid boundary layer along the feed flow
direction credited to the disturbance by the surface corrugations. Overall, the curves of
modules with microstructured fibers are much higher than that of the original one, which
shows the lowest average hf of 1495 W·m-2·K-1. The configuration with an alternate wavy
design 07 (1.25/1.0 mm, Lx = 1.25 m) shows the highest hf of 6823.9 W·m-2·K-1, which is
mm, Lx = 2.5 m) and the gear-shaped fiber. The simulation results indicate that these new
microstructured geometries have successfully introduced flow disturbance to disrupt the
temperature polarization layer on the membrane surface and hence enhance the heat transfer.
Also, the significant improvement of heat-transfer coefficients by introducing the corrugated
surfaces has confirmed the controlling role of the liquid-boundary layers in this MD system
with a large membrane coefficient C & low operating temperatures. More discussion of the
flow-field distribution associated with intensified local mixing, reduced TP and enhanced
permeation flux is presented in a later section.
In Fig. 4 (b) the curve of the heat-transfer coefficients on the permeate side hp of the original
module shows a similar trend to its hf distribution a continuous decrease appears after
entering the inlet of the permeate side (L = 0.25 m) and then reaches a plateau. The modified
designs wavy 01, 02, 03 and 06 follow the same trend. Surprisingly, wavy 02 (5.0/2.0 mm, b
= 0.5) and 03 (5.0/2.0 mm, b = 0.8) even have lower hp curves than the original fiber. The
possible reason is that the presence of deeper waves (y = 2.0 mm) has created strong
vortices in the valley zones on the permeate side, which caused liquid stagnation. However,
the rest of the designs present an increasing hp trend. It is observed that the gear-shaped
design has the highest average hp of a 5.5-fold increase compared to the original fiber,
followed by a wavy geometry 05. For all the wavy configurations, the significant hp
enhancement is mainly due to the appropriate size of the corrugations that have greatly
improved the hydrodynamic conditions and heat transfer at the permeate side, by increasing
the surface shear-rate of the flow and hence reducing the thickness of liquid boundary layers;
to the better hydrodynamic conditions on the corrugated outer membrane surface (i.e., feed
side), which has much higher wall temperatures and hence a more efficient thermal diffusion
across the thermal boundary layers at both sides.
It should be pointed out that different from the conclusions of our previous work on the
introduction of external turbulence promoters into MD modules [42], the current hp simulation
results showed that microstructured designs on the membrane surface are able to improve the
heat transfer not only at the feed but also at the permeate side.
1.4.2 Temperature-polarization mitigation and flow-filed
visualization
It was observed in Fig. 4 that most of the modules with modified fiber geometries have shown
significant enhancement in heat transfer coefficients hf and hp, which are closely related to the
TP phenomenon—one of the critical barriers in MD practice. Thus, the corresponding results
on TP effect are simulated and shown in Fig. 5, which gives the simulated TPC distributions
along the module length L for all modules.
It can be seen from Fig. 5 that all modules present a similar U shape – the maximum TPC
value occurs at the entrance and the lowest at the midpoint of the module then a slow increase
towards the exit. The reason is that the transmembrane temperature difference (Tfm Tpm) first
feed and the permeate sides: the Tfm continues to decrease along its flow direction (x) and Tpm
first increases and then decreases along -x direction. It is not surprising to see that the modules
with wavy designs 02 and 03 (5.0/2.0 mm, b = 0.5 and 0.8) show even lower TPC curves than
the original straight one, which are consistent with those of the heat-transfer coefficients in
Fig. 4, i.e., the continuous wavy designs 02 and 03 had lower hp curves than the original
straight fiber. The reason responsible for this result may be that a fiber surface with deep and
over-frequent corrugations (waves) might result in intense local secondary flows, which are
possibly trapped between the valleys of two neighboring projections and subsequently
compromise the module performance. Hence, liquid stagnation would instead lead to a lower
heat-transfer efficiency and more severe TP phenomenon.
On the other hand, the alternate wavy designs 07, 08 and gear structured modules present
relatively higher TPC curves, which are also consistent with their high hf and hp distributions
in Fig. 4. Compared to the original design, a TPC increase of 70 % is achieved by the
gear-fiber module. This might be due to the intensified secondary flows induced by
gear-shaped corrugations on the membrane surface that has reduced the thickness of thermal
boundary layer and facilitated the heat transfer. For the alternate wavy designs 07 and 08, the
reason for improvement may include two factors: firstly, these alternate wavy projections with
an appropriate height have increased the surface roughness to create flow eddies and improve
the hydrodynamic conditions on both sides; secondly, the presence of wavy corrugations have
broadened the flow channel at the permeate side, which allows more cooling water to flow
through and achieve better heat exchanging performance. Therefore, the temperature
modified flow channels. As a result, the overall driving force is increased.
To further reveal the fundamentals of the heat-transfer enhancement by employing
microstructured fibers in MD modules, Fig. 6a shows the local flow-field and temperature
distribution in modules with various fiber geometries (within a length range of 0.1050.125 m
with respect to the overall length 0.25 m). The velocity profiles are described by stream traces
and temperature distribution in band colors. These simulation results are consistent with the
trends of the heat-transfer coefficients curves shown in Fig. 4 and TPC distributions in Fig. 5
for these modified designs. Clearly, the intensity of secondary flows induced by the wavy
corrugations increases with increasing wave depth and decreases with increasing the arching
width. Nevertheless, it is shown that a microstructure of deeper and more frequent
corrugations is not necessarily a superior choice for achieving improved module performance.
For example, the wavy design 02 with continuous waves x of 2.5 mm and depth y of 2.0
mm showed a negative effect in terms of TP mitigation; while another lower wavy design 05
with continuous waves (x = 2.5 mm and y = 1.0 mm) performed much better. Interestingly,
the alternative design 08 with less and low waves (x = 2.5 mm, y = 1.0 mm and Lx = 2.5
mm) achieved the best results among these three configurations. However, a further decrease
in the number of turbulence aids might result in insufficient flow disturbance and mixing
instead, which was reported in a prior study [42]. Due to the difficulty in presenting via a
cross-sectional flow field, the flow conditions of the gear-fiber module is analyzed using the
local temperature and pressure contours (slicing planes at x = 0.01, 0.10 and 0.20 m) in band
colors, as shown in Fig. 6b. Compared to the module with an original straight fiber, the
feed side and simultaneously enhances the permeate flow. Hence, the TP effect is greatly
reduced and heat transfer enhanced as indicated in Figs. 4 and 5. Thus, combining the
simulation results shown in Figs. 4 and 5, it is concluded that an appropriate design of the
membrane surface geometry can lead to reduced thermal boundary layers, alleviated TP
phenomenon and hence enhanced heat transfer in a liquid-film controlled MD system.
1.4.3 Enhancement of permeation flux
Fig. 7 gives the distributions of mass fluxes Nm along the fiber length L for modules packed
with fibers of various microstructural designs, under the same operating conditions. It is noted
that Nm is defined based on the outer membrane area of the fiber. For the original module, the
Nm curve has a similar trend as its TPC distribution (shown in Fig. 5), which firstly decreased
and then slightly increased due to the countercurrent build-ups of the thermal boundary layers
on the feed and permeate sides. However, the modules with modified fibers show dramatic
flux increase along the feed flow direction. This is due to the slower flow development and
hence boundary layer buildup along a channel with corrugated surface.
Similar to the TPC results in Fig. 5, few configurations with modified fiber geometries show
negative results compared to the original straight fiber — wavy 02, 03 and 04, which gain
even lower average mass fluxes; while wavy 05 slightly outscores the original configuration.
The highest flux enhancement of 60 % is achieved by the module with gear fibers, followed
modeling results again imply the advantages of a gear-shaped structure and alternate wavy
geometries for achieving better module performance. However, the relatively lower fluxes per
unit area of the continuous wavy designs 0205 do not necessarily result in lower water
production per day, due to the enhanced contact area generated by the corrugated geometry (a
comparison of actual membrane areas As is given in Table 1). Therefore, a fair comparison
will be provided in terms of water production (kg·day-1) in a later section.
1.5 Effect of fiber length for modules with various fiber geometric
designs
Based on the previous discussions of the selected MD system (high C value and low operating
temperatures), an appropriate modification of fiber geometry could greatly enhance the
module performance. Thus, the most promising were selected to further explore their potential
for industrial applications. A series of simulations were conducted to compare the length
effect among single-fiber modules with original straight, wavy 08 and gear-shaped fibers. The
results are shown in Figs. 8 and 9, which depict the effects of module length (L = 0.25, 0.54
and 0.84 m respectively) on the distributions of TPC and Nm along the dimensionless module
length x/L under given operating conditions.
In Fig. 8 all TPC curves for different modules show U shapes with different curvatures.
Regardless of fiber geometries, the average TPC values of these configurations decrease with
show higher TPCs. Overall, the modules with original straight fibers have the lowest curves
among all configurations with the same lengths; while the ones with gear-shaped and wavy 08
fibers show similarly high TPCs. For the module with the original fiber, an increase of length
from 0.25 m to 0.54 m causes 20 % TPC decrease; a further increase of length to 0.84 m
results in an approximate 50 % decrease in the average TPC. Moreover, the shorter module (L
= 0.25 m) presents a rather flat U shape compared to the longer ones with much slower flow
development along the dimensionless length x/L. Yet, the module with a wavy design 08
presents 17 % decrease with a length increase from 0.25 m to 0.54 m and 21 % deterioration
with a further increase to L = 0.84 m. The modules with gear-shaped fibers show a similar
percentage of TPC decrease with increasing fiber length. Apparently, a much slower decrease
with increasing fiber length is observed for modified fibers, due to a slower buildup of
boundary layers at the same location (but a smaller x/L as the module gets longer). Although it
was reported that longer modules tend to be subject to more severe TP effect [9], the
simulated results in Fig. 8 show that fibers with modified geometries are advantageous for
scale-up modules.
Fig. 9 shows the distributions of mass flux Nm for these three fiber geometries (straight, wavy
08 and gear-shaped) along the dimensionless module length x/L. In general, for the same
configuration the local mass flux decreases with increasing module length at the same x/L,
which is consistent with both our previous experimental data and simulation results [38, 44].
This is mainly due to the decrease in the local driving forces and the build-up of thermal
boundary layers as the flow channel length increases. Except for a downward U shape for the
— a slight decrease at the entrance region, where the thinnest boundary layer of the feed side
appears, and then an increase as the transmembrane temperature difference increases with
increasing dimensionless length x/L. This is a result of the counter-current buildup of liquid
boundary layers. Although longer modules with larger membrane areas will result in a higher
water production, an optimized length should be chosen for industrial applications based on
an acceptable magnitude of the local driving force and a more even distribution of Nm.
It is also observed in Fig. 9 that the Nm of the modified designs (wavy and gear-shaped)
increases more significantly along the dimensionless module length x/L than the original
module. This is mainly attributed to the increase of driving force as a result of disruptive
boundary layers by surface corrugation. Overall, the modules with gear-shaped fibers gain the
highest flux enhancement ratios among all configurations with the same length. Interestingly,
compared to original modules, the gear-fiber configuration gains a slight increase of
enhancement from 57 % to 65 % with increasing length from 0.25 m to 0.84 m. Therefore, it
is meaningful to employ a modified fiber geometry like a gear-shaped, which performs more
advantageously when longer modules are desired for a higher water production in industry.
1.6 Effects of flow conditions for modules with different fiber
geometries
As a conventional strategy to improve hydrodynamic conditions in MD systems, an increase
of flow velocity to create turbulence is found to be effective. However, similar to other
hydrodynamic approaches [42], its effectiveness may differ in MD modules of different
configurations. Based on the previous simulation results of geometric optimization, the
gear-shaped design was selected and simulated to investigate the effect of flow conditions
with modified surface geometry. With other operating conditions kept constant, Figs. 10 and
11 show the effects of flow conditions (in terms of Reynolds number, Re) on the TPC and
mass flux Nm distributions for 0.25 m-long modules with single straight and gear fibers,
respectively. In Fig. 10 (a) the average TPC increases with increasing Ref for either
configuration due to the improved fluid dynamics at a higher flow velocity. For the original
module, all TPC distributions for varied feed flow conditions from laminar to turbulence (i.e.,
Ref= 420 – 2500) show a similar U shape—initially decreasing after entering the module and
then slowly increasing towards the exit; while the curves of the gear-fiber modules present a
rather flat trend after leaving the entrance region. It is noted that the Ref for the gear-fiber
module was calculated based on the modified hydraulic diameter characterized by its
gear-shaped surface.
Compared to the gear-fiber configuration, in Fig. 10 (a) the original module generally shows
lower average TPC values and a negligible change with a velocity increase under laminar
flow (Ref 1500). The TPC of the original module only fluctuates within 6 % with Ref
increasing from 420 to 1500; while the turbulence condition (Ref = 2500) brings 30 % TPC
increase compared to that of Ref = 420. The dramatic enhancement is credited to the reduced
conditions. In contrast, the gear-fiber module shows fairly significant changes with the
corresponding Ref adjustment. This is probably because of the ups and downs of the
gear-shaped surface, which could facilitate the occurrence of cross flow and hence enhanced
fluid dynamics even at an extremely low Ref. For instance, the gear-fiber module shows an
encouraging average TPC of 0.7, which is 1.6 times higher than the original configuration, at
the same low Ref of 420.
In Fig. 10 (b) the mass flux Nm increases with increasing Ref for both configurations. Similar
to the TPC distributions, the Nm curves of the original module show a downward U shape
along the fiber length L and have a rather insignificant response to a Ref increase under
laminar conditions (Ref 1500); its Nm distribution presents a dramatic increase along the
feed flow direction once the turbulent condition is reached (Ref = 2500). The maximum flux
increase is up to 50 % compared to that of Ref= 420. On the other hand, the gear-fiber module
shows an initial decrease at the entrance and subsequent increase along the fiber length for
each flow condition. Although a relatively flat curve is obtained at an extremely low Ref of
420, the slope of the Nm curve for the gear-fiber configuration increases significantly with
increasing Ref. This indicates that the flow disturbance induced by the gear microstructure
becomes more intense as the flow develops along the flow channel, especially at a higher flow
3.3.2 Reynolds number of the permeate, Re
pSimilarly, with the Ref kept constant, the permeate flow conditions (Rep) was varied to simulate
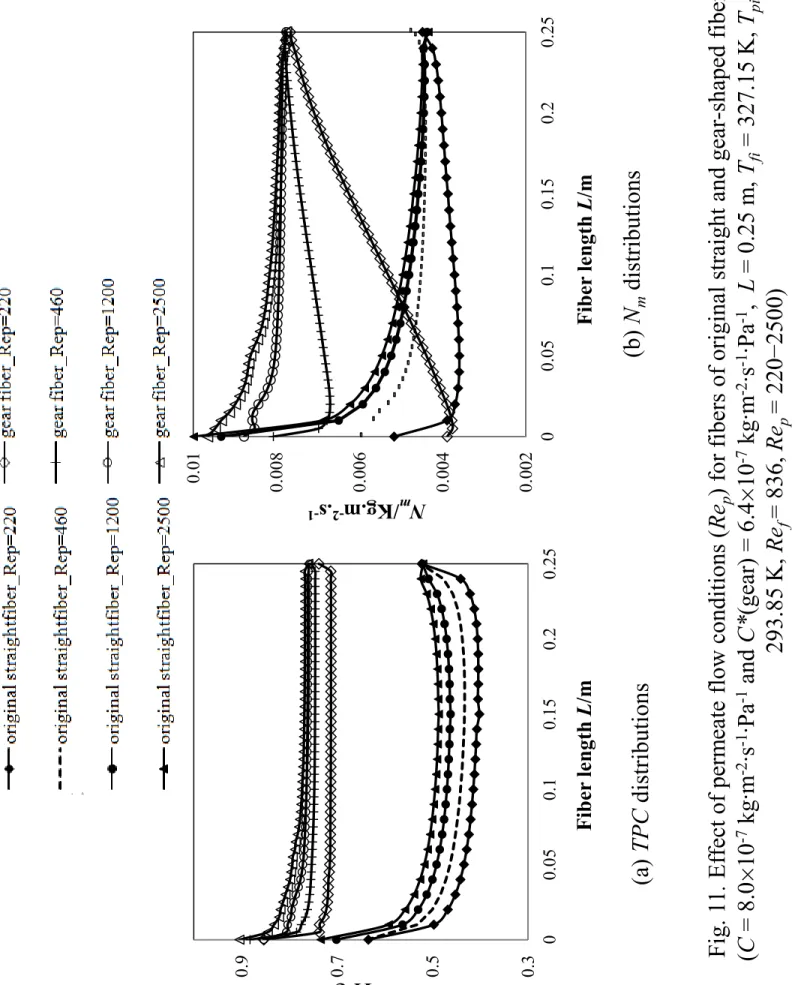
the module performance in terms of TP alleviation and flux enhancement. Fig. 11 presents the
TPC and Nm distributions along the fiber length L for both the original and gear-fiber modules
with increasing Rep from 220 to 2500. Similar to Fig. 10, the original module shows much
lower TPC and Nm curves compared to the modified configuration at the same Rep.
In Fig. 11 (a) the average TPC increases with increasing Rep for both configurations. The
reason is that a change in the heat-exchange rate at a higher Rep leads to a decrease of
permeate bulk temperature and hence a higher transmembrane temperature difference (driving
force) occurs at the same fiber length. However, different from the influence of the feed flow
conditions, a major increase of Rep from laminar to turbulence only brings a modest change in
their respective TPC results—an increase of 19 % occurs for the original module and 10 % for
the gear-fiber one.
Similarly, Fig. 11(b) shows that the average Nm increases with increasing Rep for both
modules. Generally, at a relative higher Rep ( 1500) the Nm curves of both modules show an
increasing trend along the permeate flow direction. This is because of a decrease of flow
temperature on the permeate side, which results in an increasing transmembrane temperature
difference towards the feed inlet (L = 0 m) at under-developed flow conditions. However, at
original module shows a decreasing trend; while the gear-fiber module show a more dramatic
decrease after the permeate flow enters the module. This is probably due to its particular
corrugated gear structure that might regionally retain some liquid at low Rep and hence result
in a reduced local driving force due to a more rapid flow development and buildup of liquid
boundary layer along the permeate flow direction. Nevertheless, compared to the original
module, the gear-fiber module still gains 47 % flux enhancement at such a low Repof 220.
Overall, a change in the flow conditions from laminar (Rep= 220) to turbulence (Rep= 2500)
has brought significant influence on the permeation flux—32.5 % flux enhancement for the
original module and 46 % for the gear-shaped fiber.
However, it should be pointed out that instead of employing high flow velocity to create
turbulence, a major achievement of TP mitigation and flux enhancement could be
accomplished by utilizing fibers with smarter microstructured designs under laminar
conditions.
1.7 Comparison of water production and hydraulic loss for
modules with various fiber geometries
As discussed in the previous sections, an appropriate geometric modification on the
membrane surface (e.g., alternate wavy or geared shapes) would greatly reduce the
through the liquid-boundary layers presents a dominant resistance. To fully evaluate these
fibers of various geometries, two important process metrics—water production (kg·day-1) and
hydraulic energy consumption (HEC) were calculated and compared among various modules
(geometric specifications listed in Table 1), as shown in Fig. 12. Assuming that each ideal
module contains one-hundred pieces of fiber with different geometric designs (i.e., total
membrane area A = 100 As), the configuration with original straight fibers has a HEC of 6.5
J·kg-1 and water production of 46 kg·day-1; while the module with gear fibers shows the
highest water production of 136 kg·day-1 but the lowest HEC of 3.5 J·kg-1, followed by the
alternate wavy designs 01, 07 and 08. Although the continuous wavy designs 02 and 03 also
gain reasonably high water production, they tend to be subject to high hydraulic loss (> 20
J.kg-1). Overall, the gear-fiber module shows the most promising features for achieving
approximately 3-fold water production enhancement with only half of the hydraulic loss,
compared to the original design.
4. Conclusions
In this study a series of CFD simulations were carried out to explore the potential benefits of
employing microstructured hollow fiber membranes used in a DCMD system.
It is found that the module with fibers of gear-shaped structure acheives the highest average
TPC and mass flux Nm values compared to the original straight design, followed by the
improved hydrodynamics caused by intense secondary flows and improved surface renewal
with the presence of corrugations on the membrane surface, which is confirmed by the
observation of the flow-field and temperature profiles from the CFD simulations. The
investigations on fiber-length effect show that the gear-shaped fiber modules provide the
highest flux enhancement ratios with equivalent effective lengths, followed by the modules
with alternate wavy fibers. Interestingly, the advantages of the smart fiber designs are further
amplified for longer modules, which is attractive for scale-up to a higher total water
production in industrial applications.
Investigations of the flow conditions showed that the gear- shaped fiber module has a
promising enhancement at an extremely low Re. Although a flow transition from laminar to
turbulent conditions would bring a significant improvement in a conventional MD module,
introducing a smart microstructured design into the membrane surface would be a
cost-effective option under adverse flow conditions. Also, the computed water production and
hydraulic energy consumption (HEC) of different modules with various fiber geometries have
been compared. The configuration with gear-shaped fibers has the highest water production
but the lowest HEC. In addition, a high water production can be obtained using modules with
wavy fibers, due to their greatly increased membrane area by surface corrugations. However,
these geometries might possibly cause higher HEC. It is hoped that this study can bring a new
perspective on the development of smart membranes for MD applications, and provide a
foundation to guide the fabrication of microstructured hollow fiber membranes with an
Acknowledgments
Support from Siemens Water Technology is gratefully acknowledged. The authors also thank
the Singapore Economic Development Board (EDB) for funding the Singapore Membrane
Nomenclatures
A total membrane area of 100 fibers (m2)
As membrane area of a single fiber (m2)
b shape parameter of the wavy arch on the membrane surface
C membrane distillation coefficient of the membrane (kg·m-2·s-1·Pa-1)
cp specific heat capacity of material (J·kg-1 ·K-1)
di inner diameter of the hollow fiber (mm)
do outer diameter of the hollow fiber (mm)
h local heat-transfer coefficient of fluids and membrane (W·m-2·K-1)
HT latent heat of vaporization of water at temperature T (J·kg-1)
k thermal conductivity (W·m-1·K-1)
Lb dimension of a gear with a square shape (mm)
Lx interval between two corrugated waves on the membrane surface (mm)
Nm transmembrane mass flux (kg·m-2·s-1)
P water vapor pressure (Pa)
Pfluid pressure drop along the module length in the shell side (Pa)
Q heat-transfer rate through the liquid film (W)
q heat flux (W·m-2)
qMD transmembrane latent heat flux (W·m-2)
qHL conductive heat loss (W·m-2)
Re Reynolds number
Rmi, Rmo inner, outer radii of hollow fiber (m)
Sh source term of energy transport equation (J·m-3·s-1),
T temperature (K)
velocity of feed or permeate (m·s-1)
u normalized velocity of feed or permeate (m·s-1)
x, r axial, radial directions in cylindrical coordinate (m)
x cross-sectional dimension of the wavy arch in x direction (mm)
y cross-sectional dimension of the wavy arch in r direction (mm)
Greek letters
interval angle between two neighboring gears on the cross section of the fiber
stress tensor (kg·m-1·s-1)
viscosity (Pa·s) Density (kg·m-3)
m
membrane wall thickness (mm)
r
grid scale in the r direction
Suffix
b bulk average
f Feed
fm feed-side membrane surface
m membrane, or membrane surface
i, o inlet and outlet of fluids
p Permeate
pm permeate-side membrane surface
References
[1] M. S. El-Bourawi, Z. Ding, R. Ma and M. Khayet, A framework for better understanding membrane distillation separation process, Journal of Membrane Science, 285 (1-2) (2006) 4-29
[2] H. Susanto, Towards practical implementations of membrane distillation, Chem. Eng. Process., 50 (2011) 139-150
[3] R. W. Schofield, A. G. Fane and C. J. Fell, Heat and mass transfer in membrane distillation, J. Membr. Sci., (33) (1987) 299-313
[4] K. W. Lawson and D. R. Lloyd, Membrane distillation, J. Membr. Sci., 124 (1) (1997) 1-25
[5] M. Khayet, Membranes and theoretical modeling of membrane distillation: a review, Adv. Colloid Interface Sci., In Press (2011)
[6] A. Chanachai, K. Meksup and R. Jiraratananon, Coating of hydrophobic hollow fiber PVDF membrane with chitosan for protection against wetting and flavor loss in osmotic distillation process, Separation and Purification Technology, 72 (2) (2010) 217-224
[7] M. Su, M. M. Teoh, K. Y. Wang, J. Su and T.-S. Chung, Effect of inner-layer thermal conductivity on flux enhancement of dual-layer hollow fiber membranes in direct contact membrane distillation, J. Membr. Sci., 364 (1-2) (2010) 278-289
[8] J. Zhang, J.-D. Li, M. Duke, Z. Xie and S. Gray, Performance of asymmetric hollow fibre membranes in membrane distillation under various configurations and vacuum enhancement, J. Membr. Sci., 362 (1-2) (2010) 517-528
[9] X. Yang, R. Wang, L. Shi, A. G. Fane and M. Debowski, Performance improvement of PVDF hollow fiber-based membrane distillation process, J. Membr. Sci., 369 (1-2) (2011) 437-447
[10] L. Song, B. Li, K. Sirkar and J. Gilron, Direct contact membrane distillation-based desalination: novel membranes, devices, larger-scale studies, and a model, Ind. Eng. Chem. Res., 46 (8) (2007) 2307-2323
[11] P. Wang, M. M. Teoh and T.-S. Chung, Morphological architecture of dual-layer hollow fiber for membrane distillation with higher desalination performance, Water Research, 45 (17) (2011) 5489-5500
[12] M. Khayet, T. Matsuura and J. I. Mengual, Porous hydrophobic/hydrophilic composite membranes: estimation of the hydrophobic layer thickness, J. Membr. Sci., 266 (2005) 68-79
[14] M. Khayet, T. Matsuura, J. I. Mengual and M. Qtaishat, Design of novel direct contact membrane distillation membranes, Desalination, 192 (1-3) (2006) 105-111
[15] M. Qtaishat, D. Rana, M. Khayet and T. Matsuura, Preparation and characterization of novel hydrophobic/hydrophilic polyetherimide composite membranes for desalination by direct contact membrane distillation, J. Membr. Sci., 327 (1-2) (2009) 264-273
[16] B. Li and K. K. Sirkar, Novel Membrane and Device for Direct Contact Membrane Distillation-Based Desalination Process, Ind. Eng. Chem. Res., 43 (17) (2004) 5300-5309
[17] T. Y. Cath, V. D. Adams and A. E. Childress, Experimental study of desalination using direct contact membrane distillation: a new approach to flux enhancement, J. Membr. Sci., 228 (1) (2004) 5-16
[18] L. Martinez and J. M. Rodriquez-Maroto, Effects of membrane and module design improvements on flux in direct contact membrane distillation, Desalination, 205 (1-3) (2007) 97-103
[19] M. M. Teoh, S. Bonyadi and T.-S. Chung, Investigation of different hollow fiber module designs for flux enhancement in the membrane distillation process, J. Membr. Sci., 311 (1-2) (2008) 371-379
[20] K. W. Lawson and D. R. Lloyd, Membrane distillation. II. Direct contact MD, J. Membr. Sci., 120 (1) (1996) 123-133
[21] R. W. Schofield, A. G. Fane and C. J. D. Fell, The efficient use of energy in membrane distillation, Desalination, 64 (1987) 231-243
[22] L. Martinez-Diez and M. I. Vazquez-Gonzalez, A method to evaluate coefficients affecting flux in membrane distillation, J. Membr. Sci., 173 (2) (2000) 225-234
[23] M. Qtaishat, T. Matsuura, B. Kruczek and M. Khayet, Heat and mass transfer analysis in direct contact membrane distillation, Desalination, 219 (1-3) (2008) 272-292
[24] L. Martinez and J. M. Rodriquez-Maroto, Characterization of membrane distillation modules and analysis of mass flux enhancement by channel spacers, J. Membr. Sci., 274 (1-2) (2006) 123-137
[25] J. Phattaranawik, R. Jiraratananon, A. G. Fane and C. Halim, Mass flux enhancement using spacer filled channels in direct contact membrane distillation, J. Membr. Sci., 187 (1-2) (2001) 193-201
[26] Z. Ding, L. Liu and R. Ma, Study on the effect of flow maldistribution on the performance of the hollow fiber modules used in membrane distillation, J. Membr. Sci., 215 (2003) 11-23
[28] R. Schneider, W. Hölz, R. Wollbeck and S. Ripperger, Membranes and modules for transmembrane distillation, J. Membr. Sci., 39 (1) (1988) 25-42
[29] X. Yang, R. Wang and A. G. Fane, Novel designs for improving the performance of hollow fiber membrane distillation modules, J. Membr. Sci., 384 (1-2) (2011) 52-62
[30] C.J.M. van Rijn, L. Vogelaar, W. Nijdam, J.N. Barsema and M.Wessling, Method of making a product with a micro or nano sized structure and product, WO Patent 0,243,937 (2002)
[31] A. Herczeg, Convoluted surface hollow fiber membranes, US Patent 6,805,730 (2004)
[32] W. Nijdam, J. d. Jong, C. J. M. v. Rijn, T. Visser, L. Versteeg, G. Kapantaidakis, G.-H. Koops and M. Wessling, High performance micro-engineered hollow fiber membranes by smart spinneret design, J. Membr. Sci., (256) (2005) 209-215
[33] P. Z. Çulfaza, E. Rolevink, C. v. Rijn, R. G. H. Lammertink and M. Wessling, Microstructured hollow fibers for ultrafiltration, J. Membr. Sci., (347) (2010) 32-41
[34] P. Z. Çulfaza, M. Wessling and R. G. H. Lammertink, Fouling behavior of microstructured hollow fiber membranes in submerged and aerated filtrations, Water Research, (45) (2011 ) 1865-1871
[35] P. Z. Çulfaza, M. Haddad, M. Wessling and R. G. H. Lammertink, Fouling behavior of microstructured hollow fibers in cross-flow filtrations: Critical flux determination and direct visual observation of particle deposition, J. Membr. Sci., 372 (2011) 210-218
[36] M. Hashino, T. Katagiri, N. Kubota, Y. Ohmukai, T. Maruyama and H. Matsuyama, Effect of surface roughness of hollow fiber membranes with gear-shaped structure on membrane fouling by sodium alginate, J. Membr. Sci., (366) (2011) 389–397
[37] G. A. Fimbres-Weihs and D. E. Wiley, Review of 3D CFD modeling of flow and mass transfer in narrow spacer-filled channels in membrane modules, Chem. Eng. Process., 49 (7) (2010) 759-781
[38] H. Yu, X. Yang, R. Wang and A. G. Fane, Numerical simulation of heat and mass transfer in direct membrane distillation in a hollow fiber module with laminar flow, J. Membr. Sci., 384 (1-2) (2011) 107-116
[39] H. J. Hwang, K. He, S. Gray, J. Zhang and I. S. Moon, Direct contact membrane distillation (DCMD): Experimental study on the commercial PTFE membrane and modeling, J. Membr. Sci., 371 (1-2) 90-98
[40] M. Shakaib, S. M. F. Hasani, I. Ahmed and R. M. Yunus, A CFD study on the effect of spacer orientation on temperature polarization in membrane distillation modules, Desalination, 284 (2012) 332-340
performance enhancement in direct contact membrane distillation, J. Membr. Sci., 405- 406 (2012) 38- 47
[42] X. Yang, H. Yu, R. Wang and A. G. Fane, Analysis on the effect of turbulence promoters in hollow fiber membrane distillation module via computational fluid dynamic (CFD) simulations, J. Membr. Sci., submitted (2012)
[43] R. W. Schofield, A. G. Fane, C. J. D. Fell and R. Macoun, Factors affecting flux in membrane distillation, Desalination, 77 (1990) 279-294
List of Figures
Fig. 1. (a) Schematic of axially-symmetry single fiber modules in CFD simulating domains; (b) local domain amplification of an axially-symmetry wavy single-fiber module in CFD simulations
Fig. 2. 3D geometric structures of modules with (a) wavy fiber; (b) gear-shaped fiber
Fig. 3.Local mesh schemes of a module with the original straight fiber
Fig. 4. hf & hp distributions along the fiber length for single-fiber modules with fiber of various geometries (C = 8.0×10⁻⁷ kg·m-2·s-1·Pa-1 and C*(gear) = 6.4×10⁻⁷ kg·m-2·s-1·Pa-1, L = 0.25m, Tfi = 327.15 K, Tpi = 293.85 K, ufi = 0.06 m·s-1, upi = 0.417 m·s-1)
Fig. 5. TPC distributions along the fiber length for single-fiber modules with fiber of various
geometries (C = 8.0×10⁻⁷ kg·m-2·s-1·Pa-1 and C*(gear) = 6.4×10⁻⁷ kg·m-2·s-1·Pa-1, L = 0.25 m,
Tfi = 327.15 K, Tpi = 293.85 K, ufi = 0.06 m·s-1, upi = 0.417 m·s-1)
Fig. 6. (a) Local flow-field visualization for modules with fibers of various wavy designs; (b) Comparison of local temperature and pressure distributions for single-fiber modules with (i) originalstraight fiber; (ii) gear fiber (C = 8.0×10⁻⁷ kg·m-2·s-1·Pa-1 and C*(gear) = 6.4×10⁻⁷ kg·m-2·s-1·Pa-1, L = 0.25 m, Tfi = 327.15 K, Tpi = 293.85 K, ufi = 0.06 m·s-1, upi = 0.417 m·s-1)
Fig. 7. Mass flux Nm distribution along the fiber length for single-fiber modules with fiber of various geometries (C = 8.0×10⁻⁷ kg·m-2·s-1·Pa-1 and C*(gear) = 6.4×10⁻⁷ kg·m-2·s-1·Pa-1, L = 0.25m, Tfi = 327.15 K, Tpi = 293.85 K, ufi = 0.06 m·s-1, upi = 0.417 m·s-1)
Fig. 9. Effect of fiber length II: mass flux Nm distributions for single-fiber modules with fiber of various geometries (C = 8.0×10⁻⁷ kg·m-2·s-1·Pa-1 and C*(gear) = 6.4×10⁻⁷ kg·m-2·s-1·Pa-1, L
= 0.25, 0.54 and 0.84 m, Tfi = 327.15 K, Tpi = 293.85 K, ufi = 0.06 m·s-1, upi = 0.417 m·s-1)
Fig. 4. Effect of feed flow conditions (Ref) for fibers of single-fiber modules with original straight and gear-shaped fibers (a) TPC distributions; (b) Nm distributions (C = 8.0×10⁻⁷ kg·m-2·s-1·Pa-1 and C*(gear) = 6.4×10⁻⁷ kg·m-2·s-1·Pa-1, L = 0.25 m, Tfi = 327.15 K, Tpi = 293.85 K, Ref = 4202500, Rep = 460)
Fig. 11. Effect of permeate flow conditions (Rep) for fibers of original straight and gear-shaped fibers (C = 8.0×10⁻⁷ kg·m-2·s-1·Pa-1 and C*(gear) = 6.4×10⁻⁷ kg·m-2·s-1·Pa-1, L = 0.25 m, Tfi = 327.15 K, Tpi = 293.85 K, Ref = 836, Rep = 2202500)
Fig. 12.Comparison of water production in multi-fiber modules with various fiber geometries
(each module contains100 fibers, A = 100A
s, C = 8.0×10
-7
kg·m-2·s-1·Pa-1 and C*(gear) =
6.4×10⁻⁷ kg·m-2·s-1·Pa-1, L = 0.25 m, ufi = 0.06 m·s-1, upi = 0.417 m·s-1, Tfi = 327.15 K, Tpi = 293.85 K)
List of Tables
Table 1. Specification of various fiber geometric designs
Table. 2. Summary of CFD mathematical models, boundary conditions and algorithms
Research highlights
¾ Microstructured hollow fibers were designed using CFD modeling for MD
applications.
¾ Analyses of heat and mass transfer and flow field distribution in MD modules were
obtained.
¾ The mass flux of the gear-shaped fiber module showed 66% improvement.
¾ It was attributed to improved hydrodynamics in the flow channels with varied
Fig.
1a.
Schem
ati
c
of axially-symmetry
sin
gle fiber m
odules
in CFD
sim
ul
ating
dom
ains
(i)Or
iginal m
odule
(vii) wavy
06,
alternate
5.0/1.0,
b=0.8
(vi) wavy
05,
2.5/
1.0,
b=0.5
(v) wavy
04,
1.25/1.0
,
b=0.7
(ii) W
avy
01,
5.0/1.0,
b=0.8
(iii) W
avy
02,
2.5/
2.0,
b=0.5
(iv) wavy
03,
2.5/2.0, b=0.8
(ix) wavy
08,
alternate 2.5/
1.0,
b=0.5
(viii)
w
avy
07, alternate,
1.25/1.0
∆y
Lx
2∆x
x
r
She
ll w
all
Fee
d
P
erm
eate
ax
is
Fig. 1b. local
dom
ain
am
plifi
cation
of
an
axially-symmetry
wavy
single
-fiber
m
odule in
CFD
sim
ulat
ions
Rm
i
Fig.
2.
3D
geom
etric
structures
of
m
odules
with
(a)
wavy
fiber; (b) gear-shaped fiber
d
o=1.47 mm
L
b
=0.25 mm
δ
m=0.27 mm
d
i=0.93 mm
α=45˚
(a)
(b)
Cross section
of
origin
al
fi
ber
Cross section
of
gear fiber
Sectional view
of a
m
odule
w
ith a
w
avy
Fig. 3. Local
m
esh
schem
es
of the
3D structure
for a m
odule
with the original
straight
Fig. 4
. h
f&
h
pdistributions
along the fiber length for
single
-fiber
m
odules
with fiber of various geom
etries
(
C
= 8.0
²
10
-7
kg·m
-2
·s
-1·Pa
-1and
C*
(gear) =
6.4
²
10
-7
kg·m
-2
·s
-1·Pa
-1
,
L
= 0.25 m
,
T
fi= 327.15
K,
T
pi=
293.85 K,
u
fi= 0.06 m
·s
-1,
u
pi= 0.417
m
·s
-1)
(b)
h
pdistributions vs.
m
odule
length
L
(a)
h
fdistribu
ti
o
n
s vs.
m
odule
length
L
0
2000
4000
6000
8000
10000
0
0.05 0.1 0.15 0.2 0.25
h
f/(W .m
-2.K
-1)
Fiber
length
L
/m
0
6000
12000
18000
24000
30000
0
0.05 0.1 0.15 0.2 0.25
Fig. 5.
TPC
distributions
along the fiber length for
single
-fiber
m
odules
with fiber of various
geom
etries (
C
=
8.0
²
10
-7
kg·m
-2
·s
-1·Pa
-1
and
C*
(gear) =
6.4
²
10
-7
kg·m
-2
·s
-1·Pa
-1,
T
fi=
327.15
K,
T
pi= 293.85 K,
L
= 0.25 m
,
u
fi= 0.06 m
·s
-1,
u
pi= 0.417
m
·s
-1)
Orig
inal module
0
0.2
0.4
0.6
0.8
1
0
0.05 0.1 0.15 0.2 0.25
(i) wavy
08,
alternate
2.5/ 1.0,
b=0.5
(b) W
avy
01,
5.0/1.0,
b=0.8
(c) W
avy
02,
2.5/
2.0,
b=0.5
(e)
wavy
04, 1.25/1.0
, b=0.7
(f) wavy
05,
2.5/ 1.0,
b=0.5
(h)
wavy
07, alternate,
1.25/1.0
, b=0.7
(d) wavy
03,
2.5/2.0,
b=0.8
(g) wavy
06,
alternate
5.0/1.0,
b=0.8
Fig.
6a.
Local
flow
field visualization
for
m
odules
with fibers of various wavy
designs
(
C
= 8.0
²
10
-7
kg·m
-2
·s
-1·Pa
-1
,
L
= 0.25 m
,
T
fi= 327.15
K,
T
pi= 293.85
K,
u
fi= 0.06
m
·s
-1,
u
pi= 0.417 m
·s
8
Fig. 6b. Com
parison
of local
tem
pera
ture
and pressure
distributions
for single
-fiber
m
odules
with
(i)
original
straight fiber;
(ii) gear
fi
ber
C
= 8.0
²
10
-7
kg·m
-2
·s
-1·Pa
-1
and
C*
(gear) =
6.4
²
10
-7
kg·m
-2
·s
-1·Pa
-1
,
L
= 0.25
m
,
T
fi= 327.15
K,
T
pi= 293.85
K,
u
fi= 0.06 m
·s
-1
,
u
pi= 0.417
m
·s
-1
)
(i)
(ii)
x=0.01
x=0.10
x=0.20
x=0.01
x=0.10
0
0.002
0.004
0.006
0.008
0
0.05 0.1 0.15 0.2 0.25
N
m/Kg.m
-2.s
-1Fiber
length
L
/m
orig
inal stra
ig
ht
wa
vy
01, l=0.5/1mm,
b=0.8
wa
vy
02, l=0.25/2mm,
b=0.5
wa
vy
03, l=0.25/2mm,
b=0.7
wa
vy
04, l=0.125/1mm,
b=0.7
wa
vy
05, l=0.25/1mm,
b=0.5
wa
vy
06,alterna
te l=0.5/1mm,
b=0.8
wa
vy
07, alterna
te
l=0.125/1mm,
b=0.5
wa
vy
08,alterna
te l=0.25/1mm,
b=0.5
g
ear
-shape
d
Fig. 7. Mass
flux
N
mdistributions
along
the fiber
length
for single
-fiber
m
odules
with fiber
of various
geom
etries
(
C
=
8.0
²
10
-7
kg·m
-2
·s
-1·Pa
-1
and
C*
(gear) =
6.4
²
10
-7
kg·m
-2
·s
-1·Pa
-1,
L
=0.25,
0.54 and 0.84
m
,
T
fi=
327.15
K,
T
pi= 293.85
K,
u
fi= 0.06 m
Fig. 8
.
Ef
fect of fiber length I:
TPC
distributions
for single
-fiber
m
odules
with
fiber of various
geom
etries
(
C
= 8.0
²
10
-7
kg·m
-2
·s
-1·Pa
-1
and
C*
(gear) =
6.4
²
10
-7
kg·m
-2
·s
-1·Pa
-1
,
L
= 0.25, 0.54 and 0.84
m
,
T
fi=
327.15 K,
T
pi= 293.85
K,
u
fi= 0.06 m
·s
-1,
u
pi= 0.417
m
·s
-1)
0
0.2
0.4
0.6
0.8
1
0
0.2 0.4 0.6 0.8
Fig. 9
.
Ef
fect of fiber length II:
m
ass
flux
N
mdistributions
for single
-fiber
m
odules
with
fiber of various
geom
etries
C
= 8.0
²
10
-7
kg·m
-2
·s
-1·Pa
-1
and
C*
(gear) =
6.4
²
10
-7
kg·m
-2
·s
-1·Pa
-1