Anthropomorphic Coding of Speech and Audio:
A Model Inversion Approach
Christian Feldbauer
Signal Processing and Speech Communication Laboratory, Graz University of Technology, 8010 Graz, Austria Email:[email protected]
Gernot Kubin
Signal Processing and Speech Communication Laboratory, Graz University of Technology, 8010 Graz, Austria Email:[email protected]
W. Bastiaan Kleijn
Department for Signals, Sensors and Systems, KTH (Royal Institute of Technology), 10044 Stockholm, Sweden Email:[email protected]
Received 14 November 2003; Revised 25 August 2004
Auditory modeling is a well-established methodology that provides insight into human perception and that facilitates the extrac-tion of signal features that are most relevant to the listener. The aim of this paper is to provide a tutorial on perceptual speech and audio coding using an invertible auditory model. In this approach, the audio signal is converted into an auditory representation using an invertible auditory model. The auditory representation is quantized and coded. Upon decoding, it is then transformed back into the acoustic domain. This transformation converts a complex distortion criterion into a simple one, thus facilitating quantization with low complexity. We briefly review past work on auditory models and describe in more detail the components of our invertible model and its inversion procedure, that is, the method to reconstruct the signal from the output of the auditory model. We summarize attempts to use the auditory representation for low-bit-rate coding. Our approach also allows the exploita-tion of the inherent redundancy of the human auditory system for the purpose of multiple descripexploita-tion (joint source-channel) coding.
Keywords and phrases:speech and audio coding, auditory representation, auditory model inversion, auditory synthesis, percep-tual domain coding, multiple description coding.
1. INTRODUCTION
1.1. Motivation
The encoding of an analog signal at a finite rate requires quantization and introduces distortion. Models of the hu-man auditory system can be exploited to minimize, for a given rate (specified either as an average or as a fixed rate), the audible distortion (as quantified by the model) intro-duced by the encoding [1,2, 3]. Signal features will then be specified with a precision that reflects audible distortion. However, the introduction of knowledge of the auditory sys-tem into coding has been handicapped by delay and com-putational constraints. For instance, temporal masking and
This is an open-access article distributed under the Creative Commons Attribution License, which permits unrestricted use, distribution, and reproduction in any medium, provided the original work is properly cited.
the adaptation of the hearing system to a stimulus are highly nonlinear effects [4,5]. A time-localized quantization error in the perceived signal can result in a significant change in the auditory nerve firings over a response time interval that can last on the order of hundreds of milliseconds. Therefore, the effect of time-localized quantization errors that are hun-dreds of milliseconds apart cannot be separated into additive terms. As a result, it is difficult to include such dependencies of quantization errors during the quantization process.
transforms commonly used in audio coding [6]. These trans-forms allow a spectrally weighted mean-square error distor-tion measure to be approximated as a single-letter criterion. For wide-sense stationary signals, the results of the DCT are asymptotically equivalent to the results of the Karhunen-Lo`eve transform, thus performing an approximate decorre-lation of the data. Finally, scalar quantization is used to have low complexity.
Our objective is to use sophisticated auditory-model-based distortion criteria without the significant approxima-tions commonly used (such as simple error-weighting fil-ters in linear-prediction-based speech coders or the exclusive consideration of frequency-domain masking in many audio coders).
Most quantitative models of the human auditory percep-tion provide an auditory representapercep-tion of the acoustic sig-nal as output. However, the models generally do not include a quantitative measure of the perceptual distance of two real-izations of the auditory representation. In [7], a correlation measure of the internal representations was proposed as an objective distortion measure. Such a measure is closely re-lated to a single-letter weighted squared-error measure. We will assume that a single-letter distortion criterion on the au-ditory representation can provide a high-quality distortion measure.
The usage of sophisticated distortion criteria within the existing coding architectures leads to so-called delayed-decision coding. Delayed-delayed-decision coding methods have been used in the context of a squared-error criterion and linear-prediction-based waveform coding (e.g., [8]). In the delayed-decision approach, the quantization of a signal block is decided only after consideration of the quantization of a certain number of future blocks. Even when using pruning procedures that eliminate the consideration of unlikely con-figurations, this method becomes computationally very ex-pensive for distortion measures that have the long time re-sponses associated with hearing models [9]. This motivates the consideration of less conventional coding architectures.
The coding approach we presented in [10], which is the basis throughout this paper, avoids the high computational complexity of the delayed-decision approach by exploiting the single-letter nature of the criterion in the auditory rep-resentation. The signal is transformed to the auditory do-main and coded in that dodo-main. The decoding is followed by a transform back towards the acoustic domain. The trans-form from the acoustic to the auditory domain can be many-to-one, making the inverse transform in general nonunique. This auditory-domain approach towards coding allows the usage of a single-letter distortion criterion and yet accounts for the dependency of perceived distortion on errors in the signal that are far apart in time.
It is important to note that virtually all state-of-the-art speech and audio coding methods operate on a block-by-block basis (e.g., [1,2,6,8]). For subband/transform coding for example, decimated filterbanks or lapped transforms are used, which introduce block boundaries at regular time po-sitions (often even independent of the actual audio signal). Such a signal representation allows only a suboptimal
quan-tization (in the sense of rate versus distortion) since a signal is generally not stationary within a block and audible artefacts such as pre-echoes or musical noise can occur [1,3].
In our coding approach, we use a block-free signal rep-resentation and utilize a signal-adaptive decimation (i.e., subsampling) method, thus bypassing the suboptimality of block-based and constantly decimated processing. Further-more, since our approach combines the signal representation used for the quantization with the perceptual measure, we no longer need two separate signal paths with different sig-nal representations as common in many existing coders (e.g., the MPEG audio coders in [1]).
Finally, we note that the parameters making up the au-ditory representation generally are not independent. That is, coding of the auditory representation removes compu-tational complexity associated with the distortion criterion, but it does not eliminate the need for signal modeling or other additional considerations to reduce the amount of data. InSection 4.1and beyond, we will discuss methods that deal with this redundancy in an efficient manner.
In the next subsection, we review our auditory model, which can be inverted very efficiently to allow auditory resyn-thesis at high quality so that it can be used for robust coding of speech and audio signals.
1.2. An invertible auditory model
In [10] a speech coding paradigm was introduced in which the coding is performed in a perceptual domain where a sim-ple distortion criterion (e.g., a single-letter squared error) should form an accurate and meaningful measure for the perceived distortion. In other words, the speech or audio sig-nal is transformed into an auditory representation by passing it through an auditory model. This auditory representation is quantized and coded and the signal can be reconstructed in the decoder by an inverse auditory model.
This approach is new and different from the one used in classical perceptual audio or speech coders where an audi-tory model is used only in the analysis stage in parallel with the main signal path to control the quantization and bit allo-cation [1].
The proposed paradigm requires a model of the human auditory system that satisfies the following requirements:
(1) it provides an accurate quantitative description of per-ception;
(2) it leads to an auditory signal representation with rel-atively few parameters (to have a good basis for data compression);
(3) it can be inverted with a relatively low computational effort.
An invertible auditory model that satisfies these require-ments was proposed in [10]. It is depicted inFigure 1.
Gammatone filterbank Synthesis filterbank Input
signal
Half-wave rectification
Power-law compression
Peak picking
Amplitude correction Power-law expansion
Quantization and coding Decoding Transmission/storage
· · · · · · · · · · · · Reconstructed
signal Basilar
membrane (BM)
Inner hair cells
(IHCs)
Neuron ensembles
Figure1: Invertible auditory model.
filters with different center frequencies. Note that in a human cochlea, about 2 500 inner hair cells [11] are located along the basilar membrane and, therefore, this is the actual number of bandpass channels. One reason for this high redundancy is to be robust against damages such as loss of hair cells. But this also means that neighboring auditory filters would look rather similar and, hence, for modeling purposes or coding applications, it is not necessary (and hardly possible) to im-plement such a high number of cochlea channels. For the invertible model in [10], the well-known gammatone filter-bank with 20 channels for 8 kHz-sampled speech is used.
In each auditory channel, the analysis filterbank is fol-lowed by a model of an inner hair cell. The task of the inner hair cells is to convert the displacement of the basilar mem-brane in electrical receptor potentials. These receptor poten-tials cause a release of neurotransmitters and excite the pe-ripheral terminals of cochlear-afferent neurons [12,13]. In our model, this transduction process is reproduced in a very simplified way using static nonlinearities only, namely, a half-wave rectifier and a compressive nonlinearity.
The final stage in our invertible model mimics the be-havior of an ensemble of cochlear-afferent neurons in each auditory channel. According to the excitation by neurotrans-mitters, these neurons produce action potentials (“firing pulses”) caused by depolarization of an auditory nerve fiber. We model this generation of pulses using a peak-picking pro-cedure. The set of firing-pulse trains obtained from all au-ditory channels is referred to as the auau-ditory representation which is a perceptual time-frequency representation of the original speech or audio signal.
In the next section, we will describe the components of our auditory model in more detail. We cover the basi-lar membrane, inner hair cells, and first neural stages, that is, we model the cochlea and the auditory nerve in the human inner ear but skip the outer and the middle ear. We deal with filterbanks whose characteristics are matched
to the acoustical and mechanical behavior of the cochlea and basilar membrane. One of these characteristics is that the spectral resolution decreases with increasing frequency. Therefore, warped frequency scales have been introduced long ago where selectivity bandwidths remain approximately constant along the frequency axis (auditory scales), for ex-ample, the Bark (critical-band rate) scale [14] or the ERB (equivalent rectangular bandwidth) rate scale [15]. We give a survey of auditory scales and auditory filters. The emphasis is placed on invertibility so as to allow reconstruction of the input signal. This enables the filterbank pair—analysis and synthesis filterbank—to be used for auditory subband coders or to be used in an invertible auditory model. Furthermore, we will consider important aspects for the implementation of the auditory filterbank, which is the most complex com-ponent in our model.
In Section 3 we describe the computationally efficient, nonrecursive inversion procedure of our auditory model which allows to reconstruct the input signal at a high quality from the auditory representation. We investigate our analy-sis/synthesis system using frame theory, which provides us with a bound for the reconstruction error.
Section 4.1deals with the compression and quantization of the auditory representation obtained by our model and summarizes the first approaches towards low-bit-rate cod-ing.
Since the auditory representation is highly overcomplete and does not rely on a hierarchical signal decomposition, it can be used directly for multiple description coding. We re-view the incorporation of our auditory model into this joint source-channel coding strategy inSection 4.2.
2. AUDITORY ANALYSIS
We selected the components of the proposed auditory model based on existing knowledge of the human auditory system. In this section, we provide additional detail for the motiva-tion of our choices.
2.1. Basilar membrane filterbank
The filterbank to simulate the behavior of the basilar mem-brane is the most complex component in our model. After providing an overview of auditory filters, we consider diff er-ent aspects for the implemer-entation of an auditory filterbank.
2.1.1. Brief overview
The frequency selectivity of the human auditory system has been studied by means of psychoacoustic experiments and measurements in the cochlea and on the auditory nerve over many decades. The results of these experiments have led to the concept of auditory filters. For a historical overview, we refer to [16].
1
0.8
0.6
0.4
0.2
0
0 1000 2000 3000 4000
Frequency (Hz)
N
o
rmaliz
ed
war
p
ed
fr
eq
ue
ncy
Basilar membrane position ERB rate
Bark scale Frequency warping
Figure2: Comparison of the frequency-position mapping [17], the ERB rate [15], the Bark scale [50], and the frequency warping (see
Appendix A.2) withλ=0.5 for a sampling rate of 8 kHz.
bandwidth). For instance, the equivalent rectangular band-width ERB(fc) as a function of the filter’s center frequency fc in Hz is [15]
ERB(fc)=0.1079fc+ 24.7, (1)
and the corresponding frequency scale, the ERB rate (or “number of ERBs”), is then
# ERBs(f)=
df
ERB(f)+ const
=21.4 log10(1 + 0.00437f),
(2)
where the integration constant has been chosen to make # ERBs(0)=0.
Auditory frequency scales are related to the frequency-position mapping performed by the cochlea. In Figure 2, the ERB rate and the Bark [14] scales are compared with a position-frequency function which has been derived by Greenwood [17] from measurements of the mechanical mo-tion of the basilar membrane. For more details, see [18]. In this comparison, the scales are normalized. At the maximum presented frequency of 4000 Hz, the basilar membrane po-sition is 23.4 mm, the ERB rate reaches 27.1 ERBs, and the Bark scale has 18 Bark.
The shape of the auditory filters has been obtained by fit-ting different parametric expressions to experimental data. A simple linear frequency-domain description of auditory fil-ters is the rounded exponential “roex(p,r)” function [19]
H(f)2=(1−r)(1 +pg)e−pg+r, (3)
H0(z) · · · G0(z)
· · ·
· · ·
. . . H1(z) G1(z)
HL−1(z) GL−1(z)
+
+ y[n] x[n]
Figure3: Analysis and synthesis filterbanks.
where g is the normalized deviation from the center fre-quency fc:
g=f −fc fc .
(4)
The parameter p determines the bandwidth and should be chosen asp=4fc/ERB(fc). The second parameterrflattens the shape outside the passband.
A more recent, time-domain description is the well-known gammatone function [20] for the filter impulse re-sponse
h(t)=t(l−1)e−2πbtcos(2π f
ct) fort >0, (5)
where fc is the frequency of the carrier and, therefore, the center frequency of the filter,blargely determines the band-width, and l is the order. Patterson [20] determined the choicel=4 andb=1.019 ERB(fc). For our simulations, we will use gammatone filters since the time-domain description allows straightforward FIR filter design. We will discuss this issue in more detail in the next subsection.
Several nonlinear effects have been described such as the dependency on the sound pressure level [21] which causes more asymmetric shapes of the frequency responses. For this reason, both filter descriptions have been extended [15,22] to account for this dependency. For simplicity, particularly with respect to invertibility, we will only consider linear fil-ters for which the above descriptions are valid for moderate sound pressure levels.
2.1.2. Implementation aspects
An implementation of an auditory filterbank consists of many auditory filters with different center frequencies in par-allel. For coding applications, we should be able to recon-struct the input signal from the channel signals and the filter bank should be invertible. We denote the analysis filters as
Hk(z) fork=0,. . .,L−1 and the synthesis filters asGk(z) for
1
0.5
0
−0.5
−1
10 20 30 40 50 60 70 80
Time (ms)
A
m
plitude
fc=80 Hz
fc=200 Hz
fc=500 Hz
Figure 4: Impulse response and impulse response envelopes of gammatone filters for different center frequencies.
A commonly used method to compute the proper center frequencies for the filters is to transform the minimum and the maximum center frequency of interest from Hz into ERB rate. This range is divided intoL−1 uniform sections and the obtained ERB rates are finally transformed back into Hz. The discrete-time impulse responses of the gammatone filters can be designed by sampling and windowing the continuous-time infinite-length impulse responses of (5). A problem with direct usage of these impulse responses for FIR implementations is that the impulse responses are very long. InFigure 4, a gammatone impulse response for a center fre-quency of 500 Hz is plotted. Its envelope is shown as well and compared with the envelopes obtained for center frequen-cies of 200 and 80 Hz. As it can be seen from this figure, an impulse response with about 400 samples is needed at a sampling rate of 8 kHz for a center frequency fc = 200 Hz to approximate accurately the frequency response of an ideal gammatone filter. For lower center frequencies, the length in-creases further (e.g., 600 samples for fc=80 Hz). Therefore, the corresponding FIR implementations are computationally expensive and memory consuming.
In the appendix, we discuss alternative implementa-tion methods, which are computaimplementa-tionally less expensive and should, therefore, be preferred when real-time applications running on a DSP are considered. However, for the experi-ments and simulations described in the following sections, we use FIR gammatone filters because computational com-plexity was not an issue.
2.2. Inner-hair-cell model
The auditory filterbank is followed by a half-wave rectifier and a power-law compressor, simulating the behavior of in-ner hair cells. The task of the inin-ner hair cells is the so-called transduction process, that is, to convert mechanical
movements into electrical potentials. It is assumed that the displacement of the cilia of the cells is proportional to the basilar membrane velocity [21]. Measurements of electrical responses have revealed a directional sensitivity: while dis-placement in one direction is excitatory, movement in the opposite direction is inhibitory [21]. Thus, the cells mainly react to positive deflection of the basilar membrane and, con-sequently, it is reasonable to model this behavior with a half-wave rectifier. Half-half-wave rectification is commonly used to model this aspect of physiology, for example, [4,23,24].
The aforementioned measurements also show a com-pressive response [21]. Therefore, we apply a power-law compressor to the half-wave rectified signals. The inputx[n] and the outputy[n] of the compression stage are related by
y[n]=xc[n], (6)
withc=0.4. This stage is similar to logarithmic amplitude compression schemes in ordinary waveform coders (e.g.,µ -law).
The static nonlinearity is a strongly simplified model of the human peripheral processing. In related literature, more sophisticated compression or adaptation stages have been proposed. In [4], a cascade of five feedback loops with dif-ferent time constants is used. The cascade compresses sta-tionary sounds almost logarithmically whereas rapidly vary-ing signals are transformed more linearly, thus modelvary-ing the “overshoot effect,” that is, a higher sensitivity at the onset of a stimulus. Other examples can be found in [23,24] where au-tomatic gain controllers model the synaptic region between the hair cell and the nerve fiber. In our first implementation of an invertible model, we use the simple half-wave rectifier and power-law compressor to avoid stability problems when inverting the gain control loops.
2.3. Neuron model
Contrary to many other auditory models (e.g., [4,23,24]), we preserve the temporal fine structure of the signal, that is, we do not apply time averaging to the subband signals be-cause this would lead to a low reconstruction quality. In our model the power-law compressor is followed by an adaptive subsampling mechanism (“peak picking”), which searches for local maxima and sets all other samples to zero. Let the input and the output of the peak-picking stage be denoted byx[n] andy[n], respectively, then the output can be calcu-lated as
y[n]=
x[n], x[n]> x[n−1]∧x[n]> x[n+ 1],
0, otherwise. (7)
This model simulates the firing behavior of an ensemble of auditory neurons. The responses are clusters of high firing activity that are synchronized (phase-locked) with the wave-form shape of the input signal.
3600 2833 2220 1730 1338 1024 773 573 412 284
400 405 410 415 420 425 430
Time (ms)
Channe
l
cent
er
fr
equency
(Hz)
Figure5: Auditory representation (here with 50 channels) of the sound [I] taken from “there is,” spoken by a male. Peaks are shown as rectangles with their intensity representing their amplitude. The time axis covers three pitch periods.
high-frequency components. Since in the early human audi-tory system, about 30 000 neurons [11] encode the signals of significantly less hair cells, we can associate several neurons with one hair cell output. Our model of the neurons is phys-iologically plausible. Each neuron has an internal state that decays exponentially with a relatively large time constant. When it fires, this state is reset to a value that depends on the input signal level. The firing probability increases mono-tonically with the difference between the neuron’s input and its state. So an ensemble of neurons shows a high firing rate at the peak of the input signal. The amplitude of a pulse in our model represents the firing rate, that is, the number of neurons of the ensemble that fire at the peak location.
The effect of phase locking is known to occur only at fre-quencies below 4 kHz [12,13]. So the used model is physio-logically plausible for the coding of narrowband speech sig-nals. For simplicity, we use this neuron model even if we pro-cess signals at higher sampling rate, for example, wideband speech or general audio signals.
The consideration of pulsed neural models where infor-mation is carried in the pulse timings is clearly motivated by observations of biological neural networks. In [25] it is well demonstrated that these models should be preferred to clas-sical neuron models such as firing-rate models or even more simplified ones for many applications of artificial neural net-works.
InFigure 5, a pulse representation of a segment of about 30 milliseconds duration taken from a voiced speech is shown. For this example, a 50-channel FIR gammatone anal-ysis filter bank was used. The neuron firings are not strictly aligned across the frequency channels due to different delays of the filters. Nevertheless, the phase-locking effect can be seen clearly. Also the formant structure is visible with for-mants around 400 Hz, 1700 Hz, and 2800 Hz.
Weintraub [26] used a similar deterministic model for neural firing in his sound separation system. There is also similarity to Patterson’s pulse ribbon model [27] but we preserve the amplitudes of the pulses in addition to the lo-cations. Contrary to [26,27], we are able to resynthesize the
original audio signal directly from this neural firing pulses whereas Weintraub uses the (unprocessed) signals from the auditory filterbank for the resynthesis [28] and Patterson does not resynthesize at all.
3. AUDITORY SYNTHESIS
The attempts of resynthesis of the input signal from an audi-tory representation are not new. In [29] a historical overview is given. The aim of various model inversions was to un-derstand perception [30,31,32], to test the accuracy of the model [33, 34], and to separate speech from noisy back-grounds or interfering speakers [26,28,32]. We propose to use an invertible auditory model for coding of speech and audio signals [10,35].
For the most recent models, the inversion method is based on projections onto convex sets [32,34] and utilizes iterative signal reconstruction algorithms. The resynthesis of our auditory model does not need iterative procedures and is, therefore, computationally very efficient and nevertheless perceptually accurate.
3.1. Inversion of neuron and inner-hair-cell models
The first step in the inversion procedure is to undo the power-law compression using the proper inverse expansion to get the positive peak amplitudes of the original subband signal:
y[n]=x1/c[n]. (8)
Now, each of the channel signals approximates the situation where a signal is downsampled and then upsampled by means of inserting zeros. This insertion of zeros leads to aliasing which can be removed by bandpass filtering. The bandpass filters are located in the synthesis filterbank. Before they are applied, the amplitude of the pulses has to be corrected to compensate for the loss of energy due to (i) the adaptive downsampling and (ii) the peak amplitude errors at higher frequencies introduced by the finite sampling rate.
We consider one auditory channel. The output of one channel of the analysis filterbank resembles a sinusoid with a period of P samples that is related (but not identical) to the inverse of the center frequency of the filter. Then the peak-picking procedure behaves like a cascade of an or-dinary downsampler and upsampler with a fixed decima-tion/interpolation factorP for which the Fourier transform relation is
Yejθ= 1 P
P−1
k=0
Xej(θ−k2π/P). (9)
The cosine signal with amplitude 1 and angular frequency 2π/Pwith Fourier transform
Xejθ=π δ2π θ− 2π
P
+δ2π θ+ 2π
P
(10)
is transformed into the pulse train with Fourier transform
Yejθ= 2π P
P−1
k=0
δ2π θ−k 2π P
whereδ2π(θ) is the 2π-periodic delta distribution. All addi-tional frequency components have to be attenuated by the synthesis filter and the remaining components yield the co-sine signal with amplitude 2/P. Therefore, the amplitude in this channel has to be corrected by a factor of P/2. This method is very simple and contributes substantially to good resynthesis results. Another slightly more elaborate correc-tion method is to count the actual number of zeros between adjacent pulses which replaces the constant correction factor with an adaptive one.
For the second correction step, we observe that the mea-surement of the peak amplitude is exact in continuous time only. In discrete time, errors due to the finite sampling in-terval are inevitable. These errors become significant in par-ticular for those auditory channels whose center frequencies are close to half the sampling frequency. To compensate for these errors, a method based on the assumption of a uni-formly distributed random sampling error was proposed in [10]. The method evaluates the average per-cycle maximum amplitude of a sampled sinusoid,α, which, for the case of a unity amplitude sine wave and a unity sampling period, is given by
α=
1/2
−1/2cos
2πt P
dt= P
πsin π P
. (12)
Thus, the correction factor due to the finite sampling rate for this channel is 1/α.
An improved correction factor was introduced in [35] which is based on least-squares optimization. For a sinu-soidal signal with amplitude A and period P, we observe the maximum samplewmax = Acos(2πt/P) withtuniform
over [−1/2, 1/2]. The nonlinear least-squares estimate for the amplitude Ain terms of the observation wmax is given by
A=E{A|wmax} =β·wmaxwith
β=
1/2
−1/2
1
cos(2πt/P)dt=
P πln
tan π
4 +
π
2P
. (13)
InFigure 6, these two compensation methods are compared. For a white-noise input signal, the power spectral density function of the output signal is plotted for the cases of no peak picking and therefore no correction (“nondecimated case”), peak picking with correction by 1/α, with correction by β, and peak picking without correction. We recognize that the correction factorβaccording to (13) keeps the re-construction error less than 1 dB across the entire frequency range covered by the auditory filterbank.
3.2. Synthesis filterbank
The last stage is the synthesis filter bank, which should be an inverse of the analysis filterbank. For proper signal re-construction from a firing-pulse representation, it is essen-tial that the synthesis filters have bandpass characteristics to eliminate aliasing. This also keeps the introduced quantiza-tion noise within a local frequency range.
2 0 −2 −4 −6 −8 −10
0 1000 2000 3000 4000
Frequency (Hz)
Po
w
er
sp
ec
tr
al
d
en
si
ty
(d
B
)
Nondecimated β
1/α None
Figure6: Comparison of reconstruction quality with different am-plitude correction methods for the peak amam-plitude sampling errors (output PSD for white input).
In general, the inverse operator for a nondecimated, in-vertible filterbank is not unique. A natural method of inver-sion of a nondecimated FIR filterbank is based on the follow-ing condition for perfect reconstruction:1
Gk(z)= Hk
z−1
L−1 i=0 Hi(z)Hi
z−1. (14)
For the case that Li=0−1Hi(z)Hi(z−1) = 1, the synthesis fil-terbank is the analysis filfil-terbank with time-reversed impulse responses. A delay equal to the length of the analysis filters minus one is needed to make the synthesis filterbank causal. In the general case, when the denominator of (14) is not equal to one (e.g., when a low number of auditory channels is used), accurate signal reconstruction can be obtained with an additional linear-phase equalization filter (see [10]) that operates on the sum of all channels synthesized withGk(z)=
Hk(z−1). This equalizer has to be designed to approximate the frequency response
Eejθ=!
k
Hk
ejθ2
−1
(15)
to reduce the remaining magnitude ripple.
The ripple decreases with increasing order of the FIR equalizer. However, an additional delay of half the filter order is introduced. Thus, for the choice of the impulse response length, a suitable compromise must be found. The minimum
1Here, perfect reconstruction refers to processing of the input signal by
0.2 0 −0.2
260 270 280 290 300
Time (ms)
Or
ig
inal
0.2 0 −0.2
260 270 280 290 300
Time (ms)
Re
co
n
st
ru
ct
io
n
0.02 0 −0.02
260 270 280 290 300
Time (ms)
Er
ro
r
Figure7: Comparison of the original waveform (upper plot), the waveform reconstructed from the auditory representation (middle plot), and the reconstruction error (lower plot, note the finer am-plitude scale). Speech segment taken from “Thesource,” spoken by a male speaker.
delay solution without equalization has often been used [32]. We found that, for 20 channels and for a sampling rate of 8 kHz, this results in a 4 dB ripple. The ripple decreases with a further increase of the number of channels.
As already mentioned for the analysis filters, FIR gamma-tone filters are memory consuming. Although the synthesis filters can use the same coefficients as used for the analysis fil-ters, separate ring buffers are needed for every auditory chan-nel in the synthesis filterbank. Consequently, the necessary amount of memory is doubled. For an accurate FIR gamma-tone filterbank implementation with long impulse responses, the memory of the most currently used DSPs is not suffi -cient. One solution to this problem is to take shorter impulse responses and accept deviations from the ideal frequency re-sponses. Another possibility is to consider alternative filter-bank implementations as described in the appendix.
3.3. Simulation results
InFigure 7, a segment of the original waveform with 8 kHz sampling rate is compared with the output of our inverse auditory model with 20 channels. For this simulation, the FIR gammatone filterbank from Irino’s Matlab toolbox2was
used where the lowest center frequency was 100 Hz (order of filter 666) and the highest 3600 Hz (order 56). The audi-tory representation has been left uncompressed. The output of the synthesis filterbank has been passed through a linear-phase equalizer with a group delay of 25 milliseconds.
Al-2This toolbox can be found athttp://www.mrc-cbu.cam.ac.uk/cnbh/
aimmanual/.
though the average segmental signal-to-noise ratio (SNR) is only 17.9 dB, the reconstructed signal is without audi-ble distortion (evaluated by two experienced listeners in an original/reconstructed-comparison listening test).
3.4. Frame-theoretic interpretation
of auditory synthesis
It is useful to consider the auditory resynthesis from the per-spective of frame theory. This endorses our choice of synthe-sis filterbank and provides a bound for the reconstruction er-ror introduced by the analysis/synthesis filterbank pair. Fur-thermore, it justifies our simple method to reconstruct the signal from the pulse representation and allows us to reduce the number of pulses in the auditory representation.
In practical implementations of the filterbank structure, the analysis and synthesis filterbanks are identical, except for a time reversal of the impulse responses. We first evaluate the validity and implications of this choice. The analysis filter-bank maps the input sequence3to a set of channel sequences,
one for each filter. It is essential that the analysis filterbank is invertible and that means it can be interpreted as a frame operator, which we denote asF. The analysis filterbank op-eration can be written as a set of inner products, denoted as (Fx)[j]=iψ∗j[i]x[i], with functions{ψj}j∈Jwhere each is a translate of one of theLtime-reversed impulse responses. The indexes jenumerate each output sample of allL chan-nels. Invertibility of the filterbank is guaranteed if the frame condition is satisfied:
A
i∈Z
x[i]2≤
j∈J
(Fx)[j]2≤B
i∈Z
x[i]2 ∀x∈2(Z),
(16)
whereAandBare finite, positive, scalar frame bounds. The adjoint operatorF∗maps anL-channel signal,y, to a single-channel signalF∗y=j∈J yjψj.
In general, the inverse frame operator (the synthesis fil-terbank) is not unique. We are interested in an inverse that is easy to compute, and, importantly, that minimizes the effect of quantization errors in (Fx)[j] on the reconstruction. The so-called frame algorithm is an iterative procedure that pro-vides the inverse frame operator that minimizes the effect of quantization errors. The first iteration often provides a useful approximation to the inverse or even the exact inverse. The estimatexmofxat iterationmof the frame algorithm is
xm=ρF∗y+
Id−ρF∗Fxm−1, (17)
whereρis a scalar relaxation parameter, Id is the identity op-erator, andx0=0. The estimation error at iterationmis then
x−xm=
Id−ρF∗Fx−xm−1=Id−ρF∗Fmx. (18)
With the optimal selection ρ = 2/(B+A), the error is bounded by
x−xm=min
ρ Id−ρF ∗Fm
x
≤min ρ max
|1−ρA|,|1−ρB|mx
= B−A B+A
m
x.
(19)
The valuesAandBform the minimum and maximum eigen-values of the operator F∗F, which are precisely the frame bounds.
The first-iteration estimate ofxby the frame algorithm is the expansionρF∗y=ρj∈Jyjψj, which implies thatρF∗ is the approximation to the inverse operator. It is easily seen that this corresponds to a synthesis filterbank with impulse responses that are the time-reversed impulse responses of the analysis filterbank, scaled byρ. Moreover, we see from (19) that the relative error is bound by the factor (B−A)/(B+A).4
For a nondecimated filterbank, the discrete-time Fourier transform (which is unitary) simplifies the analysis of the op-eratorF∗F. In the Fourier domain, the operatorF∗F corre-sponds to the operator [36]
FF∗FF−1=
L−1
i=0 Hi
ejθHi
e−jθ, (20)
whereF denotes the discrete-time Fourier transform opera-tor. This immediately leads to the inversion formula given in (14). The same Fourier-domain equivalence shows that the frame bounds then correspond to the essential infimum and supremum ofLi=0−1Hi(ejθ)Hi(e−jθ).
We can now draw some conclusions for our auditory fil-terbanks based on the frame-theoretical viewpoint. First, the synthesis filterbank based on time-reversing the impulse re-sponses is an approximation to the perfect synthesis filter-bank that has minimum sensitivity to quantization errors in the perceptual domain. Second, the accuracy of this approx-imation is governed by the relative error (B−A)/(B+A), whereAandBcan be evaluated as the essential infimum and supremum of the summed responses of the analysis filter-bank. For an auditory filterbank implementation based on FIR gammatone filters, the relative error (B−A)/(B+A) is
−30.7 dB for 50 channels and−5.9 dB for 20 channels. Frame theory can also be used to provide an interpreta-tion of the peak-picking procedure that we use in our audi-tory model. It is convenient to look at a single channel first. A frame algorithm that can be used for the reconstruction of continuous lowpass band-limited signals from irregularly spaced samples and their derivatives was presented in [37]. In this case, the frame is formed by the translates of the impulse response of an ideal lowpass filter and its derivatives. For our case, the first-order derivative of the signal samples is selected
4The first-iteration estimate is exact forA=B, which corresponds to a
tight frame.
as zero and the reconstruction method is essentially identi-cal to the reconstruction applicable if no derivative is given. However, reconstruction is possible with a larger spacing be-tween the samples than if no information was known about the derivatives (a factor two for regularly spaced samples). In practice, the first iteration of the frame algorithm consists of ideal lowpass filtering of the upsampled (inserting zeros) weighted signal. The weighting of each sample is linear with the distance to the previous sample. Nearly uniform spacing, as we have in our case, results in nearly uniform weighting, reducing the first iteration of the frame algorithm essentially to a lowpass filter. Moreover, it is easy to see that the frame is tight for the regular sampling case, which means that the first iteration renders the exact inverse.
We note that the frame algorithm of [37] assumes a band limited signal and a sample spacing that is at most 2π/θfor a band limitation of θ (in practice, the band limitation is somewhat less). Since the output of the auditory filters re-sembles sinusoids, and since a sinusoid of frequencyθshas its maxima spaced at 2π/θs, this implies that the frame al-gorithm of [37] does not apply to our case without modi-fication. The required modification consists of replacing the impulse response of the ideal lowpass filter by the impulse re-sponse of an ideal bandpass filter.5For regularly spaced
sam-ples, the reconstruction algorithm then consists of a simple bandpass filtering. For irregular spacing, the samples must first be weighted appropriately.
In practice, the bandpass filtering operation required for the reconstruction of each of the irregularly sampled chan-nels can be usurped by the corresponding synthesis filter within the inverse of the basilar membrane filterbank. In our practical implementation, we then make the following ap-proximations with respect to inverting the peak-picking pro-cedure: (i) we use the first iteration of the frame algorithm and this is not accurate since the frame is not tight for irreg-ular sampling, (ii) we neglect the sample weightings that are needed to account for irregular sampling, and (iii) we assume the narrowband character of the inverse basilar membrane filterbank filters allow the bandpass filters to be omitted. The perceptual effect of these approximations on auditory syn-thesis is small; the samples are almost uniformly spaced and the bandpass filters used to invert the peak picking can be very broad, broader than the auditory filters, as is confirmed by the results provided inSection 3.3.
The frame interpretation leads directly to a method to re-duce the coding rate of our basic model. Particularly for the filters of the basilar membrane filterbank with high center frequency, the peak-picking procedure leads to a high rate of peaks. Since the peak locations and amplitudes must be encoded as side information, the resulting parameterization is not a good basis for coding. However, we note that the described frame-algorithm-based reconstruction from peak
5We note that, in general, sampling rates that are sufficient for lowpass
amplitudes and locations only requires that the peaks be not separated by more than a given distance. Importantly, there is no requirement to include all peaks of the signal. As a re-sult, we can downsample the peak sequence in the channels with higher center frequency by a significant factor without loosing the ability to reconstruct the signal.
The amount of downsampling that can be applied to a peak sequence is constrained by the bandwidth of the ideal bandpass filter of the frame. With increasing downsampling of the peak sequence, the importance of the bandpass filter-ing operation increases and then it cannot be omitted from the synthesis structure. On the other hand, the bandpass filter cannot be selected to be narrower than the nominal width of the basilar membrane filters, since that removes rel-evant information. It is interesting to note that this frame-theoretical vantage point leads to a new interpretation of the results obtained in [39]. In [39], downsampling of the peak sequence was justified from a masking argument, which is not physiologically plausible for the auditory representation.
4. EXEMPLARY APPLICATIONS IN AUDIO
AND SPEECH CODING
The proposed invertible auditory model allows to resynthe-size the input signal with high quality and, therefore, can build a basis for coding of audio signals. The next section describes first approaches for quantization and coding to re-duce the amount of data needed to transmit an auditory rep-resentation, whereas inSection 4.2, we exploit the inherent redundancy of the auditory representation in a joint source-channel coding strategy to protect against possible losses of data during the transmission in a packet-switched network.
4.1. Auditory-domain compression
The auditory representation provided by our model is sparse, consisting mostly of zeros. However, it contains more firing pulses in total compared to the number of samples that the original input signal has (about three times more for the 20-channel case and a sampling rate of 8 kHz).
Experiments have shown that the firing-pulse amplitudes can be quantized coarsely, for example, using a block scalar quantizer with a block duration of 20 milliseconds and 1 bit [10] per pulse amplitude, without introducing audible dis-tortion. The maximum amplitude of a block has to be trans-mitted as side information for each channel where 6 bits per value are enough. In fact, quantizing the peak amplitudes with 1 bit enables us to refer to three amplitude values—high (=1), middle (=0), and zero—since zero denotes that there is no pulse at all (no pulse time position transmitted as side information).
In [39] even 0 bits were found to be sufficient for the pulse amplitudes, that is, only the side information (block-average pulse amplitudes and pulse positions) requires trans-mission. However, in that work shorter block lengths are used to determine the block energy. Especially for higher-frequency channels, the block duration is only 4 millisec-onds.
Much more important than the firing-pulse amplitudes are the pulse-time positions. Also these positions have to be transmitted as side information which produces by far the major part of the transmitted data. In [39], these positions are compressed using arithmetic coding for low-frequency channels and vector quantization for high-frequency chan-nels. Furthermore, models of temporal and simultaneous masking were added to reduce the overall number of fir-ing pulses drastically. While the consideration of simultane-ous masking does not bring a remarkable reduction, exploit-ing temporal maskexploit-ing does. Our own experiments with the model for temporal postmasking adopted from [39] show that an average reduction in number of pulses by 50% for 16 kHz-sampled speech does not affect the audible quality of the reconstructed signal [40]. For this model, a masking threshold signal is computed in each channel. Letx[n] be the firing pulse train of one auditory channel andT[n] the cor-responding masking threshold. ThenT[n] is defined as
T[n]=
x[n], x[n]> T[n−1]e−1/τ,
T[n−1]e−1/τ, otherwise. (21)
The time constantτ was set to 125 samples for the lowest-frequency channel and to 33 samples for the highest (accord-ing to the empirically determined values from [39]). Once this threshold is computed, the output signal of the masking stage is
y[n]= x
[n], x[n]> T[n−1]e−1/τ,
0, otherwise. (22)
It is natural to observe many more pulses in high-frequency channels6 than in low-frequency channels. Thus, the
re-duction of the number of pulses is most effective in high-frequency channels. This is in accordance with the frame-theoretic consideration ofSection 3.4.
We have performed experiments with 16 kHz-sampled speech and a 16-channel auditory model. The aforemen-tioned temporal masking model has been included to reduce the number of pulses. The positions of the remaining firing pulses have been coded using run-length encoding combined with arithmetic coding, which results in an average bit rate of about 100 kbps [40] for the transmission of the pulse po-sitions only.7Further compression can be achieved with
vec-tor quantization, (cf. [39]), where an average bit rate of about 70 kbps has been achieved for the overall bit stream.
We expect that a coarse quantization of the pulse posi-tions in high-frequency channels should be sufficient since neurons of the auditory nerve do not any longer show phase-locked firing behavior above 4 kHz. Thus, we expect only a minor increase in necessary bit rate when audio signals at
6The average number of pulses per second in an auditory channel can be
predicted by the channel’s center frequency.
higher sampling rates (e.g., 44.1 kHz) are coded. To affirm this is a matter of our current research.
We have to further reduce the number of pulses signifi-cantly, particularly in higher-frequency channels, to achieve a better compression. In our most recent work [41], we incor-porated a combined model for both simultaneous and tem-poral masking. Together with another pulse-amplitude cor-rection step, which compensates for the loss of energy due to the elimination of pulses, we are able to omit even 74% of the original pulses of speech signals sampled at both 8 kHz and 16 kHz without degrading the reconstruction quality. This result is a step further towards an efficient compression method since it reduces the amount of side information con-siderably. To find the upper bound of the downsampling fac-tor without loosing the ability to reconstruct the signal is a matter of further investigations.
4.2. Multiple description coding
The high degree of redundancy in the human peripheral au-ditory system forms a motivation to use our invertible audi-tory model in a joint source-channel coding strategy. In other words, we use the overcomplete auditory representation to protect the transmitted signal against erasure of coded in-formation (packet loss in packet networks). In [35], we pro-posed the first instance of a highly redundant speech coder optimal for packet-switched networks, for example, for voice over IP applications. There, we use the auditory model for multiple-description coding where the source information is spread over multiple signal descriptions which are carried overMindependent subchannels. These transport channels may be physically distinct as in a packet-switched network or correspond to multiplexed subchannels on a single phys-ical channel. When an arbitrary set ofK < Msubchannels fails, the receiver uses the information from the remaining
M−Kintact channels to reconstruct the transmitted signal. Therefore, the encoder should be based on a nonhierarchical signal decomposition [42]—this is the case for our auditory representation—and should assign descriptions of equal im-portance to each transport channel. The descriptions must be different, that is, each must carry new information, such that receiving more descriptions enables the decoder to im-prove the reconstruction quality.
A grouping of theLauditory channels intoM≤L trans-port channels provides an immediate application of our cod-ing paradigm in this context. To form descriptions of equal importance, L should be chosen as an integer multiple of
M such that a constant number of L/M uniformly spread auditory channels are packaged together into one trans-port channel. In this respect, each description is obtained by frequency-domain subsampling of an overcomplete signal representation. One extreme case is given ifM =L, that is, the maximum possible number of transport channels is used to achieve superior robustness. The other extreme case is a simple interleaving of odd and even indexed auditory chan-nels and assigning them toM=2 transport channels.
If erasures occur, the coded information about some au-ditory channels is lost. However, the information at the af-fected frequencies is generally not lost because neighboring
0 10 20 30 40 50
Channel number
Figure8: Channel erasure pattern for the 50-channel auditory rep-resentation. Black bars indicate erased channels (40%); white bars stand for intact ones (60%).
5 0 −5 −10 −15 −20
0 1000 2000 3000 4000
Frequency (Hz)
dB
Figure9: Overall unequalized frequency response of the nondec-imated analysis/synthesis filterbank with channel erasures as in
Figure 8.
auditory filters overlap. Assuming that the decoder knows which channels are erased, as is the case in packet networks, a time-varying equalizer filter can be designed for the recon-struction after the synthesis filterbank to amplify the attenu-ated regions.
From a frame-theoretical viewpoint, the perfect inverse filter bank can be constructed as long as the frame functions corresponding to the received information form a frame, that is, if they satisfy the frame condition displayed in (16). How-ever, since the separation between the essential infimum and supremum will increase, the approximation made by using time-reversed impulse responses will become less accurate. The accuracy of the approximation prior to equalization can be quantified by means of the factor (B−A)/(B+A), which bounds the distortion.
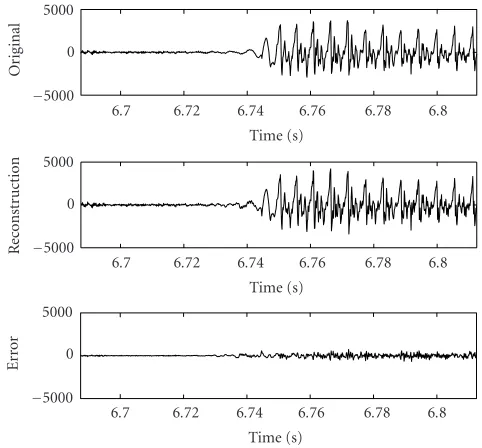
Experiment and Results
We have run an experiment with an auditory model with 50 auditory channels assigned to 50 transport channels. We generated the channel-erasure pattern with 40% randomly muted channels shown in Figure 8. Although the 50 audi-tory channels highly overlap, the high proportion of erased channels creates a clearly perceptible spectral distortion (cf.
Figure 9) if no equalizer is used. The factor (B−A)/(B+A), which bounds distortion, is−3.0 dB.
5000 0 −5000
6.7 6.72 6.74 6.76 6.78 6.8 Time (s)
Or
ig
inal
5000 0 −5000
6.7 6.72 6.74 6.76 6.78 6.8 Time (s)
Re
co
n
st
ru
ct
io
n
5000 0 −5000
6.7 6.72 6.74 6.76 6.78 6.8 Time (s)
Er
ro
r
Figure10: Original segment of a speech waveform (first plot) ver-sus reconstruction from decimated and quantized auditory repre-sentation with 40% channel erasures (middle) and the difference between both (third plot).
pulse positions are left unquantized. InFigure 10, the recon-struction results are shown with a waveform of the initial part of the word “player” spoken by a female speaker sam-pled at a rate of 8 kHz. In the first plot, the original waveform (compensated for the processing delay) is drawn. The second plot shows the output of the decoder for the case that 40% of the channels are erased and an appropriate equalizer with an impulse response of length 256 samples is used. In the third plot, the reconstruction error, that is, the difference between the original and the reconstructed signal, is plotted. The av-erage segmental SNR is 15.5 dB compared to 16.4 dB in the case without channel erasures.
These results show potential applicability of our invert-ible auditory model in joint source-channel coding methods such as multiple description coding for robust transmission over packet-switched networks.
5. CONCLUSION
We have reviewed an invertible auditory model and its us-age for robust coding of speech and audio signals. The in-version procedure to reconstruct the original signal from its auditory representation does not need computationally ex-pensive iterative algorithms and produces reconstructed au-dio signals with very high quality. The overcomplete audi-tory representation suggests the application of the invertible auditory model in multiple description coding. Our experi-ments have shown that our auditory model provides an ideal basis for this joint source-channel coding method to allow robust transmission over packet-switched networks even if a high number of packets get lost. Experiments have shown promising results.
x[n] w0
w1
wW−1
z−1
z−1
A(z)
A(z)
T T
x[n] w0
w1
wW−1
Figure11: Modification of a nondecimated transform filterbank to obtain a frequency-warped version.
APPENDIX
A. ALTERNATIVE FILTERBANK
IMPLEMENTATION METHODS
As discussed inSection 2.1.2, FIR implementations are com-putationally expensive and memory consuming.
A.1. IIR filterbank
Several computationally less expensive IIR implementations for gammatone filters [43] have been suggested. These are based on usual transforms from continuous-time transfer functions to discrete-time transfer functions (e.g., impulse-invariance transformation) which result in filters with an or-der of 8.
Inversion
An inversion based on FIR filters according to (14) is not possible for infinite impulse response filters. While for non-decimated filterbanks the direct channel-by-channel inver-sion of minimum-phase analysis filters is possible with stable and causal synthesis filters, this is not advisable since the fre-quency response of the inverse is complementary, that is, the inverse of a bandpass filter gives a bandstop. In this paper, we do not deal with further inversion possibilities for IIR filter banks, but refer to [44].
A.2. Frequency-warped transform filterbank
Another computationally very efficient approximation of an auditory filterbank is to take a frequency-warped transform filterbank. In the early 1970s, Oppenheim, etal. [45] intro-duced the technique of computing nonuniform resolution Fourier transforms. They first transform the input sequence into a frequency-warped version by time-reversing and pass-ing it through a chain of allpass filters. After that, an FFT of the samples along this allpass cascade is performed. This is a computationally very efficient method for a constant relative-bandwidth spectral analysis for finite-length signals. In the late 1970s, Vary [46] suggested a frequency-warped transform filterbank obtained by simply replacing the unit-delay elements in the signal flow graph representation of a sliding window with general allpasses. This is illustrated in
Figure 11. The window coefficientsw0,. . .,wW−1correspond
3 2.5 2 1.5 1 0.5 0
0 0.5 1 1.5 2 2.5 3
Frequencyθ(radians)
W
ar
p
ed
fr
eq
ue
ncy
θ
(r
adians)
λ=0 λ=0.4
λ=0.8 λ= −0.4
Figure12: Phase function of the first-order allpass for four different values of the warping parameterλ.
is modulated by the transformT(e.g., a DFT or a DCT) to get bandpasses. The window lengthW does not necessarily have to be equal to the number of channelsL(see [47] for more details). Thus, a longer FIR prototype filter can be de-signed to better approximate gammatone or roex frequency responses.
We consider a nondecimated filterbank where the win-dow advances by one sample at a time and, thus, the trans-form has to be calculated for every sample and nondecimated subband signals are obtained.
When the unit delays are replaced with general nonlinear-phase allpasses, the characteristics of the trans-form filterbank will be modified. Let the transfer function of a first-order allpass be denoted by
A(z)= z−1−λ
1−λz−1. (A.1)
with the single so-called warping parameterλ. If we substi-tutez−1byA(z), a bilinear transform is applied resulting in warping the frequency axis corresponding to the phase func-tion of the allpass
θ=arctan (1−λ
2) sin(θ)
(1 +λ2) cos(θ)−2λ
, (A.2)
whereθandθare the frequency (in radians relative to the sampling frequency) variables before and after warping, re-spectively. InFigure 12, this function is plotted for different warping parametersλ.
Smith and Abel [48] proposed expressions for choosing a properλto achieve a frequency warping nearly identical to that of the Bark or the ERB rate frequency scales for a given sampling frequency. InFigure 2, the warped frequency scale
0 −10 −20 −30 −40 −50 −60
0 1000 2000 3000 4000
Frequency (Hz)
M
ag
nitude
(dB)
Gammatone Roex
Frequency-wraped DCT
Figure 13: Normalized frequency responses of four channels of auditory filterbanks. Comparison between FIR gammatone filters, rounded exponentials, and a frequency-warped DCT-4 filterbank (λ=0.5,fs=8 kHz, 64-point Kaiser window withβ=10).
obtained using allpasses withλ = 0.5 at a sampling rate of 8 kHz is compared with the frequency-position function, the ERB rate scale, and the Bark (critical-band rate) scale. There-fore, warping a uniform filterbank with a chain of first-order allpasses yields a good approximation of auditory filterbanks for critical-band spectral analysis.
In Figure 13, the frequency responses of four effective analysis filters of a warped (λ = 0.5) 64-point-windowed DCT-4 filterbank are plotted. Here the window has been chosen without a special optimization (Kaiser window with
β = 10). Therefore, the capability to approximate gamma-tone filter frequency responses or roex functions is limited (especially at higher frequencies). Anyway, we can observe that the responses fit relatively well at low center frequencies. Note that this behavior is contrary to what we have observed for the FIR gammatone filter design, where the necessary im-pulse response length increases with decreasing center fre-quency. Further optimization of the window will improve the frequency responses.
A window length of only 64 samples yields reasonable frequency responses at a sampling rate of 8 kHz. Therefore, the usage of a frequency-warped transform filterbank consti-tutes a computationally highly efficient and memory-saving option for an auditory filterbank implementation on a DSP for real-time applications.
Inversion
x[n] w0
w1
wW−1
A(z)
A(z)
A(z)
A(z)
T T−1
x[n] w0
w1
wW−1
+
+
Figure14: Nondecimated frequency-warped phase-distorted anal-ysis/synthesis filterbank.
sliding window—by replacing the unit-delay chain with a general allpass chain (seeFigure 14). While the uniform fre-quency resolution analysis/synthesis filterbank achieves per-fect reconstruction, the frequency-warped version does not. For the simple case, when the window lengthW equals the number of channelsL, we can choose the window coefficients such thatWi=0−1w2
i =1 and we obtain for the output signal
X(z)=X(z)AW−1(z), (A.3)
and, therefore, a phase distortion is introduced. In [47] an FIR filter is used to compensate for this phase distortion to get a near-perfect-reconstruction filterbank. However, this introduces an additional delay, which increases with decreas-ing compensation error. Anyway, it is not necessary to equal-ize for perfect linear phase since small phase distortions are inaudible. The case where a longer prototype filter is used without a higher number of auditory channels, that is,W > L, is also considered in [47].
In a recent development [49], we have shown that an FIR synthesis filterbank exists for a critically sampled frequency-warped transform filterbank which achieves perfect recon-struction. However, these synthesis filters amplify any quan-tization noise introduced in the subband signals and do not exhibit bandpass characteristics. Thus, they are not recom-mended for coding applications.
ACKNOWLEDGMENT
This paper is an extended version of a plenary lecture pre-sented at the second IEEE Benelux Signal Processing Sympo-sium (SPS-2000) in Hilvarenbeek, The Netherlands, March 2000.
REFERENCES
[1] K. Brandenburg and G. Stoll, “ISO-MPEG-1 Audio: a generic standard for coding of high-quality digital audio,”Journal of the Audio Engineering Society, vol. 42, no. 10, pp. 780–792, 1994.
[2] B. Tang, A. Shen, A. Alwan, and G. Pottie, “A perceptually based embedded subband coder,”IEEE Trans. Speech Audio Processing, vol. 5, no. 2, pp. 131–140, 1997.
[3] R. Veldhuis and A. Kohlrausch, “Waveform coding and audi-tory masking,” inSpeech Coding and Synthesis, W. B. Kleijn and K. K. Paliwal, Eds., pp. 427–428, Elsevier Science, Ams-terdam, The Netherlands, 1995.
[4] T. Dau, D. P¨uschel, and A. Kohlrausch, “A quantitative model of the ‘effective’ signal processing in the auditory system. I. Model structure,”Journal of the Acoustical Society of America, vol. 99, no. 6, pp. 3615–3622, 1996.
[5] E. Zwicker, “Dependence of post-masking on masker dura-tion and its reladura-tion to temporal effects in loudness,”Journal of the Acoustical Society of America, vol. 75, no. 1, pp. 219–223, 1984.
[6] R. Geiger, A. Herre, G. Schuller, and T. Sporer, “Fine grain scalable perceptual and lossless audio coding based on Int-MDCT,” inProc. IEEE Int. Conf. Acoustics, Speech, Signal Pro-cessing (ICASSP ’03), vol. 5, pp. 445–448, Hong Kong, China, April 2003.
[7] M. Hansen and B. Kollmeier, “Using a quantitative psychoa-coustical signal representation for objective speech quality measurement,” inProc. IEEE Int. Conf. Acoustics, Speech, Sig-nal Processing (ICASSP ’97), vol. 2, pp. 1387–1390, Munich, Germany, April 1997.
[8] H. Su and P. Mermelstein, “Delayed decision coding of pitch and innovation signals in code-excited linear prediction cod-ing of speech,” inSpeech and Audio Coding for Wireless and Network Applications, B. S. Atal, V. Cuperman, and A. Gersho, Eds., pp. 69–76, Kluwer Academic Publishers, Boston, Mass, USA, 1993.
[9] R. Fandos Marin,Delayed decision CELP speech coding using squared and perceptual error criteria, M.S. thesis, Department of Signals, Sensors and Systems, KTH (Royal Institute of Tech-nology), Stockholm, Sweden, 2003.
[10] G. Kubin and W. B. Kleijn, “On speech coding in a perceptual domain,” inProc. IEEE Int. Conf. Acoustics, Speech, Signal Pro-cessing (ICASSP ’99), vol. 1, pp. 205–208, Phoenix, Ariz, USA, March 1999.
[11] J. B. Allen, “Cochlear modeling,”IEEE ASSP Mag., vol. 2, no. 1, pp. 3–29, 1985.
[12] S. Greenberg, “Acoustic transduction in the auditory periph-ery,”Journal of Phonetics, vol. 16, pp. 3–17, 1988.
[13] M. A. Ruggero, “Physiology and coding of sound in the audi-tory nerve,” inThe Mammalian Auditory Pathway: Neurophys-iology, A. Popper and R. Fay, Eds., pp. 34–93, Springer-Verlag, New York, NY, USA, 1992.
[14] E. Zwicker and H. Fastl,Psychoacoustics. Facts and Models, Springer-Verlag, Berlin, Germany, 2nd edition, 1999. [15] B. R. Glasberg and B. C. Moore, “Derivation of auditory filter
shapes from notched-noise data,”Hearing Research, vol. 47, no. 1-2, pp. 103–138, 1990.
[16] B. C. Moore,An Introduction to the Psychology of Hearing, Aca-demic Press, London, UK, 4th edition, 1997.
[17] D. D. Greenwood, “A cochlear frequency-position function for several species—29 years later,”Journal of the Acoustical Society of America, vol. 87, no. 6, pp. 2592–2605, 1990. [18] A. H¨arm¨a, M. Karjalainen, L. Savioja, V. V¨alim¨aki, U. K.
Laine, and J. Huopaniemi, “Frequency-warped signal process-ing for audio applications,”Journal of the Audio Engineering Society, vol. 48, no. 11, pp. 1011–1029, 2000.