Interactive Exploration for Image Retrieval
Matthieu Cord
ETIS, CNRS UMR 8051, 6 avenue du Ponceau, 95014 Cergy-Pontoise Cedex, France Email:[email protected]
Sylvie Philipp-Foliguet
ETIS, CNRS UMR 8051, 6 avenue du Ponceau, 95014 Cergy-Pontoise Cedex, France Email:[email protected]
Philippe-Henri Gosselin
ETIS, CNRS UMR 8051, 6 avenue du Ponceau, 95014 Cergy-Pontoise Cedex, France Email:[email protected]
J ´er ˆome Fournier
ETIS, CNRS UMR 8051, 6 avenue du Ponceau, 95014 Cergy-Pontoise Cedex, France Email:[email protected]
Received 15 January 2004; Revised 8 February 2005
We present a new version of our content-based image retrieval system RETIN. It is based on adaptive quantization of the color space, together with new features aiming at representing the spatial relationship between colors. Color analysis is also extended to texture. Using these powerful indexes, an original interactive retrieval strategy is introduced. The process is based on two steps for handling the retrieval of very large image categories. First, a controlled exploration method of the database is presented. Second, a relevance feedback method based on statistical learning is proposed. All the steps are evaluated by experiments on a generalist database.
Keywords and phrases:image retrieval, indexing, statistical learning, classification, relevance feedback.
1. INTRODUCTION
The recent domain of image retrieval in large databases has induced a revision of the topics of image processing and pat-tern recognition. Image retrieval and extraction of visual in-formation from image databases are useful in many appli-cations. Even if there are many different application con-texts, two kinds of search are usually distinguished [1]: tar-get search and category search. Tartar-get search aims at retriev-ing one or a few particular images in the database. Category search aims at retrieving all the images belonging to a given category. In the latter case, the major difficulty is that images belonging to the same semantic category may have very dif-ferent visual contents.
In image retrieval, fully automatic systems have given poor results. In interactive systems, the user is requested to manage the search within the database. For instance, the user may interactively annotate the results as relevant or irrelevant to his query. The system integrates these annotations through a relevance feedback. The main idea of the relevance feedback
is to use the information provided by the user to improve the system effectiveness. One reason for this new need of inter-activity is definitively the huge size and the diversity of the data to be mined. Another reason is the well-known seman-tic gap [2] between the numerical data and their semantic meaning. The user is looking for an image or a set of images with semantics, for instance, a type of landscape, whereas ac-tual systems deal with color or texture features. The problem is even more complicated when the user is looking for a par-ticular building, or a person, or for an abstract concept such as unemployment. These different levels of abstraction have been analyzed in [3].
All CBIR systems have to deal with two major challenges: efficient image coding and effective visual information re-trieval, working with user interaction to bridge the semantic gap. In this paper, we propose solutions for both problems.
[6, 7]. Concerning texture, the most popular features are moments, and features based on cooccurrence matrices, on Gabor filters or on wavelet decompositions [4]. Wavelet-based methods have been compared in [8], and authors have concluded that Gabor wavelets were the most effective. Shape features are numerous, but they depend on prior extraction of regions from the image. Concerning color features, Schettini et al. have gathered color signatures and similarity metrics employed in various indexing systems [9]: all colori-metric spaces, from RGB to HSV to CIELab or CIELuv are used by one or other of these systems. Nevertheless, the au-thors point out that color alone is not sufficient to index large image databases. Spatial relationship between regions are sometimes encoded in order to represent image composition. Using these features or primitives, signatures are computed.
In this paper, we present an image representation which encodes color and texture but also the spatial relations be-tween color regions (or texture regions). For color and tex-ture analysis, the featex-ture space quantization is significant. To handle this problem, we propose a dynamic feature quanti-zation scheme of the whole database. Instead of using prior criteria, experiments in the image retrieval context are car-ried out to select the best quantization method and its pa-rameters.
Concerning the second challenge—effectiveness of the retrieval task—two types of interactive approaches are usu-ally considered [10], the geometrical approach (as search-by-similarity), and the statistical approach (as relevance func-tion estimafunc-tion or binary classificafunc-tion).
(i) The geometrical approach of relevance feedback is based either on the adaptation of the initial query or on the updating of the similarity function. In this approach, initially used for document retrieval [11], the query is represented by a vector in the feature space, and the similarity function al-lows to compare any image to the query. The adaptation then consists in moving the query vector, or in changing similarity parameters. Sometimes both are combined [12]. Similarity updating may be seen as a shape deformation of the search neighborhood around the query.
(ii) The approach by relevance function estimation aims at associating a score to each image of the database, express-ing the relevancy of the image to the query. A Bayesian con-text is often used, and the probability density function is updated considering the user annotations. The probability function may be uniformly initialized and iteratively refined in order to emphasize relevant images [13,14]. The approach using data classification treats the relevance feedback prob-lem as a supervised learning probprob-lem. A binary classifier is learnt by using all relevant and irrelevant annotated images as input training data [10,15].
We present a new version of RETIN, our content-based image retrieval system [16]. Several modules have been de-veloped to deal with target and category searches using both geometrical and statistical approaches. We first present our search-by-similarity approach based on similarity updating. Dedicated to target search, this strategy has been successfully compared to some of the best relevance feedback strategies [16].
We have considerably improved the first version of our system RETIN in order to deal with large category searches. In this context, a category is defined as a set of images with common semantic characteristics. All the relevant images are not always gathered in a single mode in the feature space. The problem is to catch all these modes. Our strategy for category search is based on a statistical approach specially dedicated to explore the database and to track multimodal distributions. To be able to catch all the modes of a category, we propose to explicitly take into account the distribution of the data in the feature space. The stochastic database exploration is based on a sampling of a relevance density function, and a multi-modal similarity function. After a few database exploration steps where many different images of the searched category are collected, the exploitation may start. A learning strategy based on SVM classification is then used to efficiently track large image categories. The latter step is done as soon as the exploration strategy has provided enough examples of the category.
To summarize, the main characteristics of our index-ing system are the adaptive feature quantization (Section 2), and the computation of signatures composed of color, tex-ture, and spatial relationship distributions (Sections3 and
4). Concerning the retrieval engine, two original interactive strategies are proposed for target and category searches in Sections5and6. We design a stochastic exploration scheme that quickly grasps the user query concept (or semantic query) inSection 6. We model relevance feedback either by updating the similarity function or by using a binary clas-sifier inSection 7. InSection 8, experiments on a generalist database are reported.
2. COLOR QUANTIZATION
As color information is usually represented by a huge num-ber of classes (often over 16 million), it is necessary to reduce this number by a color quantization process. This quantiza-tion may be achieved by a static or by a dynamic splitting of the color space. The difference between these two approaches is that the first one is independent of the data, whereas the second one takes into account the distribution of colors in the feature space. The simplest method to reduce the num-ber of classes is to split the color space into a reduced numnum-ber of classes or bins. There are many methods of regular or ir-regular splitting. For example, the HSV space is split into 166 bins in Visual Seek [17]: the intensity axis is split into 3 in-tervals, the saturation axis into 3 inin-tervals, the hue angle into 18 intervals, and the central axis of the cylinder is split into 4 bins for the gray levels.
number and the significance of the bins can be different from an image to another.
After quantization, a signature may be affected to each image. Usually, it consists in the statistical distribution of the classes (estimated by histograms), but it can be reduced to a few features such as moments (mean, variance), covari-ance matrices, or distributions restricted to the most fre-quent classes present in the image.
In RETIN, we use signatures which are statistical distri-butions of colors resulting from a dynamic quantization of the whole database. For the dynamic quantization, we use thek-means method. In thek-means unsupervised learning algorithm, the clusters are automatically carried out using the pixels from all the database images. We use an adaptive algorithm, which means that the whole set of pixels is not simultaneously processed, which would need an enormous memory capacity, but the pixels are sequentially proposed to the clustering process. Pixels are randomly sampled from the database and processed. The only parameter is the number of classes (color bins) which must be previously set. To speed up the process, the database images are sequentially processed, and the random selection of pixels is done image per image.
In the following subsections, we first determine the ap-propriate number of color bins for the k-means classifier, then we compare our adaptive quantization to a static quan-tization, working in HSV space [17].
As none of the numerous color spaces has proved its su-periority over the others for image indexing, we have chosen HSV space in order to compare with static quantization in the same space.
The CBIR experiments have been performed on theCorel
database to compare static and dynamic quantization. This database, composed of 6000 images, is divided into cate-gories, in order to use the classical criteria of precision and recall [19] for quality assessment. Performances are estab-lished independently for each category, but are averaged on 20 queries of the same category. In the follow-up, the dis-played curves are typical results obtained for many cate-gories.1
In all the experiments, the distance used to compare his-tograms is L1 distance. Comparisons of various distances
have been carried out in [21,22]. Most of the time,L1
dis-tance is one of the most effective among geometric distances, statistical tests, and other dissimilarity measures.
2.1. Histogram size selection
Some theoretical rules may be used to tune up the resolu-tion and the number of histogram bins. Sturges’s or Scott’s rules [21] allow to avoid over- or under-quantization. In im-age retrieval context, Brunelli and Mich have evaluated many feature histograms and they concluded that low-resolution histograms (with small bin numbers) are reliable [21]. For color histograms, Tran and Lenz suggest to use around 30 bins [23].
1Alternatively, the number of images per category could be used to draw new evaluation curves, in the precision/recall plane [20].
0 0.1 0.2 0.3 0.4 0.5 0.6 0.7 0.8 0.9 1
P
recision
0 0.1 0.2 0.3 0.4 0.5 0.6 0.7 0.8 0.9 1 Recall
8 bins 16 bins 25 bins 100 bins 400 bins
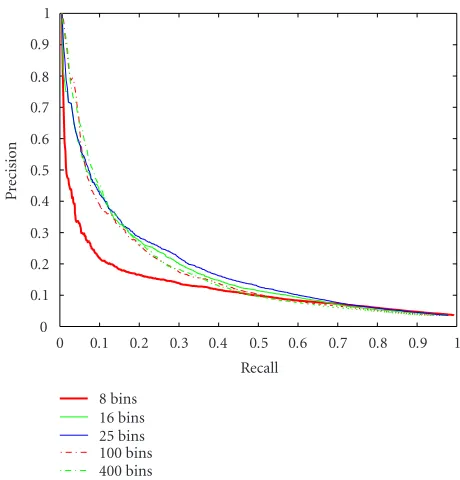
Figure 1: Precision/recall curves for different numbers of classes
(sunset category).
Figure2: Color palette resulting from our adaptive database quan-tization (here in gray levels). The 25 clusters are represented by their barycenters in the color feature space.
In this paper, we set the number of clusters from experi-mentations. Moreover, tests will be performed in Section 8
with a complete retrieval system, including the feedback loop. Here, we just examine the influence of the number of classes on the retrieval results. The k-means algorithm is evaluated for different number of classes, from 8 to 400.
Figure 1 displays precision/recall curves (averaged over 20 queries) obtained by the k-means algorithm. Except for 8 classes, for which results are lower, there is no significant difference between the other four curves. As the size of sig-natures is related to the retrieval time, small sigsig-natures, and small number of classes have to be favored.
The palette of 25 colors (seeFigure 2) was obtained from a quantization using 500 million pixels randomly selected in the Corel database. Each pixel can then be displayed by the class center the closest to its original color (seeFigure 3).
2.2. Color quantization method selection
(a) (b)
Figure3: Two examples of images before and after quantization of HSV color space by adaptivek-means in 25 classes. The pixel values are replaced by the color of the class center, here represented in gray. (a) Original image. (b) Color-quantized image.
0 0.1 0.2 0.3 0.4 0.5 0.6 0.7 0.8 0.9 1
P
recision
0 0.1 0.2 0.3 0.4 0.5 0.6 0.7 0.8 Recall
Smith and Chang Adaptivek-means
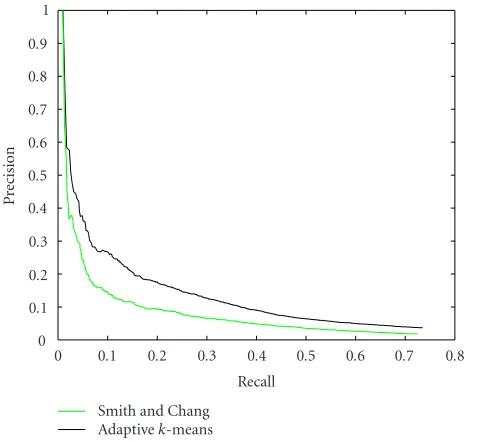
Figure 4: Precision/recall curves for two quantization methods: Smith and Chang with 166 bins and our adaptive method with 25 colors.
the static quantization algorithm (166), the performances of the dynamic classifier are better.
We observed this behavior for many categories; in order to provide statistics for the whole database, we present ca-pacity curves [24]. The capacity curve is defined as the his-togram of dissimilarities between all pairs of images of the database [24]. It allows to appreciate the dispersion of sig-natures within the search space. The more this dispersion increases, better is the discrimination quality of the signa-ture. The capacity curves have been computed for the color
0 0.002 0.004 0.006 0.008 0.01 0.012
Fre
q
u
en
cy
0 0.1 0.2 0.3 0.4 0.5 0.6 0.7 0.8 0.9 1 Dissimilarity
Hist166 Sign25
Figure5: Capacity curves for the color histogram in 166 classes of Smith and Chang and for our color signature (color space HSV) of 25 classes (Sign25).
histogram of Smith and Chang and for our color signature (Figure 5). One can observe that image dispersion in the search space is larger with our color signature than with the Smith and Chang histogram. The discriminatory abil-ity of our approach is higher, which confirms previous re-sults.
(a) (b)
0 0.1 0.2 0.3 0.4 0.5 0.6 0.7
0 5
10 15
20 25
30 (c)
Figure6: Example of transition matrix with 15×15 blocks. (a) Original image. (b) Block-image. (c) 3D representation of colorimetric transition matrix.
A major advantage of the dynamic approach is the reduction of the size of the signature without performance deteriora-tion.
Even if the results depend on the image categories and on the database, all our experiments show that for a gen-eralist database (around 10 000 images), a small number of classes obtained by a dynamic clustering of the database is sufficient to build efficient color signatures. We have adopted this dynamic quantization in the RETIN system with 25 color classes (as the default value).
3. SPATIO-COLORIMETRIC INDEXING
Color distribution is not sufficient to encode all color infor-mation, because it gives no information about spatial local-ization of each color in the image. Some methods integrate spatial information, for example, color correlograms [25], spatio-colorimetric histograms [26], and composite region templates (CRT) [5]. Another solution is to segment the im-age and to store spatial relationship between regions. How-ever, automatic segmentation of a whole database is not an easy task. Using manual annotations, complex spatial rela-tionships have been modeled and exploited in a pictorial data retrieval context [27]. Starting from the work of Smith and Li [5], we propose a new spatio-colorimetric indexing without segmentation.
3.1. Spatio-colorimetric quantization
without segmentation
The main idea is to store the vertical color transitions within the image. In generalist image databases, only vertical transi-tions are of importance. The reason is that a symmetry over a horizontal axis greatly changes our perception of the image, while a vertical symmetry weakly changes it: in landscape im-ages, the sky is usually on the top of the image!
0 0.05 0.1 0.15 0.2 0.25 0.3 0.35 0.4 0.45 0.5
P
recision
0 0.1 0.2 0.3 0.4 0.5 0.6 0.7 0.8 0.9 1 Recall
5×5 splitting 10×10 splitting 15×15 splitting 30×30 splitting 45×45 splitting
Figure 7: Precision/recall curves for various splittings using our spatio-colorimetric signature (landscape category).
One example of block-image and its matrix of color tran-sitions is displayed inFigure 6. The matrix is mainly made up of a large peak corresponding to blue/white transitions, which represents the vertical sky/snow transitions in the im-age.
Transition matrices are large and very sparse. It would be expensive to keep the whole matrix as signature, so the infor-mation contained in matrices is reduced toN2components
by PCA.
3.2. Method tuning and comparative results
The only parameter of our spatio-colorimetric signature is the number of blocks.Figure 7compares retrieval results for several numbers of blocks from 5×5 to 45×45. Curves show that 15 or 30 is a good choice for the number of blocks. The more image is degraded by a coarse splitting, the more per-formances decrease. On the other hand, using more blocks does not improve results. Considering the mean size of ob-jects contained in the Corel database, which is typical of gen-eralist image databases, the number of blocks can be set to 15×15.
We have carried out comparisons between signatures us-ing CRT and our spatio-colorimetric signatures. InFigure 8, precision/recall curves have been obtained for 20 queries with the CRT signature and with our spatio-colorimetric sig-nature with 225 (15×15) blocks, and after reduction to 25 classes. In order to respect the original CRT method, we have used the similarity function of Smith and Li for CRT re-trieval [5]. Our signature gives the best results. The reasons are that we have a better color adaptation to data through the
2Nis the number of color clusters.
0 0.1 0.2 0.3 0.4 0.5 0.6 0.7 0.8 0.9 1
P
recision
0 0.1 0.2 0.3 0.4 0.5 0.6 0.7 0.8 0.9 1 Recall
CRT Smith and Li Spatial and color
Figure8: Precision/recall curves using the Smith and Li signature and our spatio-colorimetric signature (elephant category).
dynamic color quantization and a better spatial adaptation thanks to the splitting into small blocks, which is more accu-rate than the coarse segmentation proposed by Smith and Li. Over-segmentation, which could be criticized, is not a draw-back in our scheme, because pairs of adjacent blocks with the same color are not counted.
InFigure 9, we reported retrieval results when the sys-tem uses either only the color signature, or both color and spatio-colorimetric signatures. The ten most similar images are displayed in decreasing rank of similarity. The spatial in-formation clearly improves the results in this search, moving away images of mountains, where blue areas are not in the center of the image.
4. TEXTURE
The same principle of quantization can be applied to any feature space. For example, texture is often represented by wavelet coefficients or by features obtained with Gabor fil-ters. We use a Gabor filter bank of three frequencies and four orientations, which leads to a 12 dimensional vector for each pixel. Quantization is performed by thek-means algorithm which in this case works in a 12 dimensional space (3 fre-quencies and 4 orientations) instead of the 3 dimensional HSV space. Two examples of quantization of the texture space are displayed inFigure 10.
As for color composition, vertical transitions of textures can be stored in a vector representing texture image compo-sition.
(a) (b)
Figure9: Results for a search of doors in the Corel database. Images are ranked by decreasing similarity from top to bottom, and from left to right. The query is the top-left-hand image. (a) Without spatial information. (b) With spatial information.
(a) (b) (c) (d)
Figure10: Two examples of images before and after quantization of the texture space by adaptivek-means in 25 classes. A gray level is randomly attributed to each texture class.
as explained in Section 2.2. The second vector represents spatio-colorimetric transitions as presented inSection 3. The other vectors represent texture in the same way as color. In order to easily combine similarities in various spaces, we take the same number of clusters for all the spaces. Experiments on the Corel database have shown thatN =25 classes (for any feature space) realizes a good tradeoffbetween the size and the richness of the resulting signature. We have adopted this value as the default one in RETIN.
5. TARGET SEARCH: SIMILARITY UPDATING
5.1. Introduction
Target search strategy works as follows: the user presents an example of the images he is looking for, and the system ex-tracts from the database the images most similar to the query. Given a set of results, the user indicates if each image is rel-evant or irrelrel-evant. Relevance feedback is then applied. Two main approaches can be distinguished and combined. The first one is directly inspired by text retrieval and consists in query refinement, that is, a mean query is computed from relevant and irrelevant examples provided by user [2]. The second approach is similarity updating. For instance, some
techniques refine results through tuning of weights associ-ated to each feature space. Actually, feature weights are either manually tuned by user [28] or automatically updated via user annotations [29].
Our CBIR system RETIN includes a relevance feedback stage with similarity refinement [30]. Our similarity func-tion is first introduced, and the feedback scheme managing competition between features is detailed.
5.2. Similarity updating strategy
The similarity is computed in each feature space and the set of similarities is then merged. We use a hierarchical model [29] where merging is achieved by a linear combination of all the feature space similarities. The system compares a query imageRto any imageIiof the database, these images are
in-dexed byMstatistical distributions (one for each feature) of Nclasses, respectively, notedRandIi:R= {Rk(q), 1≤q≤
N, 1≤k≤M}andIi= {Iik(q), 1≤q≤N, 1≤k≤M}.
The similarity is computed as a double-weighted sum:
SR,Ii=
M
k=1
βksk
with
sk
R,Ii
=1−
N
q=1
αkqRk(q)−Iik(q), (2)
βk ∈ R+,αkq ∈ R+. Weights βk (resp., αkq) manage the
competition between features (resp., between bins), and they are normalized: Mk=1βk = 1 and
N
q=1αkq = 1 for all
(k∈[1,M]). With the signature normalization, we also have 0≤sk(R,Ii)≤1 for allkand consequently 0≤S(R,Ii)≤1.
The dissimilarity function may be deduced from the similar-ity one:D(R,Ii)=1−S(R,Ii).
At the beginning, weights are equal and normalized. Af-ter computing global similarities between each image and the query, the images most similar to the query are displayed. Af-ter user annotations, the set of relevant (E+) and irrelevant
(E−) images constitute a learning set (E). It is used to update weights by an LMS optimization. Therefore, it is easy to com-pute bothαandβparameter updating [16]: given a learning rateµ(µ >0), one iteration of feedback forIi∈Eis
βk←βk+µ(1IIi∈E+−S(R,Ii))sk(R,Ii),
αkq←αkq+µ(1IIi∈E+−S(R,Ii))βk|Rk(q)−Iik(q)|,
(3)
where 1I is the indicating function.
6. CATEGORY SEARCH: ON-LINE SEMANTIC
QUERY LEARNING
Search-by-similarity strategies with relevance feedback are well suited for target search. To retrieve a few images close to a query image, our search-by-similarity method is eff ec-tive. The problem is much more complicated when the user is looking for large image categories. In this case, all rele-vant images have common semantic characteristics but are not always gathered in a single mode in the feature space. The problem is to catch these various modes. Without spe-cific strategy, search-by-similarity methods only retrieve im-ages close to the first query, and so, it is very hard to track other modes of the searched category.
Any system needs an efficient strategy for exploring the database in order to catch complex image category distribu-tions. Statistical learning approaches which perform binary classification do not really manage exploration. They need enough initial training data in several modes in order to get good classifications [15]. Chang proposes a two-step sequen-tial process to get some relevant images before doing the classification [31]. Bayesian framework has been proposed [14,32] for relevance feedback. Some kind of exploration is implicitly managed, but the goal is not to retrieve categories, and the exploration is not easy to tune.
We propose a statistical approach to explore the database and to track multimodal distributions. The basic idea is to modify the selection scheme (based on similarity ranking). A relevance probability is attributed to each image. The system uses this probability to sample and display new images. The probability function is defined to ensure that, during the first steps of a search session, any image, even far from the query,
could be selected. When starting a retrieval session with one image from one mode, this strategy makes possible to select images from other modes.
This approach allows us to have a direct control of the exploration with intuitive parameters very easy to tune. This strategy is inspired by simulated annealing techniques [33].
6.1. Stochastic exploration approach
We note that SQ(for semantic query) the set ofLimages that have been annotated as relevant since the beginning of the retrieval session,SQ= {Rl, 1≤l≤L}.
The idea is to assign to each image of the database a prob-ability to be relevant towards the searched category. A Boltz-mann distribution on the dissimilarityD(·)3is then used to
compute the image probability:
PSQ
I=Ii
= 1
ZT ×
exp
−
DSQ,Ii
T
, (4)
where ZT is the sum of the exponential values over all the
images of the database andTthe parameter which tunes the size of the search subspace.
At each iteration of the interactive search, the system samples and displays images according to the probability PSQ. All images that the user annotates as relevant are added
to the setSQ.
When the parameterT is high, the influence of the dis-similarity to SQ is small, and thus, the neighborhood ex-plored around the setSQis broad. WhenTdecreases, the in-fluence of the dissimilarity toSQincreases in the probability computation. The search space cuts down aroundSQ. Dur-ing first iterations, the database exploration is favored and new examples are added to the query, allowing to catch many modes of the searched category.
The SQcontent information accumulated during first steps may be fully exploited in a second step.
6.2. Semantic query similarity function
The similarity between an image and the setSQ= {Rl, 1≤
l ≤ L}is different from the similarity between two images defined inSection 5. For an imageIi(indexed byIi) and for
a search based onM feature spaces, the similarity measure-ment betweenIiand the semantic query is calculated as
fol-lows:
SSQ,Ii
=
M
k=1
βksk
SQ,Ii
, (5)
where sk(SQ,Ii) is the similarity in the kth feature space,
βk∈R+. Many similarity functionssk(Rl,Ii) have been tested
and a similarity based onL1distance has been adopted in our
experiments (with normalization):sk(Rl,Ii)=1−dL1(Rl,Ii).
3The extension ofD(R
To merge similarities sk(Rl,Ii), we use the
follow-ing barycenter operator: sk(SQ,Ii) = (
L
l=1sk(Rl,Ii)2)/
(Ll=1sk(Rl,Ii)) This strategy allows to take the
multi-modality into account [34].
Due to the normalization,sk(SQ,Ii) ≤ 1 for allk, and
the similarity valuesS(SQ,Ii) are then between 0 and 1. The
dissimilarity may be expressed as follows:
DSQ,Ii
=1−SSQ,Ii
. (6)
6.3. Parameter tuning
A decreasing law for the parameterT has to be defined. In CBIR context, the number of iterations must be small in or-der not to discourage the user. We use an exponential decay:4
Tj=Cj×T0, (7)
whereT0 andC are constants (C < 1), and j indicates the
user interaction steps. Constants have to be set for an accept-able number of feedback iterations. Actually, we propose to base them on maximal dissimilarities in the feature space. This approach will allow to handle more intuitively the ex-ploration process.
We first specify that dissimilarityDused for parameter tuning was equalized beforehand. We consider the probabil-ityδof selecting an image whose dissimilarity is lower than a thresholddbound. According to (4) we have
δ=
Ii∈db|D(SQ,Ii)≤dbound PSQ
I=Ii
=
Ii∈db|D(SQ,Ii)≤dbound 1 ZT
exp
−
DSQ,Ii
T
. (8)
With the notationdi=D(SQ,Ii), for allIi∈db, after
rank-ing,δmay be expressed as follows:
δ=
0≤di≤dbound 1 ZT
exp
−
di
T
. (9)
To find an explicit relation betweenT,dbound, andδ,Dmay
be considered as continuous (reasonable hypothesis since the database contains many images). After equalization ofD, this leads to the following approximation:
δ≈ dbound
0 exp(−x/T)dx
∞
0 exp(−x/T)dx
, (10)
that is,
dbound= −T·ln(1−δ). (11)
4In simulated annealing techniques [33], a combination between high initial parameterT(called temperature parameter) and slow cooling strat-egy is unsuited. For time-consuming constraints, exponential decay is often preferred.
Step 1: For each imageIi,PSQ(I=Ii) calculation (4).
Step 2:PSQ(.) sampling and display of images.
Step 3: Image annotation and updating of semantic querySQ. Step 4: Decreasing ofT(7).
Step 5: Go to step 1 until the end of the exploration.
Algorithm1: Stochastic exploration of the database.
T0 is calculated according to the maximum dissimilarity
dbound=DMAXat the beginning of the retrieval. So, we have
(cf. (11))
T0= −DMAX
ln(1−δ). (12)
In the same way,dmaxis defined as the maximal dissimilarity
at the last step of the exploration. By choosing the number nof iterations during the exploration, it is possible to fix up the final value ofT:
Tfinal=Tn= −dmax
ln(1−δ). (13)
The constantCmay be computed thanks to (7) in the follow-ing way:
C= n dmax
DMAX.
(14)
To summarize, four parameters handle the exploration pro-cess.
(i)δ, close to 1, set to 1−10−5in all tests.
(ii)DMAX. In our experiments, the whole database is
se-lected. In this case,DMAXis the dissimilarity of the image of
the database the furthest away from the query.
(iii)dmax. This value may be tuned thanks to the number
of images that the system has investigated by the end of the exploration process. We set this number to 20×Ndispimages
in our experiments (whereNdispis the number of images
dis-played at each iteration).
(iv)nthe number of iterations. From 5 to 10 iterations is a nice tradeoffbetween short search and effective exploration of the database.
Once the parameters are set, the process may start. One iteration of the stochastic exploration algorithm is shown in
Algorithm 1.
7. CATEGORY SEARCH: SEMANTIC
QUERY EXPLOITATION
7.1. Context
Relevance feedback may be used to refine the semantic query similarity function introduced inSection 6.2. Weight competition on β parameters (cf. Section 5) has been ap-plied. We called it the SQRF technique (semantic query rele-vance feedback).
Recently, statistical learning approaches have been in-troduced in CBIR context and have been very successful [15,31]. Discrimination methods may significantly improve the effectiveness of visual information retrieval tasks. How-ever, CBIR is a very specific classification task. There are very few training data during the retrieval process, and the in-put space dimension is very high. Support vector machines (SVM) seem to be a good solution in such a context because they are dedicated for binary classification and are well suited to these specificities. They usually have good classification performances with few training data and high input space.
However, SVM need a minimum of examples to obtain good discrimination and generalization properties. For this reason, we always start category search session with explo-ration strategy before SVM classification.
7.2. SVM parameter setting
Let (Iq)q∈[0,l−1],Iq∈Rpbe the feature vectors representing
annotated images, and let (yq)q∈[0,l−1],yq ∈ {−1, 1}be their
respective annotations (1=relevant,−1=irrelevant). The aim of the SVM classification method is to find the best hyperplane separating relevant and irrelevant vectors maximizing the size of the margin (in between both classes). Initial method assumes that relevant and irrelevant vectors are linearly separable. To overcome this problem, kernels k(.,.) have been introduced. This allows to deal with non-linear spaces. Moreover, a soft margin may be used, in order to tolerate noisy configuration. It consists in a very simple adaptation by introducing a boundCin the initial equations [35]. The resulting optimization problem may be expressed as follows:
argmax
α
l−1
q=0
αq−
1 2
l−1
q,j=0
αqαjyqyjk
Iq,Ij
,
with
l−1
q=0
αqyq=0 ∀q∈[0,l−1], 0≤αq≤C.
(15)
Thanks to the optimalαvalue, the distance between a vec-torIiand the separating hyperplane is used to evaluate how
the imageIiis relevant:
fIi=
l−1
q=0
yqαqk
Ii,Iq
. (16)
The kernel function, used in the SVM algorithm, has to be determined. Most popular kernels are Gaussian and poly-nomial ones. We selected a Gaussian kernel k(Ii,Ij) =
exp(−d2(I
i,Ij)/2σ2) because we have no prior assumption
on input data configuration. Moreover, distance in Gaussian kernel may be chosen according to the type of feature vec-tors. For instance, we use aχ2 distance which is well suited
for histograms, and in that case,σ=1.
8. EXPERIMENTS
We display in this section some experiments on 6 000 im-ages from the Corel database introduced inSection 2. In or-der to make quality assessment, reference categories are used to generate many experiments and make statistics on preci-sion and recall criteria [19]. As there are high variations in the number of images in each category, performances are es-tablished independently for each category, but are averaged on many queries of the same category.
Category retrieval is evaluated.5 First, results and
qual-ity assessment of the exploration step are examined. The ex-ploitation of the semantic query is then reported.
Feature vectors are composed of four index vectors pre-sented in Sections2,3,4, but the user may select or unselect some of them. For category retrieval statistical computation, only color and texture features are considered.
InFigure 11, we present three different results:
(i) result with no feedback (Figure 11a),
(ii) result after 5 iterations of our similarity feedback strat-egy with a single query image without exploration (Figure 11b),
(iii) result with the exploration process to build the seman-tic query. Images are not ranked, but most of the im-ages of the semantic querySQ(obtained after 5 itera-tions) are displayed (Figure 11c).
We note that the same number of annotations has been ap-plied for the three experiments.
Assume the user is looking for the castle category in this experimentation and the initial query is the castle picture the first line, left column ofFigure 11(a).
One can notice that the result without feedback is really poor; the color distributions and the transitions seem to be very close in the returned images, but there are no castles be-fore the ninth rank. Next, the feedback strategy SQRF is able to find relevant images (Figure 11(b)), but the number of rel-evant retrieved images remains low. Finally, the exploration strategy gives by far the best results (Figure 11(c)). Many cas-tle images of very different kinds have been retrieved with-out using more user annotations than those applied by other methods.
InFigure 12, a quality assessment is realized over 20 dis-tinct queries of the flower category. The performance cri-terion is the recall according to the number of iterations. We also computed performances of a random search. In the beginning of our controlled exploration, the system re-turns many images even far from the query in order to catch the category diversity. The recall criterion is weak during these first iterations, and then quickly increases after four or five feedbacks. When the semantic query has caught enough modes of the category, performances are higher than with simple competition strategy.
(a) (b)
(c)
Figure11: Retrieval strategy comparison: (a) the top-15 result without feedback, (b) result using the simple feedback retrieval strategy , and (c) the exploration strategy result.
Our exploration strategy is effective to build a powerful semantic query, which makes the accumulation of many rele-vant images easy. After some iterations, more relerele-vant images are retrieved than by using traditional search-by-similarity methods.
In Figures 13and 14, the last part of our category re-trieval strategy is evaluated and compared for two cate-gories. Two methods have been introduced in Section 7, the semantic query relevance feedback technique (SQRF), and the SVM binary classification. They are used after the exploration and compared to the relevance feedback technique without exploration. The efficiency of the ex-ploration method is confirmed by these precision/recall curves: the technique performs better with exploration. The SVM classification always gives the best results. These re-sults have been confirmed by tests on many categories from this database and from other generalist databases [36, 37]. One can notice that performances are better for the cavern category than for the flower category. The
cavern category is simpler (50 images) than the flower one (200 images sparsely distributed in the feature space). These properties explain the difference of retrieval eff ective-ness.
As far as the time consuming is concerned, the main computational needs is theO(N) computation (whereNis the number of images in database) of the distance between any image and the query (step 1 inSection 6), or for the SVM method, the fellowship to the relevant class (function f(.) in
0 0.1 0.2 0.3 0.4 0.5 0.6 0.7
Re
ca
ll
0 5 10 15 20 25
Number of iterations Semantic query exploration Similarity updating Random search
Figure12: Exploration evaluation: recall according to the number of feedback iterations.
0 0.1 0.2 0.3 0.4 0.5 0.6 0.7 0.8 0.9 1
P
recision
0 0.1 0.2 0.3 0.4 0.5 0.6 0.7 0.8 0.9 1 Recall
SQRF without exploration SQRF with exploration SVM with exploration
Figure 13: Precision/recall curves for semantic query relevance feedback and SVM methods with or without exploration strategy (flower category).
9. CONCLUSION
We proposed a new system to take up the double gauntlet of CBIR: powerful image signature and efficient interactive retrieval strategy.
Color and texture indexing are considered. We carried out comparative tests concerning color and texture space quantization in the framework of CBIR. As a result of a lot of experiments, we have chosen an adaptive
quantiza-0 0.1 0.2 0.3 0.4 0.5 0.6 0.7 0.8 0.9 1
P
recision
0 0.1 0.2 0.3 0.4 0.5 0.6 0.7 0.8 0.9 1 Recall
SQRF without exploration SQRF with exploration SVM with exploration
Figure 14: Precision/recall curves for semantic query relevance feedback and SVM methods with or without exploration strategy (cavern category).
tion method with an efficient parameter tuning. Adaptive quantization is more effective than static one. Thanks to this database quantization, the number of clusters in the quanti-zation can be drastically reduced. Typically, 25 clusters pro-duce satisfactory results for databases of about 10 000 images. It is used in RETIN as the default value to quantify color and texture spaces. We also encoded spatial information through vertical cooccurrences of colors and textures. This is a sim-ple and effective way to build signatures including the spatial distribution of color and texture features.
We are currently working on the integration of our explo-ration strategy in the statistical framework of active learning [37,38]. Other investigations concern the analysis of the se-mantic queries stored during many retrieval sessions. This semantic information is very rich and should be helpful for future category searches [39].
REFERENCES
[1] A. W. M. Smeulders, M. Worring, S. Santini, A. Gupta, and R. Jain, “Content-based image retrieval at the end of the early years,”IEEE Trans. Pattern Anal. Machine Intell., vol. 22, no. 12, pp. 1349–1380, 2000.
[2] Y. Rui, T. S. Huang, S. Mehrotra, and M. Ortega, “A relevance feedback architecture for content-based multimedia informa-tion retrieval systems,” inProc. IEEE Workshop on Content-Based Access of Image and Video Libraries, pp. 82–89, San Juan, Puerto Rico, June 1997.
[3] J. P. Eakins, “Towards intelligent image retrieval,” Pattern Recognition, vol. 35, no. 1, pp. 3–14, 2002.
[4] B. S. Manjunath and W. Y. Ma, “Browsing large satellite and aerial photographs,” inProc. IEEE International Conference on Image Processing (ICIP ’96), vol. 2, pp. 765–768, Lausanne, Switzerland, September 1996.
[5] J. R. Smith and C.-S. Li, “Image classification and querying using composite region templates,”Computer Vision and Im-age Understanding, vol. 75, no. 1-2, pp. 165–174, 1999. [6] J. Hafner, H. S. Sawhney, and W. Equitz, “Efficient color
his-togram indexing for quadratic form distance functions,”IEEE Trans. Pattern Anal. Machine Intell., vol. 17, no. 7, pp. 729– 736, 1995.
[7] M. J. Swain and D. H. Ballard, “Color indexing,”International Journal of Computer Vision, vol. 7, no. 1, pp. 11–32, 1991. [8] W. Y. Ma and B. S. Manjunath, “Image indexing using a
tex-ture dictionary,” inDigital Image Storage and Archiving Sys-tems, vol. 2606 ofProceedings of SPIE, pp. 288–298, Philadel-phia, Pa, USA, October 1995.
[9] R. Schettini, G. Ciocca, and S. Zuffi, “Color in databases: in-dexation and similarity,” inProc. 1st International Conference on Colour in Graphics and Image Processing (CGIP ’00), Saint-Etienne, France, October 2000.
[10] N. Vasconcelos and M. Kunt, “Content-based retrieval from image databases: current solutions and future directions,” in Proc. IEEE International Conference on Image Processing (ICIP ’01), vol. 3, pp. 6–9, Thessaloniki, Greece, October 2001. [11] J. J. Rocchio, “Relevance feedback in information retrieval,” in
The SMART Retrieval System: Experiments in Automatic Doc-ument Processing, G. Salton, Ed., Prentice-Hall, Englewood Cliffs, NJ, USA, 1971.
[12] Y. Ishikawa, R. Subramanya, and C. Faloutsos, “MindReader: Query databases through multiple examples,” inProc. 24th In-ternational Conference on Very Large Databases (VLDB ’98), pp. 218–227, New York, NY, USA, August 1998.
[13] G. Caenen, G. Frederix, A. A. M. Kuijk, E. J. Pauwels, and B. A. M. Schouten, “Show me what you mean! PARISS: A CBIR-interface that learns by example,” inProc. International Con-ference on Visual Information Systems (VISUAL ’00), vol. 1929, pp. 257–268, Lyon, France, November 2000.
[14] I. J. Cox, M. L. Miller, T. P. Minka, T. V. Papathomas, and P. N. Yianilos, “The Bayesian image retrieval system, PicHunter: Theory, implementation and psychophysical experiments,” IEEE Trans. Image Processing, vol. 9, no. 1, pp. 20–37, 2000. [15] S. Tong,Active learning: theory and applications, Ph.D. thesis,
Stanford University, Stanford, Calif, USA, 2001.
[16] J. Fournier, M. Cord, and S. Philipp-Foliguet, “RETIN: A content-based image indexing and retrieval system,”Pattern Analysis and Applications Journal, vol. 4, no. 2/3, pp. 153–173, 2001, special issue on image indexation.
[17] J. R. Smith and S. F. Chang, “VisualSEEK: a fully automated content-based image query system,” inProc. ACM Multime-dia Conference, pp. 87–98, Boston, Mass, USA, November 1996.
[18] Y. Rubner, C. Tomasi, and L. J. Guibas, “The earth mover’s distance as a metric for image retrieval,” Tech. Rep. STAN-CS-TN-98-86, Department of Computer Science, Stanford Uni-versity, Stanford, Calif, USA, 1998.
[19] J. R. Smith, “Image retrieval evaluation,” inProc. IEEE Work-shop on Content-Based Access of Image and Video Libraries (CBAIVL ’98), Santa Barbara, Calif, USA, June 1998. [20] D. P. Huijsmans and N. Sebe, “Extended performance graphs
for cluster retrieval,” inProc. IEEE Computer Society Confer-ence on Computer Vision and Pattern Recognition (CVPR ’01), vol. 1, pp. 26–31, Kauai, Hawaii, USA, December 2001. [21] R. Brunelli and O. Mich, “Histograms analysis for image
re-trieval,”Pattern Recognition, vol. 34, no. 8, pp. 1625–1637, 2001.
[22] Y. Rubner, C. Tomasi, and L. J. Guibas, “A metric for distribu-tions with applicadistribu-tions to image databases,” inProc. 6th IEEE International Conference on Computer Vision (ICCV ’98), pp. 59–66, Bombay, India, January 1998.
[23] L. V. Tran and R. Lenz, “PCA-based representation of color distributions for color-based image retrieval,” inProc. IEEE International Conference on Image Processing (ICIP ’01), vol. 2, pp. 697–700, Thessaloniki, Greece, October 2001.
[24] M. Stricker and M. J. Swain, “The capacity of color histogram indexing,” inProc. IEEE Computer Society Conference on Com-puter Vision and Pattern Recognition (CVPR ’94), pp. 704–708, Seattle, Wash, USA, June 1994.
[25] J. Huang, S. R. Kumar, M. Mitra, W.-J. Zhu, and R. Zabih, “Image indexing using color correlograms,” in Proc. IEEE Computer Society Conference on Computer Vision and Pattern Recognition (CVPR ’97), San Juan, Puerto Rico, June 1997. [26] L. Cinque, S. Levialdi, K. A. Olsen, and A. Pellicano,
“Color-based image retrieval using spatial-chromatic histograms,” in Proc. IEEE International Conference on Multimedia Computing and Systems (ICMCS ’99), vol. 2, pp. 969–973, Florence, Italy, June 1999.
[27] S. Berretti, A. Del Bimbo, and E. Vicario, “Weighted walk-throughs between extended entities for retrieval by spatial ar-rangement,”IEEE Trans. Multimedia, vol. 5, no. 1, pp. 52–70, 2003.
[28] C. Carson, M. Thomas, S. Belongie, J. M. Hellerstein, and J. Malik, “Blobworld: A system for region-based image indexing and retrieval,” inProc. 3rd International Conference on Visual Information Systems (VISUAL ’99), pp. 509–516, Amsterdam, The Netherlands, June 1999.
[29] Y. Rui and T. S. Huang, “Optimizing learning in image re-trieval,” inProc. IEEE Conference on Computer Vision and Pat-tern Recognition (CVPR ’00), vol. 1, pp. 236–243, Hilton Head Island, SC, USA, June 2000.
[30] J. Fournier, M. Cord, and S. Philipp-Foliguet, “Back-propagation algorithm for relevance feedback in image re-trieval,” inProc. IEEE International Conference on Image Pro-cessing (ICIP ’01), vol. 1, pp. 686–689, Thessaloniki, Greece, October 2001.
[32] D. Geman and R. Moquet, “A stochastic feedback model for image retrieval,” inProc. RFIA, vol. 3, pp. 173–180, Paris, France, February 2000.
[33] S. Kirkpatrick, C. D. Gelatt, and M. P. Vecchi, “Optimization by simulated annealing,”Science, vol. 220, no. 4598, pp. 671– 680, 1983.
[34] M. Cord, J. Fournier, and S. Philipp-Foliguet, “Exploration and search-by-similarity in CBIR,” in Proc. XVI Brazilian Symposium on Computer Graphics and Image Processing (SIB-GRAPI ’03), pp. 175–182, Sao Carlos, Brazil, October 2003. [35] K. Veropoulos, “Controlling the sensivity of support vector
machines,” inProc. 16th International Joint Conference on Arti-ficial Intelligence (IJCAI ’99), Stockholm, Sweden, July–August 1999.
[36] P.-H. Gosselin, M. Najjar, M. Cord, and C. Ambroise, “Dis-criminative classification vs modeling methods in CBIR,” in Proc. IEEE Advanced Concepts for Intelligent Vision Systems (ACIVS ’04), Brussel, Belgium, September 2004.
[37] P.-H. Gosselin and M. Cord, “RETIN AL: An active learning strategy for image category retrieval,” inProc. IEEE Interna-tional Conference on Image Processing (ICIP ’04), Singapore, Republic of Singapore, October 2004.
[38] D. A. Cohn, Z. Ghahramani, and M. I. Jordan, “Active learn-ing with statistical models,”Journal of Artificial Intelligence Re-search, vol. 4, pp. 129–145, 1996.
[39] P.-H. Gosselin and M. Cord, “Semantic kernel updating for content-based image retrieval,” in Proc. IEEE International Workshop on Multimedia Content-Based Analysis and Retrieval (MCBAR ’04), Miami, Fla, USA, December 2004.
Matthieu Cordreceived the Ph.D. degree in image processing in 1998 from Cergy University, France. After one year at the ESAT lab, KUL, Belgium, he joined the ETIS lab, France. He received the HDR degree in 2004. His research interests include content-based image retrieval and computer vision. In CBIR, he focuses on learning-based ap-proaches to visual information retrieval. He developed several interactive systems to
im-plement, compare, and evaluate several online feedback strategies for generalist database applications or more dedicated contexts. He is involved in several French research projects and in the Euro-pean network of excellence MUSCLE (multimedia understanding through semantics, computation, and learning).
Sylvie Philipp-Foliguettaught mathemat-ics in high schools from 1977 to 1984. She received the Ph.D. degree in image process-ing from Paris VI University in 1988. She has been an Assistant Professor, then Profes-sor at ENSEA, Cergy-Pontoise, from 1989. She is working in ETIS, CNRS, where she manages the Image Team. Her main topics are image segmentation and pattern recog-nition. She is particularly involved in
eval-uation and comparison of segmentations and in image interpreta-tion through region classificainterpreta-tion. She has recently diversified her applications into image indexing and database image mining.
Philippe-Henri Gosselin is a Ph.D. stu-dent at ETIS lab, France. His research inter-ests focus on learning methods for content-based image retrieval. He has developed several learning techniques for this partic-ular context, especially statistical methods. In particular, he studied data analysis, ac-tive learning (relevance feedback), and con-cept learning strategies for real-time image retrieval systems.