CSEIT1724142 | Received : 03 August 2017 | Accepted : 14 August 2017 | July-August-2017 [(2)4: 572-577]
International Journal of Scientific Research in Computer Science, Engineering and Information Technology © 2017 IJSRCSEIT | Volume 2 | Issue 4 | ISSN : 2456-3307
572
Dropout Classification through Discriminant Function Analysis:
A Statistical Approach
Ajit Kumar Jain
*1, C. K. Jha
2*1Department of Computer Science, Banasthali Vidyapith, Rajasthan, India
2
Professor, Department of Computer Science, Banasthali Vidyapith, Rajasthan, India
ABSTRACT
Educational Data Mining is a promising area in which many researchers are working on various issues like performance evaluation, enrollment management, placement, and dropout. Dropout of the students from their courses is one of the serious problems that require more efforts by the researchers. By applying the statistical and data mining techniques in the student database, lots of useful information can be obtained that may be useful to find out the causes of the dropout. In addition to this, classification models can be designed that can predict whether the student is thinking about the dropout from the course. This prior knowledge about student‟s view regarding the dropout can be used to find out the reasons for dropout as well as by providing the appropriate counseling to the student; dropout ratio can be marginally reduced. The objective of the proposed research is to design a classification model for the dropout using a statistical technique called Discriminant Function Analysis.
Keywords: Discriminant Function Analysis, Educational Data Mining, Data Preprocessing, Cross-Validation.
I.
INTRODUCTION
Data Mining in Education [1][2] sector is an emerging area where researchers are carrying their work to support educational institutions in taking timely and informed decisions in prediction of dropout, forecasting the admissions, courses preferred by the students, recruiters preferred and also in framing out new policies by using statistical and data mining methods and tools [3]. In today‟s scenario, Educational Data Mining has become one of the most preferred research areas for the researcher working in the field of computer science. On the website of Educational Data Mining community, the term educational data mining has been defined as follows: “Educational Data Mining is an emerging discipline, concerned with developing methods for exploring the unique types of data that come from educational settings, and using those methods to better understand students, and the settings which they learn in [4][5][6].” One of the reasons behind the significance of Educational Data Mining is that higher educational institutes have collected a big volume of data for years. However, the problem is that this data is never put in the form so that it can be used
for the betterment of the students as well as institutes. To date, higher educational institutes are “data-rich but information poor”. This data is growing exponentially every year. The size of the data repositories have been far exceeded from human‟s ability for comprehension without the use of powerful data analysis tools. The conclusion is that data stored in data repositories has converted into “data tombs” – data archives that are almost never visited. By applying the statistical and data mining techniques like regression, discriminant analysis, classification, prediction, clustering, association rule mining on this unutilized students data stored in data archives, many useful information and knowledge can be produced for the decision makers of the higher educational institutes [7][8]. One of the important aspects of this knowledge is the prediction of dropouts on which our research is devoted.
II.
Literature Survey
sector especially for the prediction of dropouts, a deep survey of literature has been done.
R. Woodman carried out a research on the students‟ course, the credit points of the course and the student‟s occupation group [9]. In a similar type study the results from econometric analysis of the probability of dropout for Italian universities found that significant influential parameters for dropping out include gender, age, previous school type, prior academic performance and faculty of study [10]. based on regression and discriminant analysis are more frequently and regularly used to recognize the causes of dropouts. The biological and psychosocial factors that increase the negative outcomes were discussed in a study executed in 2006. It was pointed out that the variables that are important for the prediction of persistence about the student at one academic level will not be necessarily same at the different academic level for the same student. It means that different models must be derived for making the difference between persistence and dropout of the student at different courses or academic levels [12].
A case study conducted in 2009, presents the dropout analysis and success factors for the electrical engineering students at Eindhoven University of Technology, the Netherlands. The study was performed for the students who made dropout after studying the first semester or even before entering into the engineering course using more sophisticated classifier such as Bayesian Network [13]. To identify the factors influencing the persistence or dropout of student, a study was conducted on the dataset of 450 students of the subject information systems enrolled in 2006 to 2009 at Open Polytechnic College of New Zeland. The dataset contained the socio-demographic variables as well as parameters related to the study environment [14].
In a paper it was published that Data mining technique can be used for prediction of weaker students and help them to score better marks. It may also help the teachers to improve the performance of students who are predicted to fail [15]. In a similar type of work, it was shown that how rule based classification and Naive Bayesian classification can be useful in the prediction of student‟s performance at graduate level [16]. In a paper presented by M. Slocum [17], it was shown that decision tree based algorithms are effective way of producing models for decision-making.
Using the logistic regression model, it was exhibited that “boredom”, “confusion”, and “carelessness” are major predictors of college enrolment and contribute to the general model of college enrolment [18]. Discriminant analysis based model was proposed by Darrin Thomas in 2014 to predict the student‟s intention about the college completion. Institutional support, classroom learning environment, academic self-efficacy and social support were considered as prime indicators for prediction [19]. There is higher rate of dropout for online course than traditional course [20]. In this study, the authors have presented prediction of student success and failure at very early stages. Logical regression based prediction model was applied to identify the poor performer students.
III.
METHODOLOGY
This study has considered the students of higher educational institute particularly in the context of residential university for data collection. We have used SPSS 16.0 for the analysis of data as a software tool.
Measure in Questionnaire and Sample Design
For the proposed research, data is collected by distributing the questionnaires to the students of computer science courses. The survey included the information related to socio-economic features of students, features related to university like educational system, infrastructure, and other student related information like stress, homesickness etc.
The students of B.Tech. and BCA are the respondents. Total number of 310 responses were received from the students in which 156 students belongs to B.Tech. and remaining 154 students to BCA.As a sampling method for data acquisition, simple random sampling has been used in this study.
Discriminant Function Analysis (DA)
student‟s dropout. The categorical dependent variable „DROPOUT‟ has two possible classes i.e. either „yes‟ or „no‟.
In DA, a linear equation is determined for prediction. The general form of the equation is:
(1)
Where D = discriminate function
v = the discriminant coefficient or weight for that variable
X = respondent‟s score for that variable a = a constant
The steps for development of Dropout prediction model using discriminant analysis are:
Step 1: Upload the students‟ data in SPSS.
Step 2: Use stepwise selection method for selection of most suitable variables using Wilks‟ lambda method with F-value criteria.
Step 3: Compute discriminant coefficients weights and a constant. records using discriminant linear equation derived in step 4.
Step 6: Compute the mean of discriminant scores i.e. group centroids for the both groups of DROPOUT i.e. for „YES‟ and „NO‟.
Step 7: Find out the mean centroid by computing the mean of centroids computed in step 6. Step 8: Take the record for which the class value of
DROPOUT has to be predicted. Compare it‟s discriminant score with the value of mean centroid computed in step 7. If it is less than mean centroid, it means this record belongs to „NO‟ group otherwise it belongs to „YES‟ group.
The Table 1 shows the variables as most relevant attributes for the design of prediction model for dropout, after applying the F-measure using stepwise forward selection method.
Table 1. Variables Filtered for Prediction Model
S. No.
Name of Variable Domain/Code
1. Residence Type Urban (1)
7. Adjustment with Campus Environment
Yes (1)
No (2)
8. Goal Changed. Yes (1)
No (2)
9. Satisfied with the Selected Course
Highly Satisfied (1) Satisfied (2) Not Satisfied (3)
IV.
RESULTS AND DISCUSSION
Table 2 presents the summary of testing parameters for the significance of discriminant function. In the proposed research, there are two groups i.e. „Yes‟ and „No‟ for the dependent variable DROPOUT, so the number of the discriminant functions will be 1. The Eigenvalue is 3.26, which is greater than 1. It indicates the discriminant function‟s good discriminant ability. The Canonical Correlation reflects the association between the dependent variable and the discriminant function. In case of one discriminant function, it is most useful measure for association. A high value of canonical correlation reflects a high level of correlation between the dependent variable and discriminant function and vice versa. The square of canonical coefficient, tells the percentage of variance explained by the discriminant model in prediction of the grouping variable. Here, the value 0.883 of Canonical Correlation Coefficient suggests the model explains 78% (i.e. square of 0.883) of the variation in the grouping variable, i.e. whether a respondent dropout or not. For chi-square test, the hypothesis is that the “function has no discriminating ability”. Here, the p-value is less than 0.05; it tells that the hypothesis is rejected. The Rejection of hypothesis means that the discriminant function separates the groups well.
The values of the test parameters for the significance of discriminant function show that the derived discriminant function will be a good discriminator for the class variable DROPOUT.
Table 2. Summary of Significant Tests
Table 3 exhibits the unstandardized discriminant function coefficients. These coefficients are used to construct a discriminant function or equation. This function acts as a prediction model and can be used to classify the new cases.
Table 3. Unstandardized Canonical Discriminant Function Coefficients
Function 1
Residence Type -0.720
Type of Family 0.666
Any Stress 1.068
Participation in Extra-curriculum activities?
1.282
Any Family Problem? -0.591
Feel Home Sickness? -0.887
Adjusted with Campus Environment?
-1.098
Goal Changed? -0.871
Satisfied with the Selected Course? 0.555
(Constant) 1.667
Using the discriminant function coefficients in Table 3, we can derive the model for dropout in the linear discriminant analysis equation form as follows:
D = (-0.720 x Residence Type) + (0.666 x Type of Family) + (1.068 x Any Stress) + (1.282 x Participation in Extra-curriculum activities?) + (-0.591 x Any Family Problem?) + (-0.887 x Feel Home
Sickness?) + (-1.098 x Adjusted with Campus Environment?) + (-0.871 x Goal Changed?) + (0.555 x Satisfied with the Selected Course?) + 1.667
(2)
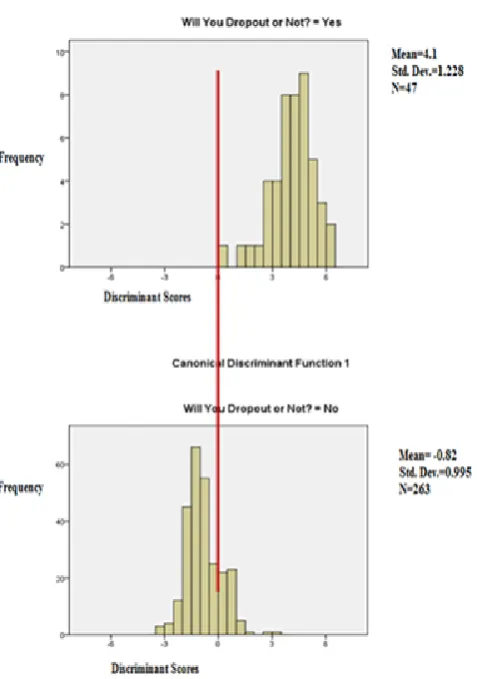
Histograms shown in fig. 1 present the alternative ways of illustrating the distribution of the discriminant function scores for each group. Figure shows that there is a minimal overlap of graphs between each group. This suggests that the discrimination function does discrimination well.
Figure 1. Histograms Showing the Distribution of Discriminant Scores
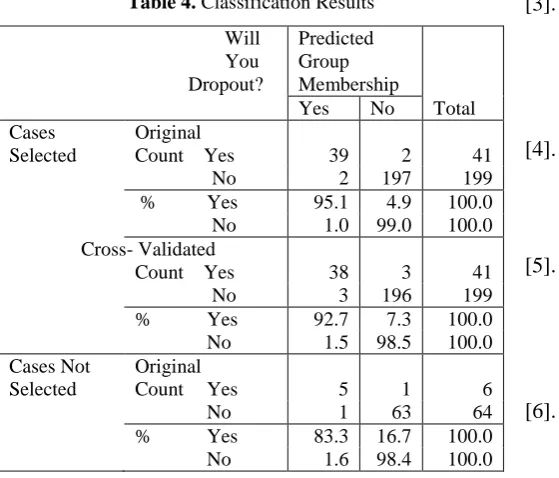
Table 4. Classification Results
In case of original selected case the 95.1% cases are correctly classified. When we use cross-validation method using the folds of 10 for classification the 92.7% cases are correctly classified, whereas, in case of test data the percentage of correctly classified cases is 83.3%.
V.
CONCLUSION AND FUTURE SCOPE
This study has proposed a prediction model for dropout using discriminant analysis for the computer science students of higher educational institute. The final results show that the accuracy of the model for training data using cross-validated grouped cases and testing data is 92.7% and 83.3% respectively. As a future scope, new prediction models may be developed using methods such as Decision Tree or Naïve Bayesian Classification available in data mining. A comparative study of discriminant based model with newly developed models may be conducted for their accuracy of prediction.
VI.
REFERENCES
[1]. Huebner, Richard A. "A Survey of Educational Data-Mining Research", Research in Higher Education Journal, Copyright Academic and Business Research Institute (AABRI), April 2013, vol. 19, pp. 1-13.
[2]. Cristobal Romero and Sebastian Ventura, "Data Mining in Education," Copyright © John Wiley & Sons, Inc, 2013, vol. 3(1), pp. 12-27.
[3]. Z. J. Kovacic, "Early Prediction of Student Success: Mining Student Enrollment Data", Proceedings of Informing Science & IT Education Conference, Cassino, Italy, 2010, pp 648-665.
[4]. R. Baker, "Data Mining for Education," International Encyclopedia of Education (3rd edition), Oxford, UK: Elsevier, 2010, vol. 7, pp. 112-118.
[5]. C. Romero and S. Ventura., "Educational Data Mining: A Review of the State of the Art," IEEE Transactions on Systems, Man, and Cybernetics, Part C: Applications and Reviews, November, 2010, 40(6), pp. 601-618.
[6]. R. Baker and K. Yacef., "The State of Educational Data Mining in 2009: A Review and Future Visions," Journal of Educational Data Mining, Oct. 2009, vol. 1(1), pp. 3– 17.
[7]. J. Luan, "Data mining, knowledge management in higher education, potential applications," In Workshop associate of institutional research international conference, Toronto, 2002, pp. 1– 18.
[8]. S. R. Barahate and V. M. Shelake, "A Survey and Future Vision of Data Mining in Educational Field", In Proceeding of the Second International Conference on Advanced Computing & Communication Technologies, 2012, pp. 96-100. [9]. R. Woodman, "Investigation of Factors that
Influence Student Retention and Success Rate on Open University Courses in the East Anglia Region," M.Sc. Dissertation, Sheffield Hallam University, 2001, UK.
[10]. G. Boero, T. Laureti, and R. Naylor, "An Econometric Analysis of Student Withdrawal and Progression in Post-Reform Italian Universities," Centro Ricerche Economiche Nord Sud – CRENoS, 2005.
[11]. J. Jun, "Understanding dropout of adult learners in e-learning," Ph.D. Dissertation, The University of Georgia, USA, 2005.
[12]. O. L. Herrera, "Investigation of the role of pre- and post-admission variables in undergraduate institutional persistence, using a Markov student flow model," Ph.D. Dissertation, North Carolina State University, USA, 2006.
International Conference on Educational Data Mining, 2009, pages 41-50.
[14]. Z. J. Kovacic, "Early Prediction of Student Success: Mining Student Enrollment Data," Proceedings of Informing Science & IT Education Conference, Cassino, Italy, 2010, pp 648-665.
[15]. S. A. Kumar and M. N. Vijayalakshmi, "Efficiency of Decision Trees in Predicting Student's Academic Performance," First International Conference on Computer Science, Engineering and Applications, CS and IT 02, © CS & IT-CSCP 2011, Dubai, pp. 335-343. [16]. M. Mohammed and M. Alasa M., " Mining
Educational Data to Improve Students‟ Performance: A Case Study," International Journal of Information and Communication Technology Research, ©2012 ICT Journal. [17]. M. Slocum, "Decision making using ID3,"
RIVIER ACADEMIC JOURNAL, 2012, Vol. 8(2).
[18]. San Pedro, M.O.Z., Baker, R.S.J.d., Bowers A.J. & Heffernan, N.T., "Predicting College Enrollment from Student Interaction with an Intelligent Tutoring System in Middle School," In Proceedings of the 6th International Conference on Educational Data Mining, Memphis, 2013, pp. 177-184.
[19]. D. Thomas, "Predicting Student College Completion Intention: A Discriminant Analysis," ASEAN JOURNAL OF MANAGEMENT & INNOVATION, 2014.