Wadden Sea intertidal flat
Bas van Leeuwen
Graduation committee:
Prof. Dr. S.J.M.H. Hulscher Dr. ir. D.C.M. Augustijn Drs. M.B. de Vries
Dr. B.K. van Wesenbeeck
Master’s Thesis
January 2008
Preface
This document is my Master's Thesis for Civil Engineering and Management at the University of Twente. The project has been conducted at WL|Delft Hydraulics which has merged into Deltares in January 2008. The subject of this study is the influence of mussel beds on fine sediment dynamics and although I am not a fan of mussels in a culinary sense, I have been gripped by the sheer depth of interaction between these animals and their environment. Despite this, there have been times when I was desperately stuck. I will therefore use the rest of this preface to thank the people who have helped me come through.
First of all I would like to thank the members of my committee: Suzanne Hulscher for her constructive criticism and focus on positive results; Denie Augustijn for his guidance in keeping me on track and letting me see the way forward; Mindert de Vries for his enthusiastic support and original suggestions, especially considering the issues that have been on his mind and finally Bregje van Wesenbeeck, for providing me with meticulous feedback and suggestions during the last two months. I would also like to thank Frank Dekker, although not really part of my graduation committee, for getting me up to speed with Delft3D.
Further people that I am grateful to for letting me share in their knowledge and skills regarding a variety of subjects: Luca van Duren, Rob Uittenbogaard, Herman Kernkamp, Pieter-Koen Tonnon, Maarten van Ormondt, Norbert Dankers and Bas Borsje. Thanks goes out to my fellow graduate students and colleagues at the student square of MCM2 for the great work atmosphere they provided.
I would like to thank my parents and brother for being the wonderful people they are. Above all, Floor, thank you for your love and support during the past months, I would not know what to have done without you.
Delft, January 2008
Abstract
Large aggregations of mussels, so called mussel beds, live in the Dutch Wadden Sea and the Eastern Scheldt estuary. Mussel beds can be hundreds and even thousands of meters in size. The influence of mussel beds on fine sediment dynamics has been well recognized in literature. Until now, no successful attempts at modeling this influence exist.
During this study a process-based model implementation of young mussel bed interaction with fine sediment has been set up for use in Delft3D. Roughness and erosion behavior have been implemented via the Delft3D trachytope functionality. The Delft3D source code has been adjusted in order to simulate active capture of suspended fine sediment by mussel filter feeding. The properties of sediment (including pseudo-faecal matter) deposited in between mussels have been taken into account by adjusting the sediment characteristics in the mussel bed.
The mussel bed implementation has been tested in a Wadden Sea intertidal mudflat model. The model domain has been based on an area south of Ameland, which is suitable mussel habitat. The model has simulated two current dominated summer months. A sensitivity analysis has been conducted on the parameters of the mussel bed implementation. Finally, different patterns, known to occur in young mussel beds, have been imposed.
Contents
1 Introduction ...1
1.1 Problem definition ...1
1.2 Research objective ...2
1.3 Report outline...2
2 Fine sediment, mussels and mussel beds ...3
2.1 Fine sediment dynamics...3
2.1.1 Suspended sediment transport ...3
2.1.2 Lag effects...4
2.1.3 Fine sediment in the Wadden Sea...5
2.2 Blue mussel (Mytilus Edulis)...5
2.3 Mechanisms of fine sediment influence ...6
2.3.1 Effect on hydrodynamics...7
2.3.2 Biodeposition as deposition flux...9
2.3.3 Properties of sediment in between mussels ...10
2.3.4 Conceptual model for fine sediment –mussel bed interaction...11
2.4 Mussel beds in the Wadden Sea...13
2.4.1 Definition of a mussel bed...13
2.4.2 Development of a mussel bed ...13
2.4.3 Habitat ...14
2.4.4 Mussel bed patterns...15
2.5 Conclusions ...18
3 Model implementation of a mussel bed...19
3.1 Basic implementation in Delft3D...19
3.2 Hydrodynamic implementation of a mussel bed ...21
3.2.1 Mussel bed height ...21
3.3 Biodeposition in Delft3D ... 24
3.3.1 Adding a biodeposition term to Delft3D-FLOW ... 24
3.3.2 Estimating filtration rate ...25
3.3.3 Implementing properties of (pseudo-)faecal matter in sediment...26
4 Model set-up... 27
4.1 Model area... 28
4.1.1 Model location and dimensions ...28
4.1.2 Grid and Bathymetry... 28
4.2 Hydrodynamic model set-up ... 29
4.2.1 Hydrodynamic boundary conditions ... 29
4.2.2 Physical parameters ...31
4.3 Morphology... 31
4.3.1 Fine sediment ...31
4.3.2 Initial and boundary suspended sediment concentrations ... 32
4.3.3 Morphological parameter settings ...32
4.4 Spatial implementation of mussel bed ...32
5 Simulation results... 35
5.1 Reference model results ...35
5.1.1 Flow conditions and suspended sediment concentration at model center ...35
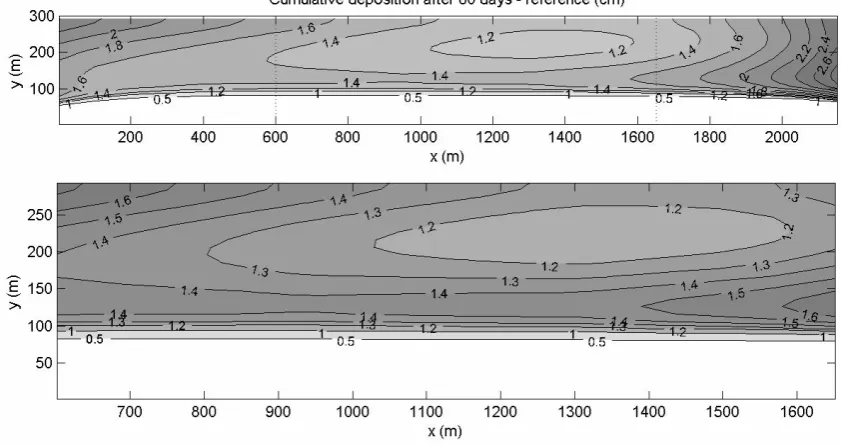
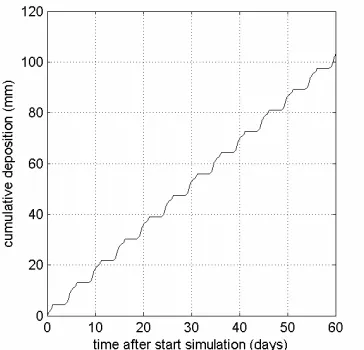
5.1.2 Accretion and erosion in model domain ... 37
5.2 Standard mussel bed ... 38
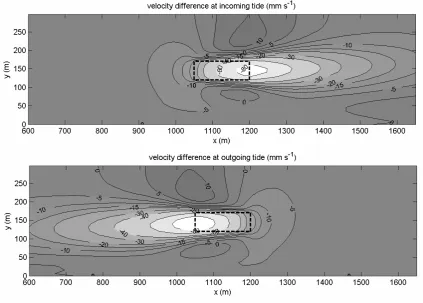
5.2.1 Impact on flow velocities... 38
5.2.2 Mussel bed effects on net retention of sediment... 39
5.2.3 Mussel bed effects on accretion patterns ...40
5.2.4 Decomposition of causes... 41
5.3 Conclusion... 42
6 Sensitivity analysis... 43
6.1 Variations in mudflat slope ... 43
6.2 Sensitivity for mussel bed parameters ... 44
6.2.2 Sensitivity to mussel bed roughness...44
6.2.3 Sensitivity to filtration rate ...45
6.2.4 Sensitivity to erosion behavior ...46
6.2.5 Conclusion...47
6.3 Patterning in young mussel beds ...47
6.3.1 Patterns inside the mussel beds ...48
6.4 Relating fine sediment influence to mussel biology ...50
7 Discussion ...53
7.1 Discussion of methodology...53
7.1.1 Mussel upward migration ...53
7.1.2 (Pseudo-)faecal pellets as export product of mussel bed...54
7.1.3 Waves...54
7.1.4 Sand-silt interaction...55
7.1.5 Boundary conditions and nesting...55
7.2 Discussion of results...56
7.2.1 Implications of the relative importance of roughness and filtration rate...56
7.2.2 The advantage of a patchy bed ...57
7.2.3 Seasonal variation versus long term morphological influence. ...57
7.2.4 Implications for use of mussels as biotools. ...58
8 Conclusion and recommendations...61
8.1 Conclusion ...61
8.2 Recommendations...62
8.2.1 Recommendations for future experiments...62
8.2.2 Recommendations regarding the mussel bed implementation ...63
8.2.3 Recommendations regarding model application...63
A Investigating erosion in a mussel bed with DPM vegetation model ...69
A.1 Directional Point Model...70
A.4 Conclusion... 75
B Analysis of results from laboratory experiments of flow over mussel beds... 77
B.1 Experimental set-up ...77
B.1.1 Experimental set-up De Vries... 77
B.1.2 Experimental set-up van Duren ... 78
B.2 Flow over the back of the mussel bed is quasi-uniform... 79
B.3 Horizontal velocity ...81
B.3.1 Experimental results ...81
B.3.2 Analysis of flow profiles ... 82
B.4 Turbulence profiles... 87
B.4.1 Turbulence and Turbulent Kinetic Energy ...88
B.4.2 Experimental results ...89
B.5 Erosion experiments by De Vries... 91
B.6 Conclusion... 92
C Delft3D-FLOW... 93
C.1 Hydrodynamic equations... 93
C.2 Computational grid ... 94
C.3 Drying and Flooding Algorithm... 95
C.4 Trachytopes functionality...96
C.5 Transport equations ... 98
C.5.1 Suspended load sediment transport... 98
C.5.2 Initial and boundary conditions ... 98
C.5.3 Cohesive sediment ... 99
D Model grid and parameter settings... 101
D.1 Model area dimensions ... 101
D.2 Computational grid ...101
D.3 Numerical settings... 102
D.4 Hydrodynamic parameters ... 102
D.6 Standard mussel bed parameters ...103
E Flow conditions and suspended sediment concentration at
observation points ...105
1 Introduction
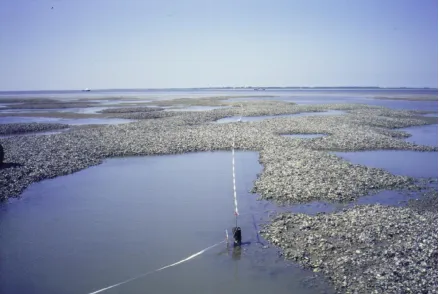
Large aggregations of mussels live in the Dutch Wadden Sea and the Eastern Scheldt estuary, the mussel beds can stretch for kilometers. Next to the resources these shell fish offer as a local culinary delicacy, research is ongoing investigating how mussel beds can be deployed to achieve ecological and engineering aims. This graduation project aims to contribute to this research, by adding to the understanding of the influence of mussel beds on fine sediment dynamics.
Figure 1: Wadden Sea mussel bed (Photograph provided by Norbert Dankers).
1.1 Problem definition
in the Wadden Sea and in the Eastern Scheldt estuary. Mussel beds could also increase deposition in these areas by slowing down the flow. Modeling the influence of mussel beds on fine sediment dynamics will be a useful tool in predicting the effectiveness of these measures. At this moment such a model implementation does not exist.
1.2 Research objective
The goal of this graduation project is formulated as follows:To model mussel-sediment interaction in order to study (1) the net retention and (2) the spatial distribution of fine sediment on a Wadden Sea intertidal flat. The goal is formulated in such a way that this project can contribute to both the influence of mussel beds on large estuarine scale fine sediment dynamics (by studying the net retention of sediment) and the local effects of placing mussel beds in the vicinity of salt marshes (by investigating the influence of a mussel bed on the spatial distribution of fine sediment). The Wadden Sea has been chosen as a research area because it is both a natural habitat for mussels and a proposed location for use of mussels as bio-tools. Based on the objective the following research questions will be addressed:
1) How do mussel beds influence fine sediment dynamics and which properties of the mussel bed are important in this respect?
2) How can existing experimental data be used to assess relevant mussel bed characteristics?
3) How can mussel beds be implemented in the Delft3D hydrodynamic and morphological model?
4) What is the influence of mussel beds on net fine sediment retention on an intertidal mudflat in the Wadden Sea?
5) What is the influence of mussel beds on the spatial patterns of deposition and erosion on an intertidal mudflat in the Wadden Sea?
6) How do naturally occurring spatial patterns in mussel beds affect these influences?
1.3 Report outline
2
Fine sediment, mussels and mussel beds
The blue mussel (Mytilus Edulis) is an ecosystem-engineer (Jones et al., 1994), implying that it can exert substantial effects on its surroundings. In case of the mussel, it constructs its own habitat: the mussel bed. The mussel bed influences both the amount and distribution of fine sediment on an intertidal flat. In this chapter an overview of previous research on the governing processes of this influence is presented. First, a short introduction into fine sediment dynamics is given. Second, the most essential characteristics of mussel biology are explained. Third, the influence of mussels and mussel beds on fine sediment dynamics is explained. In the fourth and last section the development of intertidal mussel beds in the Wadden Sea is explained.
2.1 Fine sediment dynamics
Before focusing on the influence of mussel beds on fine sediment dynamics, a short introduction into the fine sediment dynamics themselves is in order. Fine sediment (mud or cohesive sediment, particle diameter < 63 m) is distinct from course non-cohesive sediment (sand, particle diameter 63 m – 2 mm) primarily because it has much smaller particles. This difference in size brings about a distinctly different behavior of fine sediments as opposed to sands. The properties of the particles are such that electro-chemical effects play a role in binding the particles together2. This makes that fine sediment in a sea bed has high resistance to erosion. Also if in suspension, the small and light particles make settling of sediment a slow process3.
2.1.1 Suspended sediment transport
Transport of fine sediment can be seen exclusively as suspended load transport, meaning that the sediment is in suspension and is transported by currents. It follows that fine sediment transport can be described by the following advection diffusion equation: c = mass concentration of sediment (kg m-3)
u, v, w = flow velocity components (m s-1) in stream wise (x), lateral (y) and vertical (z) direction
ws = settling velocity (m s-1)
2 The cohesive behavior is caused by the overall small size of the particles, meaning that electro-chemical
forces are relatively large. Also clay particles (particle diameter < 3.9 m) consists of flakes. The large surface-to-volume-ratio and the negative charge of these flakes enhance cohesion.
s,x, s,y,, s,z= eddy diffusivities in three directions (m2 s-1)
E = erosion source term (kg m-3 s-1) D = deposition sink term (kg m-3 s-1)
If vertical velocities in flow (w) can be disregarded, the distribution of fine sediment over the vertical in otherwise uniform equilibrium conditions can be described by:
,
As can be seen from equation (2) the distribution of suspended sediment is determined by the settling velocity causing the sediment to fall on the one hand and turbulent diffusion on the other. Suspended sediment concentrations are generally higher near the bed than higher in the vertical (because of the settling velocity) and turbulence thus has the net effect of transporting sediment upwards. Turbulence is generated by disturbances to the flow, i.e. rougher beds and high velocities cause high turbulence, causing high turbulent diffusivity. At the interface between the water and the bed, deposition (D) and erosion (E) can occur. Both can be described by the Partheniades-Krone formulations (Partheniades, 1965):
cz=0 = concentration near bed (z=0)
Bed shear stress ( b) is caused by shear velocity near the bed and the roughness of the
bed. Currents and waves cause velocities near the bed. The higher the velocities and the rougher the bed, the higher the bed shear stress will be. Erosion is a function of this bed shear stress as soon as the latter exceeds the critical bed shear stress for erosion. Deposition is a function of the suspended sediment concentration near the bed (determined by equation (2)) and the settling velocity.
2.1.2 Lag effects
Because of the specific properties of fine sediments, two lag effects exist:
Scour lag. Although easily kept in suspension, once settled fine sediment is difficult to erode. Hence, flow velocities can bring in sediment at incoming tide, but the same velocities at outgoing tide may not be able to generate enough bed shear stress to erode the then settled material.
2.1.3 Fine sediment in the Wadden Sea
The Wadden Sea is a tidal inlet, i.e. a shallow sea protected by barrier islands. The area is characterized by extensive intertidal flats and intersected by narrow deep gullies (or channels). Fine sediment transport in such an area is a very complicated process, involving many factors, see for example Vermeulen (2003) and Van Ledden (2003). Here it is most relevant to explain the seasonal variation in mud content on an intertidal flat. In general it can be stated that mud accretes on the intertidal flats during summer and is eroded during late autumn and winter months (Oost, 1995). This phenomenon is the result of weather patterns. As explained in section 2.1.1 erosion is a function of bed shear stress. In summer wind speeds (and thus waves and the corresponding velocities) are low and bed shear stress is dominated by current velocities (Janssen-Stelder, 2000). Currents are highest in the channels and as a result erosion is highest there. Deposition is more or less uniformly distributed between gullies and flats, mainly occurring during flood slack tide. The resulting net effect is deposition of fine sediment on the intertidal flats in summer, hence the name ‘mud flats’. In winter, wind speeds are much higher causing high waves. Waves cause orbital motions in the water, the velocities of these motions decrease with depth. The shallow intertidal flats will thus experience high bed shear stress during stormy conditions, as opposed to the deeper channels. Deposition is still more or less uniformly distributed, but erosion is now much higher on the intertidal flat. Overall the erosion has increased, leading to higher suspended sediment concentrations in winter. The net effect is that the intertidal flats erode and the fine sediment accumulates in the channels.
A final remark that needs to be made, is that the vertical distribution of sediment (in equilibrium) described by equation (2) is relatively uniform in the Wadden Sea. This has been concluded by Van Loon (2005) on theoretical grounds and measured by Ridderinkhof et al. (2000) on an intertidal flat. This phenomenon is caused by the low water depths and high turbulence levels in the Wadden Sea.
2.2 Blue mussel (Mytilus Edulis)
Figure 2: Mytilus Edulis selected anatomical features (image by Laura Smith, www.bumblebee.org)
Figure 3: Mussel filter feeding, arrows give the inflow and outflow of water (source: Johannesson et al., 2000).
Mussels feed on suspended phytoplankton by filtering water with the gills. The mussel mantel opens at the right side as displayed in Figure 2, in order to inhale water into the gill system. Water is exhaled by the exhalent siphon, see Figure 3. Suspended sediment particles also taken up by filtering activity are excreted as pseudofaeces (excreted before entering the intestines) and as faeces (excreted after ingestion). The deposition of sediment in this way is an important process, especially considering the large aggregations in which mussels live.
Mussels rarely live alone, but usually form large colonies. Although mussels prefer a hard substrate to attach to, in the Wadden Sea mussel beds are found on the bare intertidal flat. Sediment can accumulate under these beds, elevating them above the rest of flat. The influence of these beds on fine sediment dynamics are explained in the next section.
2.3 Mechanisms of fine sediment influence
2.3.1 Effect on hydrodynamics
Fine sediment transport is largely determined by advection of suspended sediment with the flow, as is described in section 2.1. Where flow velocities are higher, erosion may take place; if flow velocities are lower the sediment can settle to the bed. The hydrodynamics thus play a governing role in fine sediment dynamics and rough elevated mussel beds can affect these hydrodynamics in a significant way. The mechanisms via which the flow (both on a large horizontal scale and on a local vertical scale) is influenced by mussel beds are explained in this section.
2.3.1.1 Influence on flow patterns
The flow is affected in a spatial sense by mussel beds. Mussel beds can measure up to hundreds of meters and even kilometers. The increased height of mussel beds above the surrounding sediment can be up to 0.5 m. Historically far higher elevations have been recorded (Flemming and Delafontaine, 1994). However mussel beds will never increase their height above mean sea level (McGrortyet al., 1993). This combined with the roughness of these beds, means that the flow is significantly impacted. The physical barrier presented by the mussel bed causes flow in front and behind the mussel bed (relative to the flow direction) to slow down. The flow is forced around the mussel bed, increasing flow velocities on the sides of the mussel bed. Faster flow causes more bed shear stress and thus more erosion, as described in section 2.1.1. The reduced flow in the wake of mussel beds means that more sediment is deposited and the potential for erosion is less. The flow over the bed is also hindered by the mussel bed roughness. The roughness of the mussel bed is caused by roughness elements which exert drag on the fluid. The roughness elements are mussel bed patches (see Figure 10) and the roughness of the shells. The distinction between form roughness of patches and roughness of shells is similar to how roughness is described for sandy bed forms: form roughness and grain roughness. Roughness slows down the flow and generates turbulence.
2.3.1.2 Turbulence production above mussels influencing deposition
2.3.1.3 Small scale hydrodynamics in between mussels influencing erosion
In this report a distinction will be made between the sediment in between the mussels and ‘mussel mud’. Mussel mud comes about as an effect of mussels climbing on top of the sediment deposited between them, thereby protecting the buried material. Figure 4 gives a cross section of a mussel bed, displaying the mussel mud and the mussel layer itself. The distinction between the mussel mud and the mussel layer is not absolute, especially for older mussel beds, dead shells will be present in the mussel mud. For a one-year-old mussel bed (as used in experiments presented by Van Duren, 2006) the (living) mussel layer is around 6 cm and has an estimated porosity of 68% (see Appendix A.2). For older or younger mussel beds these values are likely to be different. In between the mussels there is sufficient space for fine sediment.
Figure 4: Mussel bed schematic displaying the layer of mussels and the underlying mussel mud.
The potential for erosion of both the sediment between the mussel and the mussel mud has been investigated in Appendix A. It has been shown that the mussel mud will never erode as long as the mussels covering it remain; the material is simply too deep relative to the mussels to be sensitive to erosive forces. If during winter storms the mussels erode (see section 2.4.2), the mussel mud underneath will become exposed and erode as well. Appendix A further focuses on the erosion of the material in between the mussels. This erosion is an effect of the force that water exerts on the sediment. For a current dominated flat bed, bed shear stress (which is the primary agent for erosion, see equation (3)) can be described as:
2
In case of a mussel bed most of the shear stress exerted by the flow is absorbed by the mussels themselves, not by the sediment lying in between the mussels. This can be conceptualized by relating the bed shear stress not to the depth averaged velocity as in equation (5) but to the characteristic shear velocity flowing over the sediment in
between the mussels. Also turbulent eddies in between the mussels can temporarily increase those shear velocities near the bed, increasing bed shear stress. Using a numerical point model, it is shown in Appendix A that the two determining variables -shear velocity and turbulence - are highly variable with the mussel bed characteristics. In fact, depending on where the sediment is located vertically in between the mussels (i.e. close to the mussel tops, or buried deep in between) bed shear stresses can either increase or decrease in comparison with a bed without mussels. For example after high sedimentation, sediment is stacked high between the mussels, turbulent scouring will cause high erosion. On the other hand, after such erosion the remaining sediment is left deep between the mussels, where the coverage by the mussels prevents significant further erosion (i.e. only the mussel mud remains).
2.3.2 Biodeposition as deposition flux
A major contributor to fine sediment deposition in the mussel bed and its vicinity is biodeposition. Biodeposition is the process where indigestible or otherwise rejected particles from the inhaled fluid are excreted and deposited as (pseudo-)faecal pellets. This section describes the factors influencing biodeposition and the significance of biodeposition both in and outside the actual mussel bed.
Figure 5: Fluxes of fine sediment inhaled by a mussel (adapted from Widdows et al., 1979).
In Figure 5 the phenomenon of biodeposition production in mussels is described. The figure deals with suspended particulates (or seston), which is actually a combination of organic material (partly utilizable as food) and suspended sediment. The amount of water inhaled is given as the filtration rate in l h-1. It is displayed as a function of the concentration of suspended particulate material (mg l-1), the higher the concentration the lower the filtration rate, see Figure 5 A. Although other factors can influence the filtration rate, the main forcing of filtration rate is the concentration of suspended material (Tsuchiya, 1980). The filtration rate multiplied with the seston concentration gives the filtration rate in mg l-1, see Figure 5 B.
majority of excreted matter is pseudo-faeces. The rest of the material is ingested and excreted as faecal pellets.
Measurements of biodeposition rates have been carried out. A laboratory study by Tsuchiya (1980) found a result that can be translated5 into 375 g m-2 d-1. Field studies in the Wadden Sea and Eastern Scheldt estuary have consistently found lower values: 106-172 g m-2 d-1 by Dame and Dankers (1988)6 and 118 g m-2 d-1 (Prinset al., 1996). Using theoretical relations such as those proposed by Widdows et al. (1979), biodeposition flux can also be calculated by using the filtration rate, biomass per unit area, suspended sediment concentration and emersion time (when filtration is possible). Authors performing these calculations (Dankers et al., 1989, De Vries, personal communication; Prinset al., 1996) arrive at approximately the same values in the range 250-375 g m-2 d-1, for similar conditions. The discrepancy between observed values in the field and laboratory and theoretical results is most likely due to erosion of deposited material in the former case. It is thus assumed that the theoretical relations can be used to predict deposition rates due to biodeposition adequately. The most consistent and complete form of these relations has been presented by Widdowset al. (1979) and are also displayed (in simplified form) in Figure 5. These will be used when biodeposition fluxes are to be established for specific conditions later on in this report.
2.3.3 Properties of sediment in between mussels
The forces that are available for erosion of sediment in between mussels are explained in section 2.3.1.3. However as described by equation (3), erosion is a function of both the forces available ( b) and the sediment properties: erosion rate M and critical bed
shear stress e_crit. Due to biodeposition the sediment in mussel beds (both in between
the mussels and in the mussel mud) is composed of three parts all having their own properties: normal fine sediment, pseudofaeces and faecal pellets. It is argued by Risk and Moffat (1977) and Tsuchiya (1980) that pseudofaecal matter is relatively light and erodes more easily (smaller e_crit) than the sediment from which it is composed. Faecal
pellets on the other hand are heavier and more resistant to erosion (smaller e_crit)
(Rhoads, 1974). When erosion starts the larger pellets of the (pseudo-)faecal matter will erode faster (higher M) in comparison with normal fine sediment, simply because the ‘chunks’ that erode are larger. This can be summarized as follows:
Pseudo-faecal matter: low e_crit highM
Faecal pellets: high e_crit highM
Normal fine sediment: medium e_crit lowM
The relative volume fractions of these three constituents to the total amount of material are determined by local conditions, as explained in section 2.3.2. The properties of the composite sediment between mussels are determined by the properties of the constituents. A complicating effect is that the overall properties are not a simple weighted average. Interaction such as armoring, cohesion and compaction may play an important role. This makes the overall properties difficult to quantify. Given that the majority of the excreted material will be pseudo-faecal matter as opposed to faecal
5 Original source 0.2 – 7.7 mg (g body mass)-1 d-1, assuming 50 kg body weight/m2, see Tsuchiya (1980, p.
204). 6
pellets (see section 2.3.2); the expectation is that the sediment between mussels erodes more easily then the same sediment without biodeposition.
If sediment from in between mussels erodes, the material can be exported beyond the boundaries of the mussel bed. As a result, the changed properties of the material can have an effect outside the mussel bed. Especially faecal pellets can hold integrity for several days and settle faster than unbound fine sediment, as described by Giles (2006) and Oost (1995). Part of the fine sediment deposited in the vicinity of mussel beds will thus be composed of (pseudo-)faecal matter. Oost (1995) suggests that this effect is a reason for the high mud concentrations that are found in de vicinity of mussel beds, see Figure 6. It is expected that the extra deposition due to a slowing of the flow (as explained in section 2.3.1.1) also contributes to this phenomenon.
Figure 6: Sedimentary distribution relative to mussel beds during late summer in the Frisian inlet (reproduced from Oost, 1995, p. 368).
2.3.4 Conceptual model for fine sediment –mussel bed interaction
Figure 7: Schematic of mussel fine sediment interaction. On the left a schematic depiction of (from top to bottom) the water column, the mussels, the mussel mud and the original sediment.
The above figure describes how young mussels are able to create their own habitat by building and protecting a mussel mud layer. This process begins with deposition of fine sediment between the young mussels. The deposition flux is a combination of biodeposition and settling of particles without mussel influence (passive deposition). The amount of sediment available for deposition is limited by the amount that is brought in by currents; the currents in turn are influenced by the presence of the mussel bed, affecting deposition. The sediment in the mussel layer is decreased by erosion from in between the mussels.
The net amount of sediment that is deposited can be very large. Young mussels need to climb on top of the deposited material to avoid becoming smothered. Widdowset al. (2002) found that mussels can unbury themselves fast enough for this task. The sediment previously covering them settles down below the mussels, this is incorporated as settling/burying in Figure 7. The sediment in this mussel mud is essentially captured and will not erode as long as the mussels remain on top. Resuspension is weakened, because the sediment settles down during mussel migration upwards.
older mussels can die of smothering by sediment, especially if young mussels settle on top.
2.4 Mussel beds in the Wadden Sea
Mussels rarely live alone. Usually they form aggregations, in the Wadden Sea these aggregations are mussel beds which have settled on the soft substrate of the intertidal flat. This section gives a definition of such a mussel bed, explains how it is initiated and develops, describes the optimal conditions for a bed and finally gives an overview of the variety in coverage patterns. The development of mussel beds is relevant for the present study as the mobility of mussels determines the amount of sediment that can be deposited in the mussel mud (see section 2.3.4. The spatial patterns that mussel beds develop are also expected to play a role in sedimentation and erosion processes, as will be investigated later in this report.
2.4.1 Definition of a mussel bed
Brinkman et al. (2003) provide the following definition of a (mature) mussel bed (translated from Dutch):
“A mussel bed is a benthic community in which mussels are dominant and which consists of a clearly defined area of large and small patches of mussels, rising above the surrounding area and separated by open spaces.”
Mussel beds are not always continuous entities. Patchiness may break up the mussel bed into a large number of small islands. For practical purposes, mussel patches are considered part of a mussel bed when the distance between patches is no more than 25 m (Dankers et al., 2004b). Three stages in mussel beds can be recognized. Seed beds are beds newly populated by spatfall, which are very young mussels (5-10 mm). Young beds have survived a winter and the mussels are already much larger (2-3 cm). Finally,old beds have been present for multiple years and can contain more than one generation of mussels, the oldest of which are over 3 cm. Fully grown, mussels can be as large as 7 cm (Feyet al., 2006). How these different stages are linked is described in the following section.
2.4.2 Development of a mussel bed
The emergence and development of mussel beds in the Wadden Sea has been described by Dankers et al. (2004b). Here an overview of that description is given. Mussels start their life as larvae suspended in the water column. The larvae settle on a variety of relatively hard substrates7: for example old mussel beds, fields of sand mason, worm or cockle grounds. At this point the young mussels measure 1-1.5 mm. The settlement of these mussels is referred to as spatfall, which usually takes place around the end of June and the beginning of July. The amount of spatfall that takes place in a year is highly variable and is in part inversely dependent on the amount of mussels already present. The more mussels are already present in an environment, the more mussel larvae are filtered from suspension and eaten.
mechanism that drives the transition from a uniform bed to a patchy bed is still uncertain. Van de Koppel et al. (2005) propose that in particular cross current stripy patterns are the result of self-organization. Stripy patterns are an optimal and robust trade-off between mutual protection from erosion by waves and currents and competition between mussels for food. Dankers (personal communication) offers an alternative explanation: initial small variations in bed elevation cause small pools to form at falling tide. The remaining water is quickly depleted of food and oxygen, making it advantageous for the mussels to move to higher ground. This leads to a higher concentration of animals on the higher parts of the bed; these parts in turn are heightened further by biodeposition. Whatever the mechanism behind patterning in mussel beds is, mussel beds develop in their first few months from fully covered uniform beds, to partially covered patchy beds. Fine sediment is captured and trapped during this phase by the parts of the bed that are covered. The young and mobile mussels can climb on top of the deposited material until a layer of up to 30-40 cm above the surrounding flat has accumulated (Dankers et al., 2004b). This process has been described in 2.3.4.
The very soft mud underneath the young mussel beds makes these beds very unstable. Storms during winter are responsible for the loss of many of the young beds. Actually around 50% of the new mussel beds do not make it through the first winter (Dankers et al., 2004b; Steenbergen et al., 2006). The beds that do survive the winter storms receive an influx of sandy material and shell remains due to conditions favoring sediment mobility. These coarse particles stabilize the material under the mussel beds, making them more resistant to erosion.
After this first winter, development is less rapid and characterized by several phenomena. Mussels become older and less mobile. The effect is that the mussels will no longer climb on top of the sediment, tempering the heightening of the bed, see also section 2.3.4. There is an advantage to not continuing to rise. Mussel beds have a more or less ideal height at mean sea level (McGrortyet al., 1993). There is always a tradeoff between the amount of time emerged (not being able to feed) an the amount of time submerged, being able to feed but also at risk from starfish and crabs (Brinkmanet al., 2002). Mussels grow larger, but increasing mortality results in a decrease in the number of individuals per area. Incidental winter erosion or mortality means that the patches become smaller, thus overall coverage goes down. New spatfall can add a new year class to the mussel bed, increasing coverage and density.
Mussel beds usually do not reach a stable equilibrium state over time. Older parts of the mussel bed can be covered by large amounts of spatfall. In such case the deposition by the spatfall can smother the mussels below. This can lead to total erosion of the bed, as the mussels underneath die and release their byssal threads. In other cases large parts of older beds are simply lost due to erosion. However, often other parts of the bed survive and sometimes the old mud mounts are recolonized by spatfall. The changes in coverage of older mussel bed remain very dynamic and mussel beds can disappear as easily as new growth through spatfall can occur.
2.4.3 Habitat
locations for mussel beds, the correlations on which this model is based are presented in Figure 8.
Figure 8: Relative appearance of mussel beds (m2 m-2) related to five abiotic variables. Flow velocity and orbital velocity are the maximum values attained during respectively springtide and a storm. The distance to gully is measured at mean low water level. Source: Brinkman et al. (2002, p. 67).
2.4.4 Mussel bed patterns
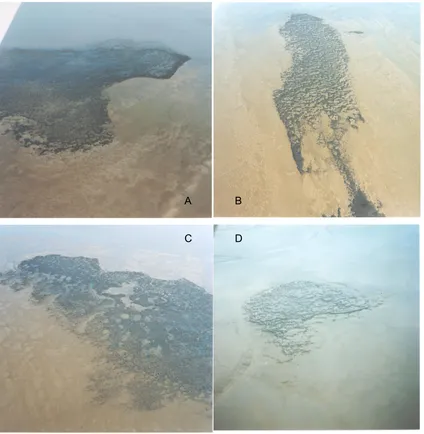
Figure 9: Selection of seed mussel beds photographed in November 1994 (except D) after dense spatfall, before winter erosion. A: near the island of Griend, south of Terschelling; B: south of Ameland. C: near the ‘Molengat’ gully near Ameland and D: near the ‘Piet Scheve’ tidal flat south of Ameland (photographed in April, 1997), photographs provided by Norbert Dankers. Depicted areas are around 500 x 500 m.
The photographs are taken from the side window of an airplane8. They give a good overview of the wide variety in both the patterns, configurations and forms of mussel beds. Figure 9 A B and C give seed beds before winter. The characteristic shared by these beds, is that they have a relatively high coverage. Patterns are very different, the bed in A has more or less irregular patches; the bed in B has striped features, where large areas of the bed in C are uniformly covered. Figure 9 displays another feature that is often seen in mussel beds, a uniformly covered band near the edge of the mussel
8
Photographs have also been taken straight down, from cameras underneath an airplane. These photographs are more suitable for analysis and have been used as such by Dankerset al. (2004b).
A B
bed. This band is often on the side of the gully. Finally photograph D has been included to give an idea of the extent of winter erosion due to storms. The mussel bed has much less coverage and the mud has been eroded, showing sandy substrate around the mussel bed.
Figure 10: Patterning in seed mussel beds: A: (nearly) uniformly covered; B: striped pattern and C: random patchy pattern. Photographs provide by Norbert Dankers. Estimated dimensions A: 30 x 30 m , B and C: 75 x 75m.
Figure 10 gives zoomed images of mussel beds showing different patterns. In general the mussel bed system moves from the uniformly covered state depicted in Figure 10 A, to a partial coverage, whether this is striped as seen in B or irregular as in C. A distinction has been made between striped and random patterns. This distinction is not absolute. Many more or less random patterns show some striped features, while none of the striped beds are without irregularities (Van de Koppel et al., 2005, p. E67). The cross sections in Figure 11 give an idea of both the variety and spatial scale of different patterns. Individual patches measure up to around 10 m.
2.5 Conclusions
It has been established in this chapter that there are three main mechanisms by which mussel beds influence fine sediment dynamics:
1) The first is by being a large rough obstacle in the flow, influencing horizontal flow patterns and increasing local mixing. These hydrodynamic effects force fine sediment dynamics, determining the amount of sediment available for interaction above the mussel bed. The roughness of the mussel bed is a very important variable in this process.
2) Mussels influence erosion processes. Mussel mud lying deep in between mussels cannot erode, sediment in between mussels can. Erosion from the latter source can either be faster or slower as compared with an empty bed, depending on mussel bed characteristics and the position of the sediment. 3) Biodeposition constitutes a substantial deposition flux to the bed. Tools for
theoretically deriving biodeposition rates have been presented together with results from both field and laboratory experiments studying this process. The deposited pseudo-faecal matter has substantially different characteristics than normal fine sediment.
The mechanisms of fine sediment-mussel bed interaction have been brought together in a conceptual model which will be used as a guide in Chapter 3 where the mussel beds influence on fine sediment is modeled.
Next to the basic mechanism by which mussel beds interact with fine sediment, it is important to understand the development and spatial dimensions of mussel beds in the Wadden Sea. Together with the proposed conceptual model, these conclusions will be used later in this report in devising and evaluating a mussel bed model implementation and a mudflat model suitable as mussel bed habitat. It can be concluded from the second part of this chapter that:
4) The size of mussel beds ranges in the hundreds of meters and even kilometers large. The mussel bed habitat in the Wadden Sea is characterized by (among others) a maximum flow velocity of around 50 cm/s, a closeness to gullies of a few hundred meters and an emersion time of around 40%.
5) During the first months of existence (always in late summer), mussel beds capture large amounts of sediment, up to 30-40 cm in roughly four months. 6) During the same period different patterns in the covering of mussels emerge,
ranging from uniform to regularly striped and randomly patchy. The scale of these patches is up to around 10 m.
7) In the first winter around 50% of young mussel beds, including the accumulated fine sediment in the mussel mud, are eroded.
3
Model implementation of a mussel bed
In order to investigate the mussel beds influence on the fine sediment dynamics of an intertidal flat using a model - both with regard to net retention of sediment and the spatial pattern of that influence – a mussel bed needs to be implemented. Because it has proven difficult to establish values for important parameters such as roughness and erosion rate from theory (see Chapter 2) or empirically (see Appendix B), estimations of these values will be given. This chapter deals with the implementation of a mussel bed in Delft3D-FLOW. The spatial effects on flow and sediment dynamics will be evaluated in simulations with Delft3D-FLOW (from now on referred to as Delft3D).
The model implementation proposed here will be designed for a specific application. The implementation will be averaged and thus suited for application in a depth-averaged model. This is possible for two reasons. First of all it has been shown in section 2.1.3 that the fine sediment in the Wadden Sea is generally well mixed over the vertical. Secondly, it has been demonstrated in Appendix B.4 that turbulence levels above mussels are very high. It is thus unlikely that vertical depletion of sediment near the bed will occur due to filtration, i.e. the suspended sediment over the mussel bed can also be assumed to be well mixed.
A further specification of the implementation is that it will be designed for current dominated conditions, occurring during the calm summer months. It is assumed that the phase where young mussel beds capture large amounts of sediment is most important with regard to fine sediment dynamics on an estuarine scale. The stormy winter season causes many of the young mussel beds to erode completely; this process is not considered as part of this project. As a result of the choice for current dominant conditions, the effects of waves are disregarded. It is shown in Appendix B.5 that even small waves can result in significant erosion from mussel beds. Because of the exclusive focus on currents this phenomenon is disregarded; for a further discussion of this choice also with regard to in winter erosion, see Chapter 7.
3.1 Basic implementation in Delft3D
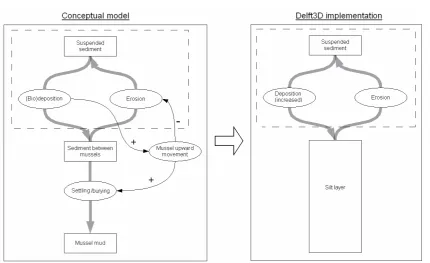
Figure 12: Conceptual model and Delft3D implementation of sediment dynamics over and in a mussel bed.
There are differences between the conceptual model of Chapter 2 and the proposed Delft3D implementation. The most obvious is the omission of the actual mussel layer. There is no difference between the sediment stored in between the mussels and the mussel mud. Furthermore the mussel upward migration is not simulated as such. This seems to be a highly simplified implementation, however given a few assumptions this system will incorporate most features of the conceptual model:
1) Mussel vertical migration instantly follows changes in bed level
The first assumption eliminates the need to simulate mussel upward migration as such. It also follows that the erosion from the bed is constant with constant velocities, as the top of the sediment remains at a constant distance from the tops of the mussels. In reality there is a limit on erosion at the moment that all erodible sediment between the mussels has gone. This is not a significant problem because of the second assumption:
2) There is significantly more sedimentation than erosion in the mussel bed The second assumption implies that even though in principle the model implementation allows the mussel mud to erode, this will never happen in the model. In other words the limit to erosion is never reached as no extensive erosion will occur. The assumption is justified because of the choice to focus on calm summer months. It has been explained in section 2.1.3, that during such current dominated conditions, intertidal flats experience net accretion of fine sediment. A further simplification is applied which is not apparent from Figure 12: the transformation of sediment into (pseudo-)faecal pellets is not taken into account. Resuspended material enters the water column as normal sediment. Only the effect of biodeposition on sediment properties in between the mussels will be accounted for.
3.2 Hydrodynamic implementation of a mussel bed
Hydrodynamic effects play a significant role in the system to be modeled. As has been explained in Chapter 2, there are three hydrodynamic processes influenced by mussel beds that require attention: (1) the resistance of the bed to flow (caused both by mussel bed height and roughness), (2) the high turbulence (caused by high roughness and siphon currents) mixing suspended sediment and (3) the influence of mussel shells on near bed velocities and turbulence affecting erosion. Because a depth averaged model is used, the water column is already assumed to be well mixed, which means that the second issue can be disregarded. The following three (hydrodynamic) influences remain to be implemented: an elevated mussel bed height, the mussel bed roughness and the erosive forces in between the mussels.
3.2.1 Mussel bed height
A feature of mussel beds is the increased height of the areas covered with mussels, compared to the surrounding area. The height of mussel beds can be implemented by simply elevating the bed level in the bathymetry in Delft3D at the mussel bed location. This is achieved by allowing the mussel bed to capture sediment in a morphodynamic model computation. After a given number of flow time steps, the bathymetry is automatically updated dependent on the amount of deposition and erosion. In such a computation Delft3D itself will calculate the development of a young mussel bed which will rise relative to the surrounding flat. The mussel bed height is thus both a result of the model (as it is dependent on the amount of sediment captured in the bed) and an influence (as it presents a barrier to the flow).
3.2.2 Mussel bed roughness
The roughness of a bed is usually expressed as the depth dependent Chézy coefficient (C), which determines for a given depth averaged velocity the bed shear stress. This bed shear stress is both exerted on the flow (which experiences drag) and on the bed (which can experience erosion). The roughness of the mussel bed will be implemented by the trachytope functionality. This feature of Delft3D is explained in Appendix C.4. The trachytope functionality has been designed to implement the roughness caused by vegetation in depth averaged model computations. It computes, based on certain plant characteristics a representative roughness (Cr). Combined with a certain depth average
velocity Delft3D computes the total shear stress experienced by the flow ( t), see
Appendix C.1. This total shear stress is actually composed of a bed shear stress on the vegetation ( v) and on the bed in between the vegetation ( bv). Only the latter is
available as an erosive force on the sediment, the former is absorbed by vegetation or in this case by mussels. The combined stress ( t) experienced by the flow and is much
larger than the shear stress the same flow would experience over an unvegetated bed, see Figure 13, becauseCris much larger than the Chézy roughness of an unvegetated
bed. The trachytope functionality is used because it allows the implementation of a large roughness (of a vegetated bed simulating a bed with mussels), while simultaneously limiting the force on the sediment in between the vegetation ( bv). In
Figure 13: Shear stress on vegetation and underlying bed for a vegetated bed as compared with flow over an empty unvegetated bed.
The specific formulation proposed by Baptist (2005) will be used in the trachytope functionality (see Appendix C.4). Depending on vegetation characteristics it computes a representative roughness and uses a fixed fraction (the reduction factor, again determined by vegetation characteristics) of total stress t to determine bv, which is the
force available for erosion, see equation (9). The predictive power (only validated for relatively thin long vegetation) of the equations by Baptist (2005) will not be used. Instead, by adjusting the plant characteristics, a predetermined roughness representative for mussels and a reduction factor will be imposed. The former will be determined in the remainder of this section; the latter is explained in the next section. The used plant characteristics have no bearing on mussel characteristics.
It has been attempted to establish the value of mussel bed roughness by analysis of data from experiments of flow over mussels (presented in Appendix B). This attempt has been proven unsuccessful. As a result the value of mussel bed roughness is both uncertain and variable. There is uncertainty in the sense the experiments aiming to establish the value of the roughness of mussel beds, have proven unable to do so. There is great variability in the sense that the population diversity in a mussel bed can be highly variable. Mussels grow, also older and younger mussels usually live together. As has been shown by the De Vries experiments in Appendix B, high sedimentation (of pseudo-faecal mimics) between the mussels makes the bed less rough. Because of these reasons the value of the roughness parameter will be varied later on, as part of the sensitivity analysis. In order to estimate an initial value for mussel bed roughness, it is assumed that the mussel shell roughness is similar to the roughness induced by randomly placed stones. The roughness length (z0, which is a measure for roughness, see also equation (17)) can then be estimated using the equation suggested by Hofland (2005, p. 10):
0
10
d
z
(6)Where:
d = height of roughness elements;
0
30
3
s
k
z
d
(7)The above equation is similar to the equation used for estimating roughness of sandy beds: ks = 3 · D90, where D90 is the grain size that is not exceeded by 90% of the
sediment mixture. The height of the roughness elements (d) is assumed to correspond to the length of individual mussels. It is further assumed that the largest mussels in a bed will determine the roughness of such a bed. A young mussel has a shell length of around 30 mm, although the spatfall existing during the first weeks of the mussel bed is much smaller (5-10 mm, Dankerset al., 1989). In this early stage the roughness of the bed may be determined more by the way these young mussels organize themselves and by the form of the underlying bed. For example, it is known that spatfall often settles on old shells, sand mason fields or cockle grounds (Dankers et al., 2004b). In such cases the underlying roughness elements determine the roughness and have dimensions at least in the same range as the more mature mussels. As such a 30 mm roughness length is considered a good estimate in this variable and uncertain situation. Following equation (7) it is found that the Nikuradse roughness length (ks) is then 0.09
m. This value can be imposed on the location of mussel bed via the trachytope functionality. Delft3D computes the Chézy roughness coefficient (C) from ks following
the White Colebrook equation (8).
3.2.3 Bed shear stress on sediment between mussels
The erosive forces between mussels form a complex interplay of shear velocities and near bed turbulence, as presented in section 2.3.1.3 and explained in Appendix A. A mudflat model in Delft3D does not have the resolution to compute velocities and turbulence at this scale, especially not in a depth averaged model. Furthermore erosion in Delft3D is solely a function of the bed shear stress, which is caused by either currents or waves, but not enhanced by turbulence. The erosive forces are thus restricted to the bed shear stress on the sediment between the mussels. The equation for bed shear stress proposed by Baptist (2005) implemented in the trachytope functionality has the following form (see Appendix C.4 for more details):
bv
f
t (9)Where:
bv =bed shear stress on sediment between vegetation (N m-2) f = reduction factor (-), based on vegetation characteristics.
t = total shear stress (N m-2) on bed and vegetation defined as:
2
r
As has been explained in section 2.3.1.3 there is no reason to assume that on average erosion from in between mussels will be either higher or lower than on a flat bed. Therefore it is assumed that bed shear stress on the sediment between mussels is as high as on an empty bed with an equal depth averaged flow velocity. The vegetation characteristics in the trachytope functionality will be chosen in such a manner that this equality is simulated9. In words related to Figure 13, f is chosen so that for an equal depth averaged velocity U, bv on the vegetated bed is equal to b on the unvegetated
bed.
3.3 Biodeposition in Delft3D
3.3.1 Adding a biodeposition term to Delft3D
The three dimensional diffusion advection equation for suspended sediment transport, presented in section 2.1.1, is simplified in a depth averaged Delft3D model, see equation (36) in Appendix C.5. Deposition is represented as a sink term (D). In the case of a mussel bed an extra termDbio is added to simulate biodeposition:
, ,
c = mass concentration of sediment (kg m-3) u, v = flow velocity components (m s-1)
s,x, s,y= eddy diffusivities in three directions (m2 s-1)
E = erosion (kg m-3 s-1) D = deposition (kg m-3 s-1) Dbio = biodeposition (kg m-3 s-1)
Deposition is described in Delft3D as:
s
D w c
(11)Where:
ws = settling velocity (m s-1)
Biodeposition can be defined in a similar form. Defining a filtration rate fr as a volume per time per area, the biodeposition term becomes:
bio
D
fr c
(12)Where:
9 The total bed shear stress on a mussel bed and the bed shear stress on an empty bed computed via
fr = filtration rate (m3 s-1 m-2, or m s-1)
Note that in both deposition terms the depth averaged concentration is used, i.e. the suspended sediment concentration is assumed uniform over the vertical. The similar form of equations (11) and (12) makes it possible to add the two terms together, into a combined deposition term:
(
)
total bio s s
D
D D
w c
fr c
w
fr c
(13)If the filtration rate is taken as a constant - which is a slight simplification as in reality it varies with amount of suspended material – and the settling velocity as well (neglecting hindered settling and flocculation), the two can be added together. Biodeposition can thus be simulated by locally (over the mussel bed) increasing the settling velocity with the filtration ratefr. The source code of Delft3D has been adapted in order to simulate biodeposition in this manner.
3.3.2 Estimating filtration rate
Filtration rate is inversely related with the suspended material concentration. Also it is the case that many seed mussel beds have a higher combined filtration rate than the lower densities of young and mature mussels (Dankers, personal communication). The latter phenomenon is neglected simply due to a lack of information. Instead the mussel bed used in the experiments by Van Duren (2006) will be taken as a guideline and it is assumed that this also represents biodeposition for very young mussel beds.
Relations between sediment concentration and filtration rates are displayed in Figure 14. There are other sources treating filtration rate, for an overview see Jörgensen (1996). The laboratory studies carried out by Widdows et al. (1979) are used here because they incorporate the relevant variables: suspended particulate matter and mussel size. Jörgensen (1996) compares laboratory measurements with field experiments and shows that in laboratories clearance rates (not pumping rates) are overestimated, because refiltration of water can occur in dense mussel beds. From analysis of the data mentioned by Jörgensen (1996) it can be deduced that the overestimation is around 50%.
The suspended sediment concentration that will be applied in the model has a maximum of 50 mg l-1 (see Chapter 4). As the mussels used by Van Duren were on average 38 mm long, a filtration rate of 2 l h-1 ind-1 will be used. Using a density of 1800 ind m-2, this gives a filtration rate of 3600 l h-1 m-2, or 0.001 m3 s-1 m-2 or 1 mm s-1. Considering that some of the filtered water will be re-filtered, the effective filtration rate is lower: 0.5 mm s-1. This value is similar to settling velocities often used for Wadden Sea fine sediment: 0.5 mm s-1 (see Chapter 4). The observation by Ten Brinke et al. (1995) that biodeposition and passive deposition contribute roughly equal amounts to total deposition is here confirmed.
3.3.3 Implementing properties of (pseudo-)faecal matter in sediment
Biodeposition is more than an extra sediment flux to the bed as presented in the previous section, the properties of (pseudo-)faecal matter are very different compared to normal sediment. This will be simulated by adjusting the sediment properties in the mussel bed. Erosion at a given bed shear stress is determined by Delft3D by two such properties: the critical bed shear stress ( e_crit) which determines whether the sediment
erodes and the erosion rate (M) which determines how quickly the sediment will erode, see section 2.1.1. The sediment in between mussels is composed of roughly 50% biodeposited material10, which is built up out of pseudofaeces and faecal pellets. The properties of these constituents are presented in section 2.3.3. In relation to sediment without biodeposited material, pseudo-faecal and faecal pellets have a high erosion rate and have respectively a low and high critical bed shear stress. As a first estimate it is thus assumed that the critical bed shear stress of the average behavior of sediment in between mussels is equal to that of normal sediment. The erosion rate is chosen higher. For fine sediment in the Wadden Sea values of e_crit = 0.5 N m-2 andM = 1 · 10 -4 kg m-2 s-1 are used (see Chapter 4). For the sediment in between mussels
e_crit = 0.5
N m-2 andM = 4 · 10-4 kg m-2 s-1 are used. Delft3D provides the option to spatially vary erosion rate and critical bed shear stress.
10 Considering that the biodeposition flux is roughly equal in size to the normal deposition flux (both
4 Model
set-up
The model set-up as implemented in Delft3D is presented in this chapter. The model should represent a typical mussel inhabited mud flat. The model should also facilitate the investigation of the mussel bed implementation as proposed in Chapter 3. To satisfy the second objective the model should be simple enough to easily differentiate between effects on fine sediment dynamics caused by the mussel bed and those attributable to choices in the model domain and boundaries. This second requirement suggests the use of an idealized model. The goal of this chapter is therefore to set-up an idealized model of a typical mussel inhabited mud flat.
The choice for an idealized model removes the problems of obtaining data of such mussel beds (although some bathymetry readings exist (Van Eijsbergen and Veeken, 2005; Ten Haaf and Karels, 2005)). However it also gives a great range of freedom in choosing the characteristics of the model area. This range is somewhat constricted by the stated goal of modeling a typical mussel inhabited mudflat. Brinkmanet al. (2002) correlated the historical spatial occurrence of mussel beds with the physical conditions in the Wadden Sea. The results of this study are presented in Figure 8 in Chapter 2. In order to justify the qualification of the used idealized model as a typical mussel habitat, it should as a minimum conform to the habitat demands posed by mussels. The mussel habitat demands have also been translated into habitat suitability maps by Brinkmanet al.(2002). These maps combined with historical records of mussel bed locations show that the area of the Wadden Sea south of Ameland is a fertile ground for mussel beds. The area is displayed in Figure 15. The mussel grounds on the south coast of Ameland will serve as a guideline for designing an idealized mudflat model.
Figure 15: Left: aerial photograph of the Wadden Sea south of the barrier island Ameland (source: Google.maps). Right: the suitability of this area for mussel beds as predicted by Brinkman et al. (2002). The colors give the suitability where as the dots give known (historical) mussel bed sites.
4.1 Model area
4.1.1 Model location and dimensions
An area of the south coast of Ameland is used as an example of a suitable mussel habitat. Figure 16 shows bathymetric data of this area. A transect of the mudflat bordering the south coast of Ameland is selected and presented separately in the same figure. This transect is chosen because of the simple geometry and the suitability as habitat for mussels. The transect shows two distinct sections, the mudflat with a gradient of approximately 1:1000 and the channel with a much steeper gradient (approximately 1:50).
Figure 16: Left: bathymetry of area around Ameland relative to mean sea level. Bathymetry from JARKUS (yearly coastal measurement program in the Netherlands), combined measurements from the summers of 2005 and 2006. Right: bed level along transect.
Only a section of the above presented area will be modeled in this study. Mussel beds are found near the edge of the flat near the channel. This is important, as close to the channel the flooding and drying tide is forced from the deeper channel. A bed can have a length of over a kilometer, however usually the dimensions range in the hundreds of meters (see Dankers et al., 2004b). Here a relatively small mussel bed will be implemented with maximum dimensions of 150x50 m. This size is the result of practical considerations of computation time and of the expectation that a much larger bed will not yield additional insights.
The dimensions of the model area should be large enough to avoid boundary effects influencing the area of interest. Boundary effects are influences of discrepancy between imposed boundary conditions and processes computed in the model near the boundaries. The dominant boundary effect in this particular situation is the suspended sediment concentration. Concentrations uniform in time will be imposed at the model boundaries; these do not match the model behavior where concentrations vary with flow velocities. This means that the suspended sediment concentrations need space to adjust to the flow conditions. The model domain should allow room for the adjustment length over which the concentrations adapt. Considering these processes and the planned properties of the model the dimensions are chosen as 2250 x 300 m (see Appendix D.1 for the calculation of the adjustment lengths).
4.1.2 Grid and Bathymetry
in the model center. The second grid has grid size of 2x2 m so that it can be used to model mussel bed patches as small as 10 m (bathymetric features should be covered by at least 5 grid cells). The disadvantage of the second grid is that computation time is increased by more than an order of magnitude. Both grids have a decreasing resolution when approaching the model boundaries. The two grids are presented in Appendix D.1 and pass the applying quality criteria as defined by WL|Delft Hydraulics (2006, p. 4-13). A mudflat profile is set-up that will be applied uniformly in the long shore direction. The near channel part of the tidal flat (slope 1:1000) and a part of the channel have been incorporated (slope 1:50) in this profile, similar to the transect shown in Figure 16. The channel has been incorporated for a number of reasons. A tidal wave propagation velocity is limited by the available flow depth. This means that the tidal wave will travel faster in the channel than on the flat, resulting in higher velocities in the channel. Advection will ensure that on near channel flats high velocities will also occur. Mussel beds are located in this area and thus experience relatively high velocities. Also, by including the channel, the flat will flood from the channel, instead of directly following the imposed boundary conditions. This has the advantage that errors in the boundary conditions have a more limited influence on the processes on the flat. The entire profile and the cross section are presented in Figure 17 below.
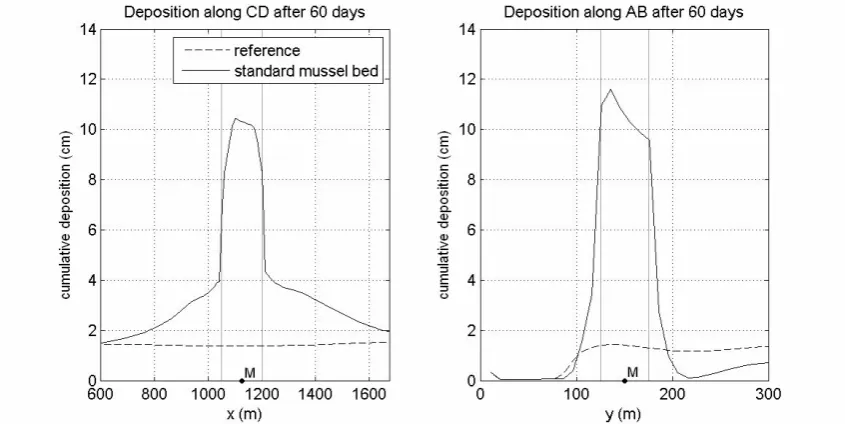
Figure 17: Left: overview of model area with the channel to the south. Right: cross section of bed level with the channel on the left. Cross section A-B and C-D and point M are included for later reference. Note the definition of x and y-axis and (x,y) = (0,0) at origin (O). Lower left corner of the mussel bed is located at (x, y) = (1050, 125).
The above presented combination of the bathymetry and the computational grid means that the mussel bed will lie around 100 m from the gully. According to Brinkman et al. (2002) mussel beds are located close to channels, where according to his analysis this closeness is in the order of hundreds of meters. The distance of 100 m falls within this range.
4.2 Hydrodynamic model set-up
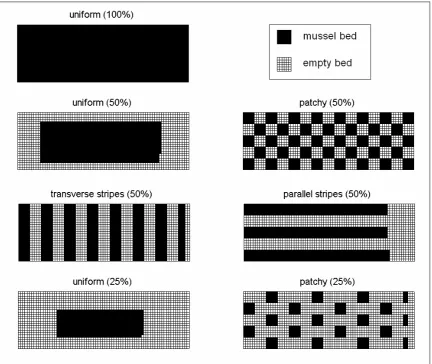
4.2.1 Hydrodynamic boundary conditions
When an open north boundary is used the velocities over that boundary remain very small (results not shown here), the error induced by keeping the boundary closed is thus small.
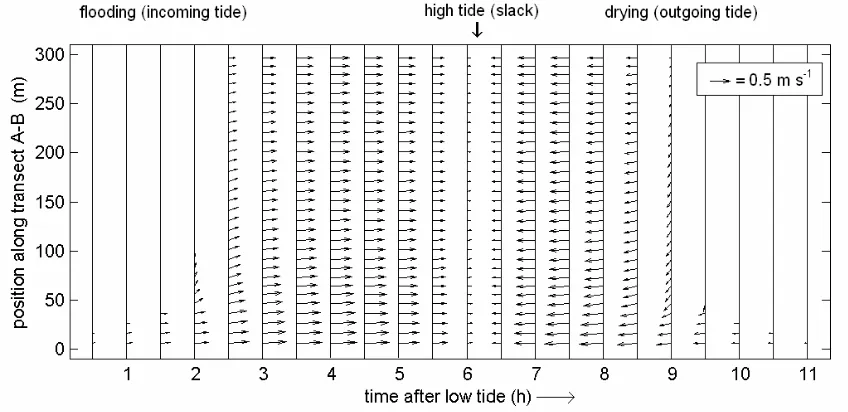
Figure 18: Water level, (m), boundaries.
Because in tidal inlets the tide comes in following the tidal channels, main flooding velocities are parallel to the channel11. A simple harmonic tide will thus be imposed propagating from west to east. At a specific point at the boundary the imposed water level is described by the following equation:
( , )
x t
A
cos(
t kx
)
(14)Where:
= water level relative to reference plane (m) A = tidal amplitude (m)
= tidal frequency = 2 /T (rad s-1) T = tidal period (s)
k = tidal wave number = 2 /L (rad m-1) L = tidal wave length (m)
x = distance parallel to channel, refer to Figure 17 (m)
The tidal forcing is uniform in y-direction, as can be concluded from the absence of y in equation (14). The West and East boundaries are thus spatially uniform and only time dependent12. The channel boundary is situated in x direction and is both time and spatially variable, forcing the tidal wave along the model domain. A period (T) of 12 hours for the tide is chosen and an amplitude (A) of 1.5 m. The tide in the Wadden Sea is not harmonic, but the values represent an approximation of Wadden Sea conditions. The tidal wave length (L) has been calibrated to generate current velocities of 0.5 m s-1 (corresponding with mussel habitat optimum, see Figure 8) at the mussel bed location: L = 147 km. Equation (14) can thus be applied using, A=1.5 m, =1.45·10-4 rad s-1 and k=4.27·10-5. With these tidal characteristics the wave is forced at the desired speed trough the model. Furthermore the channel position 1.6 m below reference will always carry water, which is desirable for numerical reasons.
11 This has been checked by using the Wadden Sea model used in the study of Borsje (2006) and in flow
computations presented in RIKZ (1998).
12As explained earlier the tidal wave is forced from the channel and as an effect it is expected that the wave
4.2.2 Physical parameters
Delft3D resolves the water motion based on the presented bathymetry and boundary conditions and is further determined by the setting of a range of physical parameters. The parameter values are listed in Appendix D. Here the parameters that require justification are treated.
A uniform bottom roughness is implemented. This value is overruled in those cells where the trachytope functionality is imposed. A Nikuradse roughness length (ks) of 0.005 m, or 5 mm, is used. This implies that the model computes bed resistance using the White Colebrook formulation, see equation (8). The chosen roughness length is relatively smooth, which corresponds with the slick surface of a mud flat. Paarlberg et al. (2005) used the same roughness length for a muddy intertidal flat in the Western Scheldt estuary.
Horizontal viscosity ( h) determines the diffusive part of the impulse equations given in
Appendix C.1 as equations (25) and (26). The parameters should take into account the grid size dimensions. Small grid cells can resolve advection at finer scales and thus require less compensation by horizontal viscosity. For models of the scale used here (order of tens of meters grid size), uniform horizontal viscosities of 1-10 m2 s-1 are recommended (WL|Delft Hydraulics, 2006, p 4-60). A value of 1 m2 s-1 has been chosen, it has been found that a value of 10 m2 s-1 does not lead to significant changes in the resulting hydrodynamics. It has also been investigated whether the abrupt edges of the mussel bed create horizontal turbulence that should be accounted for. A Large Eddy Simulation (LES, described and tested by Uittenbogaard (1998) and Van Vossen (2000