A user self-reported emotion
feedback system
Bachelor Thesis for Creative Technology by Ruben Brouwer
S1701355 Dyslexic
Abstract
The Escalade, a prototype wearable with various sensors, shows great implementations for a mood-sensing method. Mood-sensing is important since it contains vital information useful in many professions and applications generating self-awareness, regarding communication, improving treatments in the therapeutic industry and optimising the caregiver-patient relationship to help promote general well being.
One promising way to develop a mood-sensing method is a combination of the Escalade and machine learning. For making use of machine learning, you need a labelled dataset. A
combination of physiological sensor data and mood labels to train an AI agent is achievable. Acquiring a mood label is challenging, since collecting spontaneous emotions and self-reported emotions are hard. The user should also be willing to give this self-reported emotion. The focus of this thesis is how to design an engaging mood experience self-sampling system and how to implement this in a prototype. To do so a combination of background research, state of the art research and many design techniques are used. This with a focus on hallway usability tests and user tests. Following from this a prototype is built and evaluated.
The evaluation stated that however, the sample size is small, the prototype meets most
Acknowledgements
There are several people I would like to thank for helping me with this project.
First of all, I would like to thank dr.ir. Edwin Dertien, the supervisor of this project, who offered feedback and guidance throughout this project. The weekly meetings helped me to stay on track and allowed me to finish the various phases in the correct order instead of directly starting by creating prototypes.
Second, I would like to thank Kristin Neidlinger, founder of Sensoree, for her involvement in the project. The brainstorms and feedback helped to determine the project and its direction.
Thirdly, I would like to thank dr. K.P. Truong, the critical observer, for helping me determine the project direction and help me out when I got lost focus in the background research phase.
6.1 Programming language 58
6.2 Wristband 58
6.3 Update Escalade 60
6.3 Software 61
6.4 Bluetooth protocol for mac 61
6.5 Generated data 61
7. Evaluation 63
7.1 Functional test 63
7.2 User test 64
7.3 Discussion 65
7.4 Conclusion 66
7.5 requirements fourth iteration 66
8. Conclusion and recommendation 68
8.1 Conclusion 68
8.2 Recommendations 69
Appendix 70
A. Mind Map 70
B. Brainstorm 70
C. Expert meeting Troung 72
D. Brainstorm 80
E. First usability test 81
F. Second usability test 99
G. Emoji emotion questionnaire 111
H. Prototype 122
I. User test 137
J. Used Methods and Techniques 150
user self-reported emotion feedback system. This feedback system should collect spontaneous emotions with a focus on keeping users motivated and interested.
Ideally, the label is obtained by asking users for self-reported mood samples at the moment after a change happens in the obtained biosignals. Other options are at random moments or at a set time.
1.3 Research questions
The main research question of this thesis is how to design an engaging user self sampled mood feedback system system.
In support of the main research question sub-research questions are distinguished:
● What is the best technique to ask for mood feedback from the user?
● In relation to the to be used technique, what is the best location for the to design self sampled mood feedback system?
● How to ask for mood feedback from the user?
● How to make the user be willing to give mood feedback? ● And lastly, how to put the findings into a prototype.
1.4 Report outline
This thesis is separated in eight chapters. Chapter one, which is ending here, is focussing on introducing the problem, goal and research questions.
when logging, especially when asking meaningful questions of the data. It is especially beneficial for caregivers to have the information to predict reoccurrences. (Neidlinger, 2018) Sensoree’s focus is therapeutic biomedia. Therapeutic biomedia uses physiological data, also named biodata, sensed by physiological sensors, also named biosensors, and visualises this data by making use of visual, auditory, or tactile (technological haptic) displays in textiles. Tangible displays creates instant biofeedback for the wearer and their surroundings but also serves as an external communication tool. Therapeutic biomedia is a combination of
gamification, healthcare and fashion, as seen in Figure 1 (Neidlinger, 2016). Sensoree believes therapeutic biomedia is the future of healthcare and therefore does research and building designs promoting extimacy.
Figure 1:Therapeutic biomedia diagram (Neidlinger, 2016)
Extimacy means externalised intimacy. According to Sensoree (2016), extimacy is promoted by devices that show how you feel on the inside. Intimacy means a private atmosphere, keeping your emotions to yourself, in contrast, extimacy means showing your emotions to others. Therefore, extimacy is a result of therapeutic biomedia.
Sensoree believes therapeutic biomedia is the future of healthcare and therefore doing research and building designs promoting extimacy. Extimacy gives a voice to people who find
communicating how they feel difficult. It also provides awareness with tangible biofeedback. This awareness could help improving someone’s EQ. Extimacy can help people with PTSD, Alzheimer’s and dementia. Next to this paediatrics can be made easier.
and testing the system. The abstract of Sierra et al.’s paper described that the system is based on fuzzy logic. Thirdly, Maaoui et al. (2009) used the Fisher linear discriminant and supporting vector machine method to classify emotional states. Lastly, research by Yand and Chao (2008) used Bayesian networks for continuous biodata analysis. However, the above-described studies vary in success regarding accuracy, their used way of subtracting mood from biodata gives insight into how to do so. More research on combinations of various methods will give new insights. In short, methods for subtracting mood from biodata are making databases, analysing data and using machine learning.
2.1.4 The Escalade
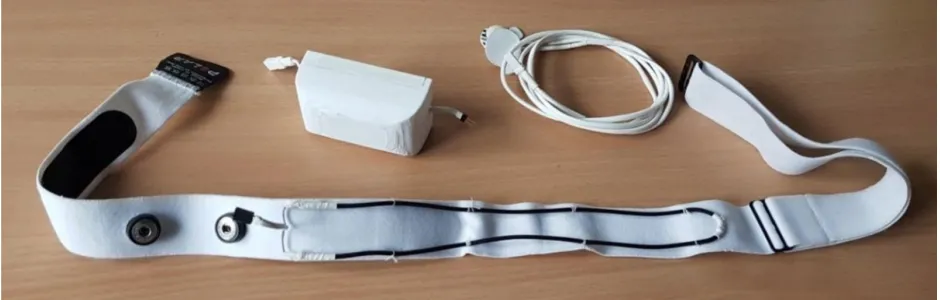
The Escalade is a prototype wearable with various sensors, combined for further research. The Escalade’s name is based on the Cadillac Escalade, their biggest SUV with the most options and sensors. The Escalades basic idea was to put as many as possible sensors in one design, to be able to see which combinations of sensors gave the best read of emotional data. Figure 2 shows the Escalade, a band with integrated sensors, casing with all major electronics and a power adaptor (Harmsen, 2017). To conclude, the Escalade is a prototype wearable with various sensors combined for further research on moods.
Figure 2:The complete Escalade sensor system, including the strap, the sensor and the EDA electrodes and wires. (E. Harmsen, 2017)
The Escalade is a combination of many sensors. The base is a Polar H7 chest strap with an integrated heartbeat sensor. This strap is updated with a stretch breath sensor thus capturing the breathing frequency and secures the electronic housing of the other sensors in a 3d printed housing. The Escalade prototype consists out of the following components;
The data and controlling components are:
● PJRC Teensy 3.2 microcontroller; ● SparkFun microSD Transflash Breakout; ● and a HC-05 Bluetooth module.
For sensing the Escalade makes use of the following:
represents a neutral valence and a medium level of arousal. Russell's circumplex model is used to test words that indicate emotions, facial expressions, and moods.
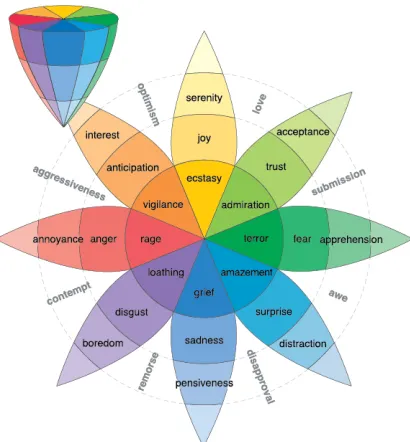
Thirdly, Plutchik (2001) identified eight basic emotions in an excessive emotion model: anger, disgust, fear, joy, sadness and surprise, trust and anticipation. His circumplex and three dimensional model in figure 4 is, however not cross-cultural, way more excessive as Ekman's. Plutchik's model shows the basic, mild and intense emotions concerning each other and also primary dyad’s.
Lastly, the PANA (positive activation and negative activation) model by Watson et al. (1988) describes that positive and negative effects are different systems in the brain. In the PANA model is based on two basic behavioural systems the Positive Activation (PA) and Negative Activation (NA). Positive activation links to terms of activation and excitement on one end and dull and sluggish on the other hand. Negative Activation links to terms as distress and nervous on one side and calm and relaxed on the other. These two behavioural systems are put on two axes to define the location of moods within the plot.
Thus, variations and differences of the described emotion models depend on the focus, age and kind of research. In conclusion, there is no such thing as the ideal model.
Figure 4. three dimensional circumplex model representing the mild, basic and intense emotions. (R. H. Plutchik, 2001, p 349)
2.1.8 EQ
EQ is the level of someone's ability to understand other people. Described by Akers and Porter
(2016) there are five major categories of EQ skills: self-awareness, self-regulation, motivation, empathy and social skills. These five categories will briefly be explained.
First of all, self-awareness is the ability to recognise emotions at the moment they happen. Evaluating your own emotions is required, so you can manage these. This is so called
emotional awareness. Another self awareness element is self-confidence: knowing your worth and capabilities. Self awareness is where mood recognition can help. If one is able to recognise and adapt to its own emotions, EQ could rise.
Secondly, self-regulation is all about changing the time and intensity of an emotion. Emotions occur whenever and one does not have much control over this. But there are techniques like meditation that can make the intensity of emotions less harmful.
Thirdly, motivation is the product of clear goals and a positive attitude towards the work that needs to be done. Changing negative thought and rephrase them into positive thought will help one to achieve goals. Another important category is empathy, this is the ability to recognise how other people feel. If you understand the others feelings, you can adapt to those. You can
change the signals about your own feelings towards them and in this way benefit.
And lastly, social skills like influence, communication, leadership, building bonds, etcetera. How well you succeed in daily life depends mostly on EQ. To be able to gain a high EQ one first needs to deal with himself, afterwards the ability to deal with other people can be expanded.
Figure 6. Abbreviated POMS Questionnaire. (R. Grove & H. Prapavessis,1993)
PANAS
The PANAS questionnaire and its other versions are popular within the field of mood experience sampling, but low activation feeling like calmness, happiness or sadness are not captured. The PANAS-X by Watson & Clark (1994), partly solves this problem. However, instead of 20 items, 60 items are captured to measure more low activation feelings as well a broader spectrum of PA and NA. Therefore PANAS-X is more time consuming than the regular PANAS questionnaire.
PA (positive affect) NA (negative affect)
Item Attentive, interested, alert, enthusiastic, excited,
inspired, proud, determined, strong, and active
Distressed, upset, hostile, irritable, scared, afraid, ashamed, guilty, nervous, and jittery
Figure 7: Watson and Clark’s 20 item distribution over PA and NA in PANAS.
Figure 8: PANAS Questionnaire. (L Jeana & Magyar-Moe, 1988, p 52)
2.2.2 Visual-based mood self-sampling techniques
SAM
Figure 9. Self-Assessment Manikin (SAM), top panel rates the affective dimensions, middle panel arousal and the bottom panel rates dominance. (M. M. Bradley and P. J. Lang, 1994, p 51)
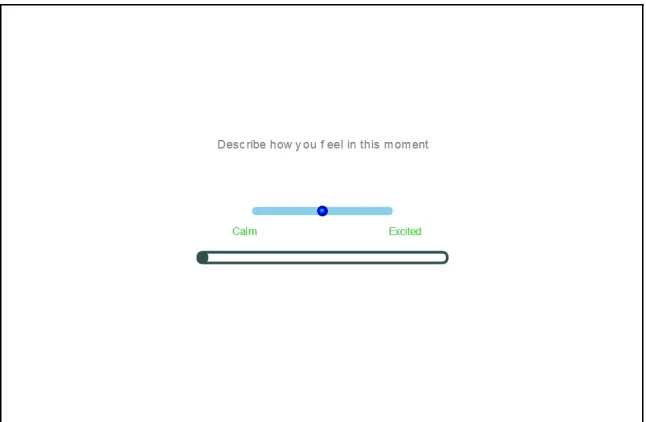
Affective Slider
In addition, the affective slider is another user self-mapped mood feedback measurement technique developed by Betella and Verschure (2016), as seen in Figure 10. The Affective Slider is a combination of SAM and the circumplex Russell model. The Affective Slider is a digitalised self-report mood tool, and it consists two sliders which makes it possible to give feedback on pleasure and mood quickly. The statistical research stated the Affective Slider is as useful as SAM, following time-consuming statistical testing.
Figure 10. The Affective Slider. The top slider reports arousal and the bottom lider reports pleasure. (A. Betella and P. F. M. J. Verschure, 2016)
VAS
mark, a score is conducted, which is the distance from the negative anchor to the mark of the participant.
Figure 11: A VAS bipolar scale, showing one of the 16 items. (Bond, 2015)
2.2.3 Ways to ask for mood feedback
Many researchers worked on how to ask for mood feedback. Findings from multiple studies are described.
Mood diaries
Mood diary methods are ways to ask for mood feedback; it is an interval contingent sampling technique. It involves completing a diary or a survey, after a certain amount of time. For example daily in the evening before going to bed. Questions about the experience of the participant are answered. Subjects regarding food, mood and any experience are addressed.
A typical daily diary study duration is from one to three weeks. After two to four weeks the quality of the data collects decline, possibly due to participants. (Stone et al., 1991). Daily diaries are popular because they make administration of emotions easy. Primarily when the surveys are collected through internet implementations. Popularity is also caused by the fact that these diaries are a form of low-frequency sampling and have the option to include many items. According to Parkinson et al. (1995) are end-of-day diaries and hourly diaries close to each other in correspondence. Noë et al. (2017) researched the differences between current or daily mood diaries. The outcome of the research is that both current and daily feedback can be used to map mood. Daily feedback is preferred when it is essential that the survey has high compliance, however it is less accurate. Current surveys are more accurate but sometimes not executed because the user is not always able to comply.
creation.’ Gamification only works when correctly designed. Just the fact that something is a game does not make it engaging. According to Fogg and Huotari, persuasive technology and gamification are both focussing on the user aspect of the product, putting the user in the centre of the design process will cause better and more engaging design. However, some constraints and critical points will be taken into account. In short, persuasive technology and gamification could make the product more engaging, but only if executed correctly.
There are different ways of adapting persuasive technology into a design, focussing on different aspects. To begin with, a well-known method is to make use choice architecture. Firstly, Thaler and Sunstein (2009) state: “A good system of choice architecture helps people to improve their ability to map and hence to select options that will make them better off.” They listed six
so-called NUDGES: iNcentives, Understanding mappings, Defaults, Give feedback, Expect error and Structure complex choices. Secondly, another way of adapting persuasive technology into a design is the Fogg Behaviour Model (FBM), as seen in Figure 12. Fogg (2009) stated that his model is the product of three factors: motivation, ability and triggers. The assets of the FBM model include a sufficient motivation, the ability to perform the behaviour and be triggered to do such behaviour. These assets should occur at the same time otherwise the person that should perform the desired behaviour will not succeed doing this. Three types of triggers exist
according to BJ Fogg in 2009: signals, spark and facilitators. Thus, since incentive of the NUDGES model is in close relation to motivation in the FBM model, both describe ways of adapting persuasive technology into a design are overlapping. Both ways are focussing on different aspects of design with the user as a central focus point. In short, using both NUDGES and FBM give the aimed user self-reported emotion feedback system useful design input to improve engagement.
Figure 12: A Behavior Model for Persuasive Design. ( B.J. Fogg., 2009)
application. One ESM version has strong gamification elements, and the other version does not. In total 24 participants took part in the user study. The results of this research are fascinating. A definite positive outcome of the study is that the leaderboard and score functions benefit the motivation and effectiveness of the participants. An example of negative influence within the same study is when the participants are facing a time challenge; causing negative impacts on motivation and effectiveness of participants.
The outcome of this study gives insight into the effectiveness of gamification, not facts. According to the study, more additional research needs to be done to make clear statements about the findings.
2.2.5 Conclusion
The research question how to design an engaging mood experience self-sampling system is explored. Some of the sub-research questions have been partly answered.
First of all the question what the best technique is to ask for mood feedback is partly answered by some studies. Researchers developed questionnaire based mood self-sampling techniques as well visual based mood self-sampling techniques. Since the mood experience self-sampling system preferably is not time-consuming for participants, the Affective Slider and SAM are interesting and could be possibly used as a technique to ask for mood feedback from the user. More research on what is the best technique to ask for mood feedback need to be conducted. Secondly, the ideal location for a user self sampled mood feedback system will need more research since no studies are found regarding this.
Thirdly, the way the system should ask for mood feedback from the user is answered and explored. Possibilities include mood diaries, the experience sampling method, event sampling and sensor sampling. Where experience sampling method and sensor sampling is most interesting to implement.
Lastly, the question how to keep users motivated and interested to give feedback will be answered by making use of persuasive technology techniques. These techniques, including NUDGES and FBM, can help to guide the designer into the right direction regarding keeping the user interested and not annoyed. Gamification can help to keep users motivated, however, this statement needs more testing to be valid.
4.5 Requirements first iteration
The project direction together with the state of the art, background research and iPACT are used to form the following requirements according to MoSCoW method.
Must
● Make use of the Escalade to generate physiological data; ● Generate a mood label to make supervised learning possible;
● Use a mood model or a mood sampling technique to generate mood feedback to form a mood label;
● Ask the user for self-reporting mood feedback; ● Make the user fill in their mood by themselves; ● Save this mood feedback;
● Give the user an indication of when to give mood feedback; ● Be wearable and easily accessible.
Should
● Save the mood feedback in a database together with the physiological sensor data; ● Give feedback to the user, makes visible what the user will give as an input;
● Make the user willing to give feedback by making use of persuasive technology; ● The sampling technique must be understandable for people with less knowledge of
technology;
● Be understandable by users of all ages.
Could
● Make the random mood feedback more valuable (avoid many neutral states in samples);
● Stimulate the users to give better feedback.
Won’t
● Include AI to determine the moment when the system is most uncertain about the user’s mood;
● Avoid generation of biased samples by users, due to the fact when someone asks someone about their mood, their thinking causes inauthentic feedback;
● Use peaks in physiological sensor data as an indication to ask for mood feedback; ● Implement gamification to make use of peer pressure to make people give more
4.6 First Ideas
4.2.1 Self-sampling techniques
During the background research phase, explored is research regarding mood models and mood self-sampling techniques. Four sampling techniques are favourable. The first sampling
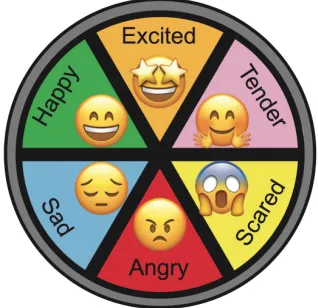
technique is a six-slice wheel with emotions: anger, disgust, fear, happiness, sadness, tender and surprise as seen in the left interface of Figure 13. For the user, this model is rather easy and intuitive for the user. They select how they feel, and the selectable emotions are simple.
Figure 13: a six-slice wheel representation with 6 basic emotions and emoji representations.
Figure 14: an eight-slice wheel representation making use of the Plutchik circumplex.
Figure 16: Valance and Arousal slider sampling technique.
4.2.2 Self-sampling locations
The above described self-sampling techniques will be located in a device on the user's body. Favourable is easy access, intuitive and some more technical and practical aspects. Important is that giving mood feedback is not time intensive.
The first location, as illustrated in Figure 17, would be to place the device on the
Escalade, making it easy to implement technically. Some constraints about the user raising their shirt to be able to give feedback will cause issues.
Figure 17: Self-sampling feedback system directly on the Escalade.
Figure 18: Self-sampling feedback system on the Escalade with magnets.
Additionally, a key hanger could be used to give mood feedback. However it is also not in direct connection to the Escalade, and it needs power supply etcetera to be able to work, it is more discreet and maybe even more accessible. Figures 19 and 20 illustrate this keychain design.
Figure 19: valance and arousal slider keychains
Figure 20: 6 slice circular mood selection keychain
option because it is easily accessible and in the worst case, a cable connection to the Escalade is possible.
Figure 21: valance and arousal slider wristband, illustration left, real life paper prototype version right.
Lastly, a smartwatch interface is an option to give self-sampling mood feedback as seen in Figure 22. The user will select emotions to give feedback. Gamification options for later stages of the design make this option interesting, but the fact that it is hard to connect a Teensy microprocessor to an Android smartwatch makes this option less desirable.
Figure 22: first idea of mood sampling personal input system
4.2.3 Own judgement on ideas
In Figure 17 a personal indication of the design assets regarding self-sampling techniques is rated. “+1” means that the design has an extra focus on this aspect. “0” means neutral and “-1” means less useful on that particular aspect.
From this quick rating scheme in Figure 23, rating different sampling techniques, both the six-wheel representation with emoji’s and the eight wheel representation are favourable. Moreover, according to Figure 24, rating different sampling locations, a wristband and smartwatch are preferred.
Hallway usability testing in combination with expert testing will make a final decision regarding both design choices.
Sampling method sliders Plutchik model
representation
6 slice wheel with emotions
regular end users to give as much as possible insight into a sample of 20 people. As seen in Appendix E.1 the session starts with a short introduction video introduce the participant to the project. The footage is from a self-conducted interview with Neidlinger. Figure 25 shows a screenshot of this video. Afterwards, explained and presented are the different sampling techniques. The user will fill in the first part of the questionnaire and help is provided if needed. Afterwards, illustrated are the sampling locations with small models of the valence and arousal slider. The researcher explains that all sampling techniques are placeable on all the locations. The questionnaire ends with a grid asking for the favourable sampling technique on the favourable location. In Appendix E.2 a script of the co-design actions is provided.
Figure 25: Screenshot interview Kristin Neidlinger.
4.7.2 Results open questions and extra feedback
Appendix E.3 contains the extra feedback notes form. For every participant, extra notes
regarding the design options are written down if necessary while explaining the different options to them. Also, discussed below are the answers to the open questions.
In general, respondents said about the sampling techniques that SAM is unclear, the used images to represent valence, arousal and dominance are unintuitive. The valence and arousal sliders are unclear at first. Also, the top slider (arousal) is less clear than the bottom slider. (valance) Indicating the smileys next to the sliders need replacement.
Next, the six-slice wheel representation is clear and intuitive, the used smileys are likeable, but it lacks options according to some users, making the eight-slice wheel representation the better option.
Should
● Save the mood feedback in a database together with the physiological sensor data; ● Give feedback to the user, makes visible what the user will give as an input;
● Make the user willing to give feedback by making use of persuasive technology; ● The sampling technique must be understandable for people with less knowledge of
technology;
● Be understandable by users of all ages and education level;
● Should be (partly) discrete to use in case of location;
Could
● Make the random mood feedback more valuable (avoid many neutral states in samples);
● Stimulate the users to give better feedback.
Won’t
● Include AI to determine the moment when the system is most uncertain about the user’s mood;
● Avoid generation of biased samples by users, due to the fact when you ask someone about their mood, their thinking causes inauthentic feedback;
● Use peaks in physiological sensor data as an indication to ask for mood feedback. ● Implement gamification to make use of peer pressure to make people give more
5. Specification
The specification phase will take a closer look at the functionalities of the creative idea, which is a result of the ideation phase.
5.1 FICS
In this section, the system will be explained using the FICS method. FICS described the system through the eyes of the designer.
Functions and events:
The primary function of the system is to generate a mood label by asking the user to fill in the 8-slice wheel representation questionnaire. Additional the system should show the user feedback on mood. The mood feedback needs to be saved in a database together with the sensor data generated by the Escalade.
Interaction and usability issues:
The mood feedback system is wearable for the user and is in connection with the Escalade. The system asks the user to give feedback by a signal, gives feedback to the user regarding what they filled in and has an option to save the data.
Content and structure:
The mood feedback system will save the data on an SD card together with sensor data from the Escalade sensors by making use of an algorithm.
Style and aesthetics:
The system is supposed to feel solid and needs to look white, in line with the Sensoree design vision.
5.2 Brainstorm
Appendix D shows a brainstorm exploring the implementation options for the eight-slice wheel representation. Explored are some niches like the indication of different mood level. These could be represented by blinking, light intensity or the amount of LEDs illuminated.
Participants preferred the eight-slice wheel representation. However, the six-slice wheel
representation with emoji’s is more evident according to the questionnaire results. Therefore the use of emojis and colours representing moods should be explored. Additionally, buttons,
5.5 Second usability test
From the first hallway test, most favoured is the eight-slice wheel representation. The second hallway testing fill focus on implementing this self-sampling technique in a physical form
regarding the electronics to be used, additionally the question if adding smileys to the eight-slice wheel representation would be preferred is researched. Also, options regarding selecting the moods will to be mentioned, conducted are three possible options: buttons, capacitive sensing area’s and a slider on the side as seen in Figure 26. Figure 27 shows two interface options, one with and one without emojis representing moods.
Additionally, a combination of light and sound, as being described in Section 5.3.2 is researched to be attention-grabbing enough. Lastly, this usability test includes if the illumination level of LED’s gives a proper indication of the selected emotion.
Figure 26: Interface with buttons, interface with capacitive sensing, interface with slider.
5.5.1 Script hallway usability test
First of all the participant is introduced to usability test by a small introduction text on the first page. Additional questions can be asked by the participant if necessary. An self made animations video, as seen in Figure 28, in the questionnaire is used to illustrate the mood selection interface for buttons and capacitive sensing, together with the notification animation, more clearly. After completing the video the participant is asked to fill in the first part of the questionnaire. The questionnaire can be found in Appendix F.1.
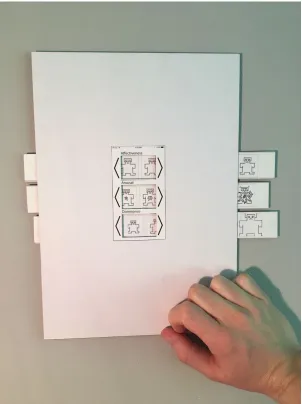
Afterwards, the researcher will explain and illustrate the three interface options by making use of paper prototypes as illustrated in Figure 26. The researcher will explain that these paper
prototypes are representing wristbands, in case this might not have been clear. Also, presented is an animation video, as seen in Figure 29. To clarify the particular option. The user is asked to fill in the next part of the questionnaire.
Afterwards, the researcher will place two interfaces on each arm of the participant. On the one arm an interface with emoji’s and on the other arm an interface without emojis. The user is asked to fill in their preference in the questionnaire.
Lastly, the researcher will show all options, with and without emojis and with all selection options.
Figure 29: Screenshot video illustrating the slider selection method
5.5.2 Results questionnaire
12 respondent took place in the hallway usability testing procedure (n=12). In Appendix F.3 the results of the open questions of the questionnaire are illustrated in graphs.
Regarding the question of the used way to ask for feedback, a combination of light and sound grabs attention. The user is asked to fill in a 1 to 5 scale to determine the intensity grabbing attention. The used method scored 4,167 which indicated the used method, a combination of light and sound, is adequate to grab the user and its surroundings. Making the used spark effective.
Since in Section 5.4 the level indication of the intensity of the LED’s was favourable, user preference is tested to determine if the idea works. According to a 1 to 5 scale in which five means the method is effectively showing the selected mood level. The technique scored 3,91, indicating the used technique is sufficient.
The next question asks for the participants' opinion about three selection methods to select moods in the eight-slice wheel representation. 83,3% of the respondents preferred a button interface because buttons give click feedback and the fact that pressing multiple times reflects the intensity of an experienced mood. For example, when one is angry pressing multiple times is intuitively reflection to a more intense feeling of anger. The slider is stated to be too time-consuming.
Afterwards, presented is a question regarding the use of emojis. 66,7% of the respondents prefer the emoji representation. The emojis are more illustrative and make the moods more clear. However, emojis might be childish for some users and are less visually pleasing. Also, participants stated some smileys do not truly reflect the moods.
5.5.3 Conclusion usability test
selected mood is sufficient. Moreover, the respondents prefer buttons to select moods. Lastly, emojis can represent moods. However, the combination of emojis and colours would please more respondents of the usability test. Additionally, the emoji’s should be made more visually pleasing and less childish.
5.6 Representation of emotions
5.6.1 colours representing emotion
Section 2.1.8 includes research on colour psychology. The eight-slice wheel representation includes the moods: anger, boredom, fear, joy, sadness and surprise, trust and interest.
According to the background research the colour red, a warm colour, could evoke
feelings like anger. Therefore it can be used to represent the anger in the feedback system. The colour blue can be a representative of feelings like sadness and indifference. Indifference, meaning a lack of interest, is the opposite of interest, which is in this representation surprise. Therefore blue can also represent the mood of surprise. The colour green is peaceful and calming; therefore it can be used to represent trust. However, darker green implies masculinity, conservative and wealth. This in is close relation to things people are attached to, dependant on a fearful stigma implies to it. The colour black is a better representation of fear since it implies evil. But LED's cant show black. Therefore dark green will be used to represent fear. Yellow is the optimistic colour, perfect to represent joy. Purple stands for sophistication which according to some people can be boring. Especially for adventure seekers, therefore purple can be used to represent boredom. However, argumentation is not bonding. Lastly, the colour orange implies excitement and enthusiasm, feelings associated with interest. Therefore orange can represent interest. Again as being said by Elliot and Maier (as cited in Cherry, 2018), not much scientific research has been done on the use and representation of colour. Using colour is therefore open of own interpretation.
5.6.2 Emojis representing emotion
Figure 30: smiley matrix with numbers used in the emoji emotion questionnaire.
According to the results, option 3 in Figure 30 mostly represents joy. 47,5% of the respondents preferred this option. Option 7 represents fear. However only 33,3% of the respondents
preferred this option, no other option collected a percentage close to 33,3%. Option 14 best represents surprise, according to 66,7% of the respondents. 42,9% of the respondents said option 9 is best representing sadness. 52,4% of the respondents stated option 32 is best represents boredom. Anger should be represented by option 48 according to 57,1% of the respondents. Option 110 is on a scale of 1 to 5 only scoring 2.71 on representing trust. While 30% of the respondents explicitly choose option 56 to be best representing of trust. Option 57 is on a scale from 1 to 5 only scoring 2,43 on representing interest. While 33,3% of the
respondents explicitly choose option 56 to be best representing of trust.
5.5 Design choices
According to the questionnaire results, buttons are favourable, and the light intensity representing the intensity of the selected mood is sufficient. Due to the outcome of the questionnaire the mood level representation with 3 LEDs for each mood is dropped. So an interface with buttons and LEDs which make use of light intensity to show the mood level is preferred.
Since, according to the usability test, the combination of light and sound is sufficiently attention-grabbing, this method to ask for feedback needs to be implemented.
Additionally, as an outcome of the usability test, the use of colour and emoji’s is preferred to please as many users as possible. From background research on colours representing emotions and an additional questionnaire about emojis, drawn are the following conclusions:
● Anger: will be represented by the colour red and emoji option 48.
● Boredom: will be represented by the colour purple and emoji option 32. ● Fear: will be represented by the colour dark green and emoji option 7.
● Joy: will be represented by the colour yellow and emoji option 3.
● Sadness: will be represented by the colour dark blue and emoji option 9.
● Surprise: will be represented by the colour blue and emoji option 14.
● Trust: will be represented by the colour green and emoji option 56.
5.7 Functional system architecture/dataflow
Based on the requirement list in Section 5.6 a functional system architecture is put together. The architecture of the to design system is described in two levels. Level 0 is a simplified overview of the system, and level 1 gives a more detailed overview of the system.
5.7.1 Level 0
The level 0 architecture gives an overview of the complete system. Figure 31 illustrates the level 0 architecture.
Figure 31: Level 0 architecture.
Level 0 consists of two inputs, the mood input from the user and the physiological data. The mood data is the mood the user will fill in by making use of the eight-slice wheel representation, and the physiological data includes heart rate, skin conductance, breathing rate, and angular velocity.
Also, three outputs are distinguished, first of all, one output flow is asking the user for mood input, the other one gives direct feedback regarding the moods filled in by the user. The generated data by the prototype is the last output and should be readable for further research.
5.7.2 Level 1
Figure 32: Level 1 architecture.
The architecture shows the data flow within the to be designed prototype. First of all the prototype will include a timer function (within the algorithm), that will generate a request for feedback every 15 to 20 minutes. Three to four times an hour is set to be the feedback frequency. However, more research is desired to determine the ideal feedback frequency.
mood. At the same time, temporarily saved are the mood states. When the user is okay with the selected mood state, the enter button can be used to send the mood state to the Escalade.
6. Realisation
The realisation phase focuses on the implementation of previous findings in a prototype.
6.1 Programming language
For the creation of the prototype, used is an Arduino prototyping base. Using this base is considered most practical since the Escalade, which is part of the final prototype is built using this prototyping environment. This environment consists of Arduino Boards and Arduino IDE, which can be used to design and upload algorithms to the boards. The boards is a Teensy 3.2 since it is much more compact and powerful than the original Arduino Uno board.
6.2 Wristband
Figure 33: Wristband prototype
First first the wristband prototype, as seen in Figure 33, is designed, including hardware, software and casing. The designed software of the wristband is accessible in appendix H. Figure 33 illustrates the electrical circuit of the wristband part of the prototype. The wristbands consist out of the following components:
● A round protoboard;
● NeoPixel Ring with 16 RGB LEDs; ● Nine mini push buttons;
● PJRC Teensy 3.2 microcontroller; ● Wires;
● Piezo buzzer; ● 3D printed casing;
Figure 33: Electrical circuit wristband
The wristbands casing will be a combination of plexiglass, 3D printed plastic and elastic strap band.
One of the requirements in Section 5.6 is the use of colour and emoji to represent mood. The use of plexiglass enables the LEDs to shine through the casing, giving the prototype a smooth finish. Additionally, engraved are simplified versions of emojis in the plexiglass buttons.
According to the usability test in Section 5.5 the used emojis could be seen as childish. Using simplified colourless versions of the used smileys in the questionnaire might be seen as less childish.
Figure 34: Plastic laser-cut shapes
The 3D printed casing is designed to keep electronics safe and out of reach of the user. Figure 35 shows the 3D printed model in which the top and bottom plate, the buttons, and the
electronic circuit is placed.
Figure 35: 3D print model casing wristband.
6.3 Update Escalade
Like said before, established is, due to time constraints, serial communication between the wristband and the Escalade. A wireless connection would take more time to establish. Additionally, the wristband would need a power supply, making the wristband bigger and
The original Escalade software and original circuit as described by Harmsen (2017) is updated. Figure 36 shows the updated combined circuit of the original escalade and the wristband device. The two wires that form the connection between both devices represent the serial communication. In Appendix H.4 a bigger version of the schematics of Figure 36.
Figure 36: Prototype circuit
6.3 Software
According to the system architecture in Section 5.7.2 software is created. The wristbands software is accessible in Appendix H.1 and includes all functionalities described in the top part of the system architecture. The Escalades software, as created by Harmsen (2017), is updated. The updated version is accessible in Appendix H.2.
6.4 Bluetooth protocol for mac
To be able to start and stop the Escalade from measuring physiological data used is a Bluetooth protocol. Due to the fact when one measures biomedical data on someone, no connection with the power net should be there. Due to safety reasons (Harmsen, 2017). In Appendix H.3 a description for Mac users to be able to connect and instruct the Escalade to do measurements.
6.5 Generated data
Figure 37: SD card .txt file showing an EMOTIONS file together with sensor data.
7. Evaluation
In this chapter, the test performed with the prototype developed in the realisation phase, are described, and drawn are conclusions from this test.
7.1 functional test
Before the user test can take place, performed is a functional test. The functional test will assure the prototype meets most of its requirements. The prototype needs t meet all “Must have”
requirements. Preferred is that the prototype also meets most of its “Should have” and “Could have” requirements. In Figure 36 all requirements are listed, and for each requirement,
determined is if the prototype has met this requirement. Most of the “Must Have” requirements and some of the “Should Have” requirements are checked off. The user test will focus on some “Should Have” requirements as well the general view of the prototype by possible users.
# Requirement Checke
d off
Must have
1 Make use of the Escalade to generate physiological data. x
2 Use the 8-wheel representation, represent every emotion with colour and an emoji, to generate a mood label to make supervised learning possible.
x
3 Ask the user for self-reporting mood feedback, by making use of a combination of light and sound.
x
4 Give feedback to the user, the intensity of the selected mood should be represented by the illumination intensity of the LEDs (more illumination represents a more intense emotion).
x
5 Make the user fill in their mood by themselves. x
6 Save this mood feedback in a database. x
7 Give the user an indication of when to give mood feedback. Needs testing
8 Be wearable and easily accessible by making use of a wristband. Needs testing
● Give feedback to the user, the intensity of the selected mood should be represented by the illumination intensity of the LEDs (more illumination represents a more intense emotion);
● Make the user fill in their mood by themselves; ● Save this mood feedback in a database;
● Give the user an indication of when to give mood feedback; ● Be wearable and easily accessible by making use of a wristband;
Should
● Show weak, basic and intense written out to make it easier for the user to give mood feedback (instead of just the basic emotion);
● Emoji adjustable to users preference or be better-representing emotions; ● Both the Escalade and the wristband need to become smaller to improve
wearability and discretion;
● Save the mood feedback in a database together with the physiological sensor data; ● Give feedback to the user, makes visible what the user will give as an input;
● Make the user willing to give feedback by making use of persuasive technology; ● The sampling technique must be understandable for people with less knowledge of
technology;
● Be understandable by users of all ages and education level;
● Should be (partly) discrete to use in case of location;
● Make use of a spark as a trigger as described in Fogg (2009);
● Successfully use the Fogg Behaviour Model to make the user give mood feedback.
Won’t
● Include AI to determine the moment when the system is most uncertain about the user’s mood;
● Avoid generation of biased samples by users, due to the fact when you ask someone about their mood, their thinking causes inauthentic feedback;
● Use peaks in physiological sensor data as an indication to ask for mood feedback. ● Implement gamification to make use of peer pressure to make people give more
Lastly, explored is a technique to make the user willing to give mood feedback.
According to background research making use of persuasive technology, techniques would give a solution. However, implementing this into a prototype has been partly successful.
Implementing the FBM model is stated inefficient by the user test. The NUDGES model, however, seems to be working, since the participants in the user test stated that the use in therapeutic treatments would make them willing to use the device. The device outside of therapeutic treatments, however, is stated unlikely motivational.
The implementation of the findings of the research questions into a prototype is proven successful by the functionality test together with the user test. As a result of the realisation phase, built is a prototype meeting most requirements.
8.2 Recommendations
he prototype conducted for this thesis is working and meets most of the requirements. Met are all the “Must have” requirements. However, according to the user test, some new requirements need implementation:
● Show weak, basic and intense written out to make it easier for the user to give mood feedback (instead of just the basic emotion);
● Emoji adjustable to users preference or be better-representing emotions;
● Both the Escalade and the wristband need to become smaller to improve wearability and discretion;
● Successfully use the Fogg Behaviour Model to make the user give mood feedback.
Please note the user test consists of with only two participants. More participants will lead to more insights towards a better design. Therefore the last requirements should be seen as indications. Strongly advised is to conduct more user tests to determine a better requirement iteration.
However, some new requirements need implementation the designed prototype is ready for the implementation of AI. Which is the next step for the project.
Appendix
A. Mind Map
C. Expert meeting Troung
Please note the recording started late in the conversation. And the description below is a wrap up.
Brouwer: Volgens mij heb ik hem.
Truong: Lukt dat zo?
Brouwer: Volgensmij wel.
Truong: Staat hij aan?
Dus jij zegt het overkoepelende doel is het automatisch herkennen van emoties.En hoe doe je dat?
Doormiddel van AI techniek.
Wat heeft een AI techniek nodig om automatisch emoties te herkennen.
Brouwer: Ja.
Truong: Dat heet supervised learning/ machine learning.
Truong: We zijn op zoek naar een ‘experience sampling methode’ die we kunnen gebruiken om een dataset te generen. Het beste is om de persoon op het moment dat de persoon een emotie heeft deze meteen te laten invullen. Dat gaat niet lukken, want daarvoor moet AI al aanwezig zijn.
Brouwer: Random sampling zou dan dus kunnen.
Truong: Random, om of het uur, of iets dergelijks.
Brouwer: Eigenlijk is ideaal gezien, wanneer het systeem het meest onduidelijk is over
de emotie die de gebruiker heeft, feedback het meest bruikbaar. Dan moet die AI er ook al zijn. Dus een random functie is daarom voor nu beter.
Truong: Nadeel van de random functie is dat er veel onbruikbare info zal zijn. Ik voel mij
neutraal, ik voel niks. De gebruiker meer dan alleen neutraal laten invullen.
Brouwer: Wat als we de feedback aan een piek hangen.
Truong: Daar zat ik ook net aan te denken.
Brouwer: Hier heb ik ook naar gekeken in het vooronderzoek.
Truong: Dat zou eventueel een goed idee zijn.
Brouwer: Moeten we dan de sensoren gebruiken van de Escalade om even de piek te t racken met een algoritme.
Truong: Dan moet je ‘even’ zo’n algoritme bedenken. Denkende aan dat iedereen een andere baseline heeft etc. Wat het wel lastig maakt.
Brouwer: Ik zou dit wel kunnen uitwerken, maar als ik niet zo ver kom, geeft dat natuurlijk
onduidelijkheid.
Truong: Je moet wel iets testen, dus als je niet zo ver komt moet je het niet uitwerken.
E. First usability test
E2. Script usability test
Script Usability test
1. Introduction to what we do
We are designing a system that can detect mood. It consists of a combination of
biosensors, mood feedback and machine learning. To determine what the best way would be to obtain mood feedback we ask for your participation in this usability test.
2. Play video
3. Order showing sampling techniques 1. SAM
2. Valence and arousal sliders
High valence: an event is positive.
Low valence: an adverse event.
High arousal: one is in a state of alertness.
Low arousal: means the opposite.
4. Fill in first part of questionnaire Be around but not too present!
5. Order showing locations
First place all the locations on the test subject/participant
Order:
1. On Escalade -> normally under shirt, but easier for now 2. Wristband
3. Smartwatch 4. Key hanger
6. Fill in first part of questionnaire Be around but not too present!
E3. Form for extra feedback
Form Extra feedback # respondent:
Sampling techniques; SAM
Valence and arousal sliders
6 slice representation
8 slice representation
Emotion I II III
Joy
Trust
Surprise
Sadness
Disgust
Anger
Anticipation
Sampling locations; On Escalade
Wristband
Smartwatch
Key hanger
Other
Additional notes
E4. Questionnaire responses
F. Second usability test
F.2 Script usability test
Script Usability test
1. Introduction to what we do
2. Interface options
Tell the participant there are three interface options: one with buttons, capacitive sensing and with a slider system. The first video shows the interface for buttons and capacitive sensing.
3. Let the participat watch the video (interface buttons/capacitive sensing) and answer the first part of the questionnaire.
4. Let the participant watch the video for the slider interface and show the paper models with all 3 options. Let the participants wear them and explain additionally to the video’s what they do.
Order of showing paper prototypes: - buttons
- Capacitive sensing - slider
5. Place on the one arm of the participant a smiley representation interface and on the other arm a representation with only colours. And let him fill in the questionnaire.
6. Show the participant all options on the table and let him fill in the last part of the questionnaire.
G. Emoji emotion questionnaire
serialPrintln("Stop measuring"); }
H.3 Bluetooth protocol
Step 1: Turn on the escalade and open Bluetooth settings in the System Preferences menu. In the list of devices the Escalade should be visible.
Step 2: Click on the Escalade and fill in the code: 1234 to pair the Escalade to your Mac.
Step 4: Open Terminal application and type: ls /dev/tty.*
Step 5: type ‘screen’ + the Escalades vales from the list and end with 38400 (the baud rate) In the case of the Example it will be: screen /dev/tty.Escalade-DevB 38400
Step 6: you now enter the serial communication screen as seen in the screenshot below:
● Type /a to start recording, as seen in the screenshot below:
I. User test
I.1 Script
Script User test
1. Introduction to what we do
We are designing a system that can detect mood. It consists of a combination of
biosensors, mood feedback and machine learning. To determine what the best way would be to obtain mood feedback we ask for your participation in this usability test.
2. Play video “Interview Kristin Neidlinger”
3. Show the device, explain how it works.
The escalade will be placed on your chest to measure your physiological data. The wristband device will be placed on your left wrist.
There are 8 emotions, represented by color and emojis. You can select multiple emotions and for each emotion the level of intensity.
Give mood feedback when the system asks you to do so.
Answer additional questions by the user.
4. Ask the participant to fill in the consent form. (Appendix I.2)
4. Place the prototype on the participant.
5. Participant will be asked to use the device for a minimum time of 3 hours.
6. After 3 or more hours a semi-structured interview takes place. Questions/subjects as in Appendix I.3 will be addressed.
I.2 Consent form user test
Consent form for participating in user test
This form is about your participation in a user test for the development of a mood recognition system. The user test is carried out by R.Brouwer, student Creative Technology, at the EEMCS faculty of the University of Twente.
- you have the right to decline answer any question, to stop the user test or to withdraw your participation at any time, without consequences
- Physiological sensor data in combination with your mood feedback is generated. This data is saved without your personal information to determine if the system works and will be deleted afterwards. The interview recording will be used to transcript only and will be deleted afterwards.
- your anonymity in this project will be protected. The subsequent use of recordings and data will be done using Universities policies protecting anonymity of individuals and institutions
- questions about the research and the process can be addressed to: R.Brouwer, [email protected]
- queries, complaints or comments about the research can be addressed to the project supervisor:
dr. ir. E.Dertien, [email protected]
- you have read and understand the explanation provided
The participant The researcher
Name: ……… Name: ………
Date: ……… Date: ………
Signature: ……… Signature: ………
I.3 Interview user test questions
Interview user test questions (subjects to address)
2. Do you know what the quantified self movement is?
3. Do you think personal data logging is useful to gain self knowledge about your emotions and body?
---
4.1 Was it clear how to use the mood feedback device?
4.2 Are the moods on the device representative of your felt emotions?
4.3 Did the colours represent the moods according to you?
4.4 If there was an option to fill in a neutral mood state, would you use that one out of laziness?
---
5.1 Was it clear when to give mood feedback?
5.2 Would people in other age categories or capabilities understand how to use the mood feedback device?
---
6.1 Did you think more about your emotions using the mood recognition system?
6.2 Would this add on to self-awareness regarding moods?
7.1 Is it discreet using a mood recognition system?
7.2 Did the combination of sound and light grab your attention?
7.3 Did the combination of sound and light to grab your attention annoy you or others around you?
7.4 Did the annoyance of others regarding u using the device make u willing to give feedback?
8. Is the mood feedback device wearable and easy accessible?
---
8. What did you think of the frequency you are asked for mood feedback?
8.1 What would be the ideal sample rate according to you?
---
9. Would you be willing to wear such device in daily life in order to improve treatments regarding mental or physical health?
I.4 Interviews
Interview participant #1
Brouwer: Allereerst bedankt voor het meedoen aan de user test.
Participant: Geen probleem!
Brouwer: Mag ik vragen om je leeftijd en opleidingsniveau?
Participant: Ik ben 22 jaar en momenteel bezig met mijn bachelor.
Brouwer: Wat vond je ervan?
Participant: Aan het begin moest ik een beetje wennen want ik voelde mij benauwd met het prototype om mijn borst. Maar ik kon mij goed vinden in elke emotie, ik had niet het gevoel dat ik er een miste. Het werkte allemaal goed, het was ook niet storend
om in te vullen. De invultijd is ook kort. Ik had er geen last van om feedback te geven tijdens het werken.
Brouwer: Dat klinkt goed. Als het systeem je vroeg om feedback te geven, was dat dan storend? Afleidend?
dat wel vervelend is. Zonder het piepen had ik niet gemerkt dat ik feedback moest
geven.
Brouwer: Je bedoelt dat als er alleen een licht signaal zou zijn dat dat niet voldoende is?
Participant: Het piepen maakt voor mij duidelijk dat ik moet invullen. Mensen in mijn omgeving merkte het licht juist op.
Brouwer: Als het systeem om jouw feedback vraagt, en mensen in je omgeving zien dat, voel je dan druk om hem snel in te vullen? Omdat zij dan geen last hebben van het signaal?
Participant: Ze hebben er geen last van, maar ze waren wel erg nieuwsgierig.
Brouwer: Omdat die mensen zo nieuwsgierig zijn, was het dan wel mogelijk om het discreet te gebruiken? Het zou zo kunnen zijn dat jij het vervelend vind, om wat voor reden dan ook, dat anderen kunnen zien dat je zo’n device gebruikt.
Participant: Ow zo, nou ik had wel een paar keer dat ik boredom in zou vullen, terwijl de
rest van mijn projectgroep juist druk aan het werk is. Sociaal gezien zou ik dan interest, joy en surprise moeten invullen.
Ik had het gevoel dat er meer negatieve emoties te selecteren waren.
Brouwer: Het device is zo opgesteld dat twee uiterste emoties aan elkaars weerzijden staan. Zo zijn joy en sadness tegen tegenover gesteld.
Participant: Misschien was ik vandaag dan in een meer negatieve bui dan normaal.
Brouwer: Dat zou heel goed kunnen. Heb je ook het idee dat je, door het invullen van je device, meer stil staat bij je eigen emoties?
Participant: Ja tuurlijk! Soms moest ik meer nadenken over hoe ik mij precies voelde, ook qua intensiteit. Dat vond ik lastig, ik was bezig met iets wat mij interesseerde, maar ben ik nou een beetje of heel erg geïnteresseerd? Daar moest ik extra over
nadenken, daardoor kon het invullen ook langer duren. Er waren ook momenten
dat ik al wist hoe ik mij voelde en ik het zo kon invullen.
Participant: Nee.
Brouwer: Zou het bij kunnen dragen aan self-awareness, aangezien dit device jou er, meer of minder, toe dwingt om daarbij stil te staan?
Participant: Ik dacht wel, toen ik boredom level 3 had ingevuld, dat ik andere mensen moest zoeken om te helpen met dat onderdeel van het project.
Brouwer: Dus omdat je stil stond bij je eigen emoties heb je andere keuzes gemaakt omtrent je gevoelde emotie?
Participant: Ja eigenlijk wel. Later merkte ik o