International Journal of Scientific Research in Computer Science, Engineering and Information Technology © 2018 IJSRCSEIT | Volume 3 | Issue 1 | ISSN : 2456-3307
Sudanese River Nile State Integrated Water Resources
Jehan Mohmed Sharief
*1, Abbas Abd Alla Ibrahim
2, El Sadig El Hadi El Hassan
3 *1Faculty of Civil engineering, Sudan University of science & Technology, Khartoum , Khartoum North, Sudan2Faculty of Water & Environmental Engineering, Sudan University of science & Technology, Khartoum , Khartoum North, Sudan 3,1Faculty of Civil engineering, Sudan University of science & Technology, Khartoum, Khartoum South, Sudan
ABSTRACT
With the objective to study integrated water resources management River Nile State of Northern Sudan was taken as a pilot area. The integration adopted the approach concept of integrated water resources (IWR) which required the determination of River Nile State surface water, rain water and ground water quantitatively and qualitatively. Simple statistical models as well as sophisticated softwares and advanced statistical models were applied. These included beside the means, standard deviations, the more sophisticated statistical parameters such as coefficient of variation, skewness and their corrections. These adopted softwares in this research are considered the keys leading to solution of the problems and fulfilling the objectives to create an integrated water resources management body in the River Nile State pilot area, to travel parallel with the expected present and future population growth.
Keywords : integrated water resources means, standard deviations, coefficient of variation, skewness.
I.
INTRODUCTION
Water is basic for life and economic development. Mar Del International Conference in 1977 recommended that industrial arrangement should ensure development and management of water resources. In 2000 Global Water Partnership (GWP) defined IWRM as a process of developed management of water to maximize economic and welfare. In Dublin guiding principles four principles were revealed. The first used fresh water as a finite resource, the second water management based on a participatory approach, third women important role, and forth water management an economic good. Water Resources Management (WRM) started a long time ago, while Integrated Water Resources Management IWRM is a recent technique. However it is well known that water demand and supply are
water resources if he was able to manage his available domestic industrial and agricultural water resources.
The main objective of this research is to suggest an integrated water management methodology in the River Nile State pilot area. The integration adopted the approach of (IWR) which required the determination of River Nile State surface water, rain water and ground water quantitatively and qualitatively in the pilot area. The concept of Integrated Water Resources Management (IWRM) and its relations with the type of the source of water whether ground, surface or rain water is inherently knitted with the study objectives and problems. Likewise the different uses of water whether domestic, industrial or agricultural are also inherently knitted with the objectives and problems. Therefore simple statistical models as well as sophisticated analyses are pivotal to reveal the fulfillment of the objectives and the solution of their associated problems.
These are dealt with in succession starting with first category of the types of water resources which is conventionally and clearly referred to as Integrated Water Resources (IWR) .This was then followed by the use of the models in the second category of the resources conventionally referred to as Water Resources Management (WRM).The integration lead to solution of desertification drought, and undesired man activities. It attracted people who previously left their farms to travel back to their lands. This in tern enhanced development management program policies. It stopped bank erosion and flooding Town. River Nile State is suffering from drought due to the desert forming most of its area. The River Nile State is located between longitudes 15 and 30 east and latitudes 22 and 16 north. The total area of fertile land or arable land in the River Nile State is estimated as 3.289 million feddans. In the River Nile State rainfall is erratic variable and not reliable. River Nile State cultivates many crops, such as palms, citrus, wheat and broad beans. Water sources in the River Nile State are mainly from the River Nile.
Figure 1 : Map of Sudan With River Nile State
B. Methodology
2013 population of the River Nile State increased continuously, that required revision of water management. Food and Agricultural Organization (FAO) water report 2005 indicated that there was a problem in water in the River Nile State. The River Nile State depends on the Nile River as a source of water; with its cities and villages spread along its banks.
The River Nile State has great potentials of water that is not exploited. The River Nile State is the state that has the greatest area of desertification in the Sudan. The data to be collected in IWR consisted of and included precipitation data, ground water level,drawdown or pumping lift data, and flood or discharge measurement data. The population data is essential forming the main beneficiaries of the study objective. It is fortunate that the quality of the three types of water rain surface and ground water in the River Nile State was tested according to the Sudan by laws and World Health Organization (WHO) and was perfectly suitable for use.
C. Data Collection and Analysis
The data obtained from Meteorological Authority and the Ministry Of Irrigation, was analyzed by suitable programs to obtain the results. Modeling the data was very essential which led to the achievements of the research specific objectives. The achievements included quantitative determination of surface and ground water together with rain water in the pilot area. The same approach could be used to estimate production of isohyetal rainfall map of River Nile State area, together with rehabilitation of meteorological stations for early warning system against floods, and droughts. It could also be used to reveal capacity building needed to technical staff to develop the area of the River Nile State. However, care was focused on water estimation only, forming the part of the objectives. This study involved using Statistical Package of Social Sciences (SPSS). (SPSS) is a software that can analyze most types of data. It can
two aspects. It could also be original scaled data, usually programmed as questionnaires, interval or, ratio data. The data used in this study are interval and ratio data. (SPSS) is suitable software, because it is easy and accurate (Andrew Garth-2008).Some advantages of (SPSS) can find both means and medians. It can also graph data on a box plot, showing both level and spread indicating any outliers.Furthemore it also reveals the differences or correlation between elements of the available data.
III.
RESULTS AND DISCUSSION
Table (1) shows the population growth and future forecast of the River Nile State .There was a noticed population decrease after 1983 due to the population movements to other jobs such as gold mining and attractive salaries of the then new cement factories.
Year
Total
Table 1 : Population in River Nile State
against desertification through stakeholders, including None Governmental Organizations (NGOs) and association with awareness spread, being the well known tools that help in (IWRM) in the state. These last ambitious changes which are adopted in this research are considered the keys leading to solution of the problems and fulfilling the objectives to create an integrated water management body in the River Nile State pilot area, to travel parallel with the expected present and future population growth. Using the collected data and analysis, applying simple correlation regressions analyzing the results of the analysis and its effects on the River Nile State problems, further in depth discussion was found necessary. More advanced analysis was conducted, and discussed in relation with (IWRM). The advanced discussion included some simple and advanced statistical model analysis. These included beside the means, standard deviations, the more sophisticated statistical parameters such as coefficient of variation, skewness and their corrections. They involved use of the famous statistical tables of Foster Hazin and Fuller equations. The use of these model equations together with the known statistical coefficient and parameters has paved the road of fulfilling the study objective together with their inherently knitted problems.(Murray R.Spiegel,1972,New York,Schaums Series).Table Hazin ,together with Foster table (I) and Foster table (III),are given in appendix (A),are available in many hydrological text books.
The average value of any statistical relevant parameter given as for example the discharge (Q), by the equation:- average rainfall in m m./year.
=
n
The number of years of records.(Murray R.Spiegel, 1972, New York, Schaums Series)
factor to skewness coefficient =6
( Murray R.Spiegel,1972,New York,Schaums Series) The discharge for recurrent return periods is
obtained by the equation:-
The above is the application of Foster table (1); the same is applied on Foster (III) and Hazin table. Fuller equation is expressed as :- (Murray R.Spiegel, 1972, New York, Schaums Series)
Application of the Concept Relation Among the Three Water Resources IWR:-
According to the data collection in the River Nile State the three types of water rain water, surface water, and ground water are available. The statistical analyses were applied on the three of them.
Rain Water:- The three metrological stations Atbara, Hudiba and Shendi of River Nile State are studied using the concept relation among the three water resources and IWR. There is always rainfall in the River Nile State in the months June July, and August
in every year, but it is frequently very little and very limited, usually characterized by being unstable .The River Nile State swings between repeated droughts. This is translated into harmful effects on grazing rainfall agriculture. It has also deep and profound effects on surface water recharge in River Nile River Atbara and Hafiers, together with painful low groundwater recharge resulting from short rainfall periods. The application is conducted in the three stations:-
Atbara Station:-
Table 2. Total Rainfall Atbara Station 1981 to 2010
Foster I
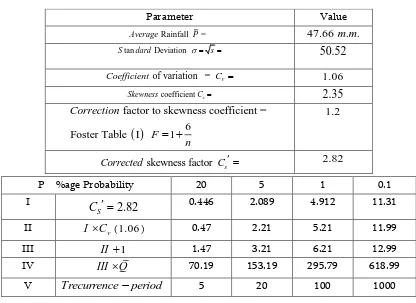
Table 3. Total Rainfall Atbara Station Parmeters Values1981 to 2010
factor to skewness coefficient =
Log – Log
Fig 2. Log Log Total Rainfall Atbara Station Foster I
Foster III
Table 4. Total Rainfall Atbara Station Parmeters Values1981 to 2010
Corrected skewness= 3.01
P %age Probability 20 5 1 0.1
I
3.01
S
C
0.42 2.02 4.02 7.25II ICv(1.06) 0.45 2.14 4.26 7.68
III II 1 1.45 3.14 5.26 8.68
IV III Q 68.88 149.70 250.73 413.90
V Trecurrenceperiod 5 20 100 1000
Parameter Value
Rainfall =
Average P 47.66 . .m m
tan Deviation
S dard s 50.52
of variation = v
Coefficient C 1.06
coefficient s
Skewness C 2.35
factor to skewness coefficient =
8.5 Foster Table I 1 Correction
F
n
1.28
skewness factor s
Log – Log
Fig 3. Log Log Total Rainfall Atbara Station Foster III
Hazin
Corrected skewness= 3.01
P %age Probability 20 5 1 0.1
I 3.01 0.42 2.02 4.02 7.25
II ICv(1.06) 0.45 2.14 4.26 7.68
III II 1 1.45 3.14 5.26 8.68
IV III Q 68.88 149.70 250.73 413.90
Fig 4. Log Log Total Rainfall Atbara Station Hazin
Fuller
1 0.80log T
T
Q
Q
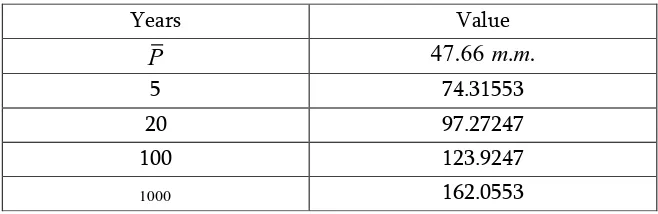
Table 5. Total Rainfall Atbara Station Parmeters
Values1981 to 2010
Years Value
P
47.66 . .m m5 74.31553
20 97.27247
100 123.9247
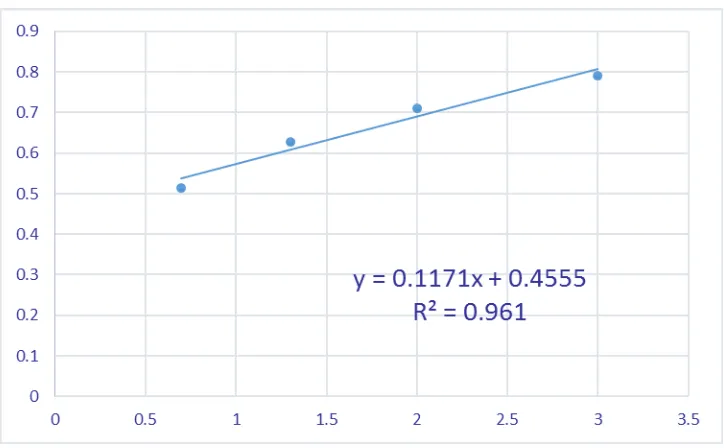
Fig 5. Log Log Total Rainfall Atbara Station Fuller
Tables 6. Statistical Analysis Total Rainfall Atbara Station
Expected Population
P %age Probability
Years Foster I Foster III
Hazin Fuller Average
2209122 20 5 70.2 68.9 61.8 74.3 68.8
2886931 5 20 153.2 149.7 162.8 97.3 140.8
12029844 1 100 295.8 250.7 265.9 123.9 234.1
Fig 6. Log Log Total Rainfall Atbara Station Average of Foster I,III,Hazin and Fuller
Conducting the same approach for the other two rainfall stations namely Hudiba and Shendi Stations,applying the equations from (1) to (10) to each .Tables (7),for Hudiba Station and table(8) for Shandi station are shown. Also table 9):Log Log Total Rainfall for Hudiba Station Average of Foster I,III,Hazin and Fuller,together with table 10):Log Log Total Rainfall for Shendi Station Average of Foster I,III,Hazin and Fuller are shown.Figures (7),and (8),are log log presentations for Hudiba and Shendi Stations
Table 7. Total Rainfall Hudiba Station 1981 to 2010
Tables 9. Statistical Analysis Total Rainfall Hudiba Station
Expected Population
P %age Probability
Years Foster I Foster III
Hazin Fuller Average
2209122 20 5 65.51 63.26 56.04 73.05 64.47 2886931 5 20 144.10 141.57 155.73 95.61 134.25 12029844 1 100 289.83 239.94 257.95 121.81 227.38
113046820 0.1 1000 640.47 403.87 387.74 159.29 397.84
Fig 7. Log Log Total Rainfall Hudiba Station Average of Foster I,III,Hazin and Fuller
Tables 10. Statistical Analysis Total Rainfall Shandi Station
Expected Population
P %age Probability
Years Foster I Foster III
Hazin Fuller Average
2209122 20 5 122.75 121.75 123.02 116.47 121.00 2886931 5 20 205.42 203.36 210.08 152.44 192.83 12029844 1 100 303.13 293.81 292.02 194.21 270.79 113046820 0.1 1000 454.49 416.68 372.89 253.97 374.51
y = 0.3349x + 1.6373
R² = 0.9673
0 0.5 1 1.5 2 2.5 3
Fig 8. Log Log Total Rainfall Shendi Station Average of Foster I,III,Hazin and Fuller
The rain analysis being part of the first category of the types of water was carried out. It was conventionally referred to as Integrated Water Resources (IWR) .The average value of the statistical relevant parameter given as the total rainfall instead of the discharge (Q), was obtained using equation (1).The steps of the analysis conducted the remainder of the other equations, the last one of which was Fuller equation (10).
The application of the statistical analysis leading to the results for rain water in the River Nile State for the three rainfall stations are given in table (11) , and graph in figures (9),together with population growth.
Tables 11 : Statistical Analysis Total Rainfall River Nile State
P %age Probability 20 5 1 0.1 Remark
Expected Total Rainfall 84.76 155.96 244.10 389.85 Average
P
T
Recurrence eriod
5 20 100 1000Expected Population 2209122 2886931 12029844 113046820
y = 0.2081x + 1.9794
R² = 0.96
0 0.5 1 1.5 2 2.5 3
Fig. 9. Statistical Analysis Total Rainfall River Nile State Surface Water:-
Conducting the same approach for surface water as for rain water, use of the same previous equations (1) to (10),were adopted. These covered Tamaniat Gauging Station Hasanab Gauging Station,Girba gauging Station and K.3 Atbara Gauging Station.These stations have complete data as that of Atbara ,Hudiba and Shedi Rainfall Stations.
The application of the statistical analysis led to the results for surface water in the River Nile State. This was obtained by adding the differences in discharges between Tamaniat and Hasanab Stations, to that between Girba and K3 Atbara Stations. Their detailed data are not shown in this paper, but the conducted statistical analysis is shown in table (12), with the total State surface water in figure (10). Beside giving the statistical analysis for the addions of these differences table (12) gave the expected population increase.
Tables 12 : Statistical Analysis Total Surface Water River Nile State Expected
Population
P %age Probability
Years Foster I Foster III
Hazin Fuller Average
2209122 20 5 25.67 25.51 25.69 30.03 26.72
2886931 5 20 36.41 36.19 37.06 39.31 37.24
12029844 1 100 49.01 47.99 47.72 50.08 48.70 113046820 0.1 1000 68.22 63.98 58.19 65.49 63.97
y = 0.2812x + 1.7828
R² = 0.9681
0
0.5
1
1.5
2
2.5
3
Fig 10. Total Surface Water River Nile State Average
Ground Water :-
The River Nile State underground water is not replenished, while the available ground water is taped from wells. The ground water data is treated in the same way as that of the surface water. There is no recharge occurring in the River Nile State Table (13),shows statistical analysis total ground water in River Nile State, and figure (11),gave the statistical analysis total groundwater in River Nile State
Tables 13 : Statistical Analysis Total Ground Water River Nile State Expected
Population
P %age Probability
Years Foster I Foster III
Hazin Fuller Average
2209122 20 5 3.18 3.18 3.25 3.46 3.26
2886931 5 20 4.15 4.14 4.16 4.53 4.25
12029844 1 100 5.00 5.01 4.73 5.77 5.13
113046820 0.1 1000 5.99 5.99 5.17 7.54 6.17
y = 0.1618x + 1.3397
R² = 0.9739
0 0.2 0.4 0.6 0.8 1 1.2 1.4 1.6 1.8 2
Fig 11. Statistical Analysis Total GroundWater ln River Nile State
Estimated Water Resources IWR:-
It is well known and logical to assume that the consumption of water to be 137.5,137.5 and 1375 liters per person per day respectively in arid and semi arid regions as that of the River Nile State.
According to the above analysis of the three types of water rain, surface and ground, the following calculations are conducted as shown in table (14).
Volume of surface water = area covered by the surface water X water or rain depth. area covered by the surface water as calculated from the field =
40 10 m
6 2Table 14. Estimated Water ResourcesUsing the Concept of IWR
Item Recurrent Period
Type of water Probability % Quantity m
3
m
Population
1 5 Rain Water 20 3.400 2209122
20 5 6.200 2886931
100 1 9.760 12029844
1000 0.01 15.600 113046820
2 5 Surface Water 20 26.72 2209122
20 5 37.24 2886931
100 1 48.70 12029844
1000 0.01 63.97 113046820
3. 5 20 3.26 2209122
20 5 4.25 2886931
100 1 5.13 12029844
1000 0.01 6.17 113046820
Table 15. Result of (IWRM ) From (IWR) Concept
It should be clearly stated the surface water included the transboundary that pass to Egypt which is 55.5
per year.
Milliards
Table (14),has a minimum of26.72 being less than Egypt and a maximum of 85.74 greater than Egypt share, which can be attributed to calculation errors due to incomplete and unreliable
Despite of its vast desert area in the River Nile State yet it is rich in cement industry and gold mining.
Atbara River annual discharge yield approach about 14 milliards.
After the construction of Tekazi dam the discharge at Girba Gauging Station has an unmeasured increase,the flow became continuous all the year while there was no flow in the perion from February to May.
V.
RECOMMENDATIONS Proper management utilization of the River Nile State water resources can reduce desert encroachment enhance cement industries and gold mining.
Lack of accurate discharge measurement data in both the main Nile and Atbara River formed
a bottle neck against the development of the River Nile State.
The increased discharge from Tekazi dam has improved the situation at both New Halfa Scheme especially during May for sugar demand and increasing the potentiality dpownstrean in the River Nile State.
Evapotranspiration being greater than effective rain is a problem that requires future research and solution.
Considering the population of the River Nile State and the available rain water,surface water and ground water it is apparent that these waters lead to a good comfortablle integrated water resources in the pilot area state.
VI.
REFERENCES
[1]. Diana Rizzolio Karyabwite -Water Sharing in the Nile River Valley UNEP/DEWA/GRID -Geneva -January -March 1999 January-June 2000
[2]. Essam Hassan Mohamed Ahmed PhD Lead Author, Nubian sandstone aquifer system-, August 27, 2013
[3]. Andrew Garth, Analyzing data using SPSS- Sheffield Hallam University, 2008
[4]. Central Bureau of Statistics cbs -Sudan in figurers -2014 source
[5]. Dr: Isam Mohamamed Abd Elmagid-Prof Abbas Abdalla -Hydrology- Published by Sudan Uneversity of science -2002
Appendix I
Hazen Table
s
C
%age probability
99
95
80
50
20
5
1
0.1
0.01
0.001
0.0001
0
-2.11
-1.64
-0.92
0
0.92
1.64
2.08
2.39
2.53
2.59
2.62
0.2
-1.91
-1.56
-0.93
-0.05
0.89
1.72
2.25
2.66
2.83
2.94
3.00
0.4
-1.75
-1.47
-0.93
-0.09
0.87
1.79
2.42
2.95
3.18
3.35
3.44
0.6
-1.59
-1.38
-0.92
-0.13
0.85
1.85
2.58
3.24
3.59
3.80
3.92
0.8
-1.44
-1.30
-0.91
-0.17
0.83
1.90
2.75
3.55
4.00
4.27
4.34
1.0
-1.30
-1.21
-0.89
-0.21
0.80
1.95
2.92
3.85
4.42
4.75
4.95
1.2
-1.17
-1.12
-0.86
-0.25
0.77
1.99
3.09
4.15
4.83
5.25
5.50
1.4
-1.06
-1.03
-0.83
-0.29
0.73
2.03
3.25
4.45
5.25
5.75
6.05
1.6
-0.96
-0.95
-0.80
-0.32
0.69
2.07
3.40
4.75
5.67
6.25
6.65
1.8
-0.87
-0.87
-0.76
-0.35
0.64
2.10
3.54
5.05
6.08
6.75
7.20
2.0
-0.80
-0.79
-0.71
-0.37
0.58
2.13
3.67
5.35
6.50
7.25
7.80
Foster Table (I)
s
C
%age probability
99
95
80
50
20
5
1
0.1
0.01
Foster Table (III)
%age probability
s
C
99
95
80
50
20
5
1
0.1
0.01
0.001
0.0001
0
-2.33
-1.64
-0.84
0
0.84
1.64
2.33
3.09
3.73
4.27
4.76
0.2
-2.18
-1.58
-0.85
-0.03
0.83
1.69
2.48
3.38
4.16
4.84
5.48
0.4
-2.03
-1.51
-0.85
-0.06
0.82
1.74
2.62
3.67
4.60
5.42
6.24
0.6
-1.88
-1.45
-0.86
-0.09
0.80
1.79
2.77
3.96
5.04
6.01
7.02
0.8
-1.74
-1.38
-0.86
-0.13
0.78
1.83
2.90
4.25
5.48
6.61
7.82
1.0
-1.59
-1.31
-0.86
-0.16
0.76
1.87
3.03
4.54
5.92
7.22
8.63
1.2
-1.45
-1.25
-0.85
-0.19
0.74
1.90
3.15
4.82
6.37
7.85
9.45
1.4
-1.32
-1.18
-0.84
-0.22
0.71
1.93
3.28
5.11
6.82
8.50
10.28
1.6
-1.19
-1.11
-0.82
-0.25
0.68
1.96
3.40
5.39
7.28
9.17
11.21
1.8
-1.08
-1.03
-0.80
-0.28
0.61
1.98
3.50
5.66
7.75
9.84
11.96
2.0
-0.99
-0.95
-0.78
-0.31
0.61
2.00
3.60
5.91
8.21
10.51
12.81
2.2
-0.90
-0.89
-.75
-0.33
0.58
2.01
3.70
6.20
--
--
--
2.4
-0.83
-0.82
-0.71
-0.35
0.54
2.01
3.78
6.47
--
--
--
2.6
-0.77
-0.82
-0.68
-0.37
0.51
2.01
3.87
6.73
--
--
--
2.8
-0.71
-0.71
-0.65
-0.38
0.47
2.02
3.95
6.99
--
--
--