Fuzzy V-Measure – An Evaluation Method for
Cluster Analyses of Ambiguous Data
Jason Utt, Sylvia Springorum, Maximilian Köper, Sabine Schulte im Walde
Institut für Maschinelle SprachverarbeitungUniversität Stuttgart
[uttjn|riestesa|koepermn|schulte]@ims.uni-stuttgart.de
Abstract
This paper discusses an extension of the V-measure (Rosenberg and Hirschberg, 2007), an entropy-based cluster evaluation metric. While the original work focused on evaluating hard clusterings, we introduce the Fuzzy V-measure which can be used on data that is inherently ambiguous. We perform multiple analyses varying the sizes and ambiguity rates and show that while entropy-based measures in general tend to suffer when ambiguity increases, a measure with desirable properties can be derived from these in a straightforward manner.
Keywords: clustering, evaluation, ambiguous data
1.
Motivation
Ambiguity is ubiquitous in language and thus methods for dealing with ambiguous data are essential for robust sys-tems and accurate representations in natural language pro-cessing. Many well-developed machine learning methods employclusteringas a main or pre-processing step. While simple clustering methods are often directly applied to un-ambiguous data (e.g. in computer vision), un-ambiguous data poses a problem in that in general, multiple labels will ap-ply to a single data point. One common workaround is to simply assume the data can be represented unambiguously and to assign simple labels, e.g. in the case of verb clas-sification (Merlo and Stevenson, 2001; Schulte im Walde, 2006). On our view, soft clustering techniques represent the most natural strategy for representing ambiguous data. An important issue for such an investigation using soft clus-tering approaches, is the necessity of suitable evaluations of the soft cluster analyses, which are less developed and have not seen widespread acceptance so far. A standard evalua-tion method such as purity,
pur(C) = 1
N ·
X
j
maxk|cj∩gk| (1)
which computes the average overlap of a cluster with any group, does not intuitively fit a situation in which most class members belong to multiple classes.
Our work aims to fill this gap. We propose to extend the V-measure (Rosenberg and Hirschberg, 2007), which is an entropy-based measure developed for unlabeled cluster evaluation to handle ambiguous data, i.e. data which be-longs to multiple classes in the gold standard.
The structure of the paper is as follows: Section 2 discusses the intuitions underlying the V-measure. Section 3 then ex-pands on these intuitions defining the more general fuzzy V-measure. An analysis of the fuzzy V-measure is presented in Section 4. In Section 5, we further address the issues underlying all evaluations based on contingency tables and present a possible solution. Section 6 concludes the paper.
2.
Entropy-based measure: V-Measure
Besides V-measure, there exist other information-based measures – e.g., Variance of Information (VI) (Meil˘a,
2007), with variants suggested by (Vinh et al., 2010) – how-ever, we consider the intuitions and computational simplic-ity of V-measure, i.e. entropy gain and loss, to be useful. In addition to the standard evaluation of a cluster analy-sis against a gold standard set of classes, the V-measure also allows for the comparison of two completely indepen-dent clusterings – with no restrictions in their similarity, the number of data points, or the number of clusters. In this paper we will adopt the terminology of clusters being com-pared against classes, assuming we have a gold standard classification of our data.
v(C), the V-measure of a clustering C, of a set of data points is defined as a weighted mean of two complemen-tary properties of the two partitionings of the data set. Each of these two constitute a particular desirable property for a clustering. The first is termedhomogeneity,
hom(C) =
(
1 ifH(C, G) = 0;
1−HH((CC,G|G)) else (2)
which gives a measure of how homogeneous the clusters in the clustering are. Here, H is the standard entropy:
H(C|G)denotes the conditional entropy ofCgivenGand quantifies the amount of additional information contained inCwith respect toG. The joint entropy,H(C, G), is used for normalization. The second measure,completeness(cf. Equation 3), captures how intact the gold standard classes remain with respect to the clustering:
com(C) =
(
1 ifH(G, C) = 0
1−HH((GG,C|C)) else (3)
Homogeneity. In effect, homogeneity can be viewed as a generalization of the purity measure, which is a normal-ized measure (by the number of points N) to which de-gree each clustercjcontains only members of one classgk.
Forhomthis corresponds to the amount of information the cluster contains about the class, which is high if the condi-tional entropy of the gold classes given the clustering, i.e.
H(G|C), is low. If each cluster contains only objects from one gold-standard class, then the entropy is at its minimum,
Completeness. Similar to the definition of homogeneity, completeness measures how well the classes map clusters within a cluster analysis. In the case where each gold-standard class maps only to one cluster, the clustering adds no additional information,H(C|G)and is at its minimum. This represents a maximally complete clustering, in that each gold-standard class is completely covered by a partic-ular cluster.1 The final V-measure value is then computed as a weighted harmonic mean of the two homogeneity and completeness values:
vβ(C) =
(1 +β)·hom(C)·com(C)
β·hom(C) +com(C) (4)
In this paper, we give homogeneity and completeness equal weight (β= 1),
v(C) =2·hom(C)·com(C)
hom(C) +com(C) (5)
but this can be freely chosen for a particular task depending on which measure is to be given priority.
It should be noted that in the final calculation step forhom
andcom, the polarity is reversed, i.e. when the respective conditional entropies are small, then the measure is at its maximum value1, and0in the opposite case, that is, when there is no shared information and the conditional entropies equal the joint entropy.
In order to calculate these entropy values, we must de-fine the joint and conditional probabilities across clusters and gold-standard classes. In (Rosenberg and Hirschberg, 2007), the joint probability of a cluster c and a gold-standard classgwas estimated as
ˆ
p(c, g) = |c∩g|
N , (6)
where|c∩g|is the number of data points shared bycand
g, andN is the total number of data points. This represents a problem in the case of ambiguous data, however, as there are more class memberships than data points. We will now illustrate this issue with an example.
3.
Fuzzy V-Measure
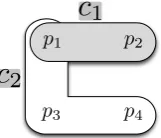
Example with ambiguous data. Suppose we have a data set with four points: p1, p2, p3, p4. These points belong to four different gold-standard classesg1, g2, g3, g4as shown in Figure 1. That is g1 and g4 each contain two mem-bersp1, p2andp2,p4, respectively;g2has three members, namelyp1, p3, p4andg3contains bothp2andp3.
Due to the ambiguity of our data, there are data points which belong to multiple classes, i.e. they are fuzzy. In order to calculate the probability as for the traditional V-measure, we would have to use a different normalizing con-stant, as the intersections of the different clusters are not disjoint, i.e.P
j,k|cj∩gk|> N. At the same time, such an
approach would give too much weight to highly ambiguous objects such asp2. E.g. we would assign the same joint
1Note that Equations 2 and 3 differ from those in (Rosenberg
and Hirschberg, 2007) in the denominators of theelsecondition because there were typos in the definitions (personal communica-tion with Andrew Rosenberg).
p1 p2
p3 p4
g
1g
2g
3g
4Figure 1: Distribution of ambiguous data.
g1 g2 g3 g4
p1 .5 .5 0 0
p2 .33 0 .33 .33
p3 0 .5 .5 0
p4 0 .5 0 .5
Table 1: Distribution of data points in gold standard.
probability to the pairp2andg4as top4andg4. Obviously, this is unrealistic:p4belongs to only two classes while,p2 belongs to three. We should thus give p2 less weight as evidence for a particular class. Our approach is straight-forward: we assign each point a total mass of 1 which is then evenly distributed among its classes, cf. Table 1. As this explicitly deals with fuzzy data, we term the resulting metric thefuzzy V-measure.
We thus generalize the counting of the original V-measure to a mass functionµ:
ˆ
p(c, g) = µ(c∩g)
M , (7)
whereµ(c∩g)is the total mass of the objects in the data shared bycandg, andM is the total mass of the cluster-ing. Note thatM will only be equal toN if each data point belongs to exactly as many classes as clusters. Using the cluster analysis shown in Figure 2, we can perform the cal-culation of V-measure on this data set. We see that cluster
c1containsp1, andp2, andc2containsp1, p3andp4. Using the new gold standard mass distributions given in Table 2, we can build the contingency for clustersc1,c2in Table 2. In this table, we see the masses for each intersection as ex-plained above, i.e. celli, jcontainsµ(ci∩gj). This then
serves to compute the joint and conditional probabilities.
p1 p2
p3 p4
c
1
c2
g1 g2 g3 g4 P
c1 .83 .5 .33 .33 = 2
c2 .5 1.5 .5 .5 = 3
Table 2: Contingency table containing mutual evidence be-tween classes and clusters.
Now we can clearly see the advantage of our approach: While bothc1andc2each share two points with the gold-standard classesg1andg2respectively, the higher ambigu-ity of p2 in the first case means there is less evidence for
c1giveng1thanc2giveng2, namely: pˆ(c1|g1) =.83/2< 1/2 = 1.5/3 = ˆp(c2|g2). Using these probabilities, we can easily compute the entropy values necessary for the calcu-lation of the V-measure. This constitutes the fuzzy calcula-tion of V-measure for a soft clustering. While the tradicalcula-tional V-measure .014 the fuzzy V score is .047. Both scores are small, but this is because all data points are ambiguous. It should be noted that the fuzzy V-measure proposed here is applicable not only when data is ambiguous with respect to the gold standard classes themselves, but it also allows for the application to soft clusterings. We have already implemented and applied this measure (Springorum et al., 2013) to soft clusterings of highly ambiguous data, namely German prepositions. In such cases, the data points may be present in multiple clusters and simply add their respective mass to the cells in the contingency table.
The following section investigates the performance of fuzzy V when applied to clusterings and gold standards of varying sizes and across multiple rates of ambiguity.
4.
Analysis of Fuzzy-V
The above example gives a general notion of distributing a data point’s mass across classes in the contingency table resulting in a higher evaluation score. In this section, we apply the two V measures in different settings to test the stability of this result.
4.1.
Experiment 1
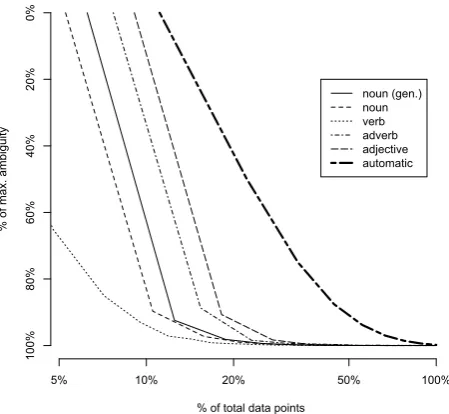
As basis for our investigations, we build artificial data, by approximating the ambiguity rates as exhibited in actual linguistic data. The ambiguity rate in a data set is the dis-tribution of class memberships – i.e. ambiguities – over all data points. In the example above, the ambiguity rate would be 2,2,2,3, as three points have an ambiguity of 2, and one point an ambiguity of 3. Figure 3 shows the ambigu-ity rates across parts of speech in WordNet 3.0 (Fellbaum, 1998). The automatically constructed ambiguity rates for our experiment were designed to give realistic ambiguity rates independent of data size, while being easy to con-struct and interpret: In the first step half of the data points are assigned an ambiguity rate of 1, i.e. they are unambigu-ous. Then, successively, the remaining data set is split in two halves, the first half is assigned an ambiguity rate one higher than the previous half. E.g., for 7 points, the auto-matically generated ambiguity rates would be 1, 1, 1, 1, 2,
% of total data points
%
o
f ma
x.
a
mb
ig
ui
ty
noun (gen.)
noun
verb
adverb
adjective
automatic
5% 10% 20% 50% 100%
100%
80%
60%
40%
20%
0%
Figure 3: Ambiguity rates across parts of speech in Word-Net 3.0. Data points are ordered left to right from less ambiguous to most ambiguous. Noun generalizations are taken from CoreLex (Buitelaar, 1998).
2, 3. In this experiment, we keep the ambiguity rate of the data set constant, while varying its size.
Data. We construct data sets with sizes ranging from 2 to approximately 1000 such that the ambiguity rates of the data points lie on the line in Figure 3. For each set of data points with their corresponding ambiguity rates, we ran-domly generate 100 gold standard classifications. These are selected uniformly from the2|G|×|C| possible
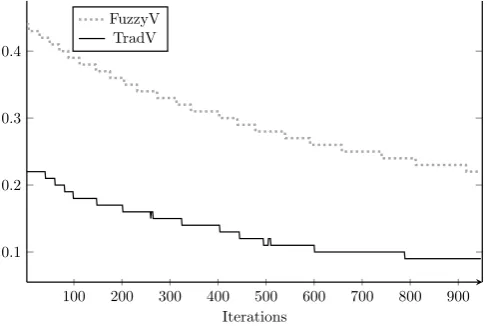
assign-ments for all classes (G) and clusters (C) for the given data points. We assume aperfect clustering for each data set, i.e. the clusters contain the same items as the classes in the gold standard. In such cases we would like to have scores close or equal to 1.
Evaluation. For each gold standard, together with its identical clustering, we evaluate the clustering using the traditional V measure as well as with our fuzzy V across the different assignments. As fuzzy V explicitly allows the assignment of multiple items to different classes (or clus-ters), we expect fuzzy V to reliably yield higher scores than traditional V.
g
1100 200 300 400 500 600 700 800 900
of Argument Structure. Computational Linguistics, 27(3):373–408.
Andrew Rosenberg and Julia Hirschberg. 2007. V-Measure: A Conditional Entropy-Based External Clus-ter Evaluation Measure. In Proceedings of the 2007 Joint Conference on Empirical Methods in Natural Lan-guage Processing and Computational Natural LanLan-guage Learning (EMNLP-CoNLL), pages 410–420.
Sabine Schulte im Walde. 2006. Experiments on the Au-tomatic Induction of German Semantic Verb Classes.
Computational Linguistics, 32(2):159–194.
Sylvia Springorum, Sabine Schulte im Walde, and Jason Utt. 2013. Detecting Polysemy in Hard and Soft Clus-ter Analyses of German Preposition Vector Spaces. In
Proceedings of the 6th International Joint Conference on Natural Language Processing, Nagoya, Japan.